Housing density: 431 houses/condos per square mile
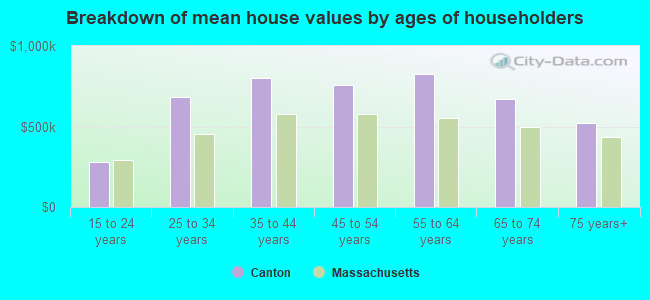
Median price asked for vacant for-sale houses and condos in 2022 in this county: $751,928.
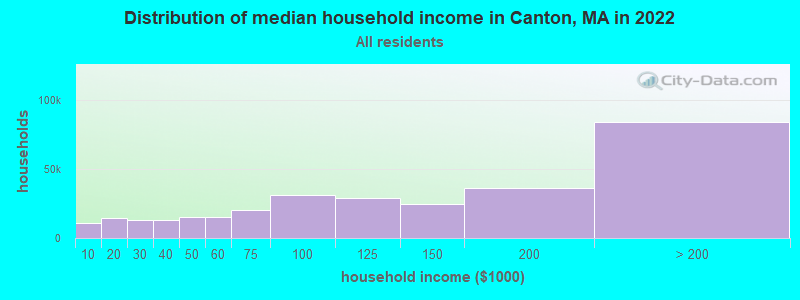
Median contract rent in 2022: over $2,000 (lower quartile is $1,266, upper quartile is over $2,000)
Median rent asked for vacant for-rent units in 2022: $3,093
Median gross rent in Canton, MA in 2022: over $2,000
Housing units in Canton with a mortgage: 3,561 (283 second mortgage, 524 home equity loan, 38 both second mortgage and home equity loan) Houses without a mortgage: 1,403
In family households: 540,608 (116,996 male householders, 51,907 female householders)
134,066 spouses, 197,825 children (189,784 natural, 4,588 adopted, 3,453 stepchildren), 7,406 grandchildren, 6,062 brothers or sisters, 7,064 parents, foster children, 5,893 other relatives, 9,006 non-relatives
In nonfamily households: 112,631 (36,559 male householders (27,334 living alone)), 52,452 female householders (43,798 living alone)), 23,620 nonrelatives
In group quarters: 17,611 (8,991 institutionalized population)
123,500 married couples with children.
20,654 single-parent households (3,498 men, 17,156 women).
87.5% of residents of Canton speak English at home.
1.6% of residents speak Spanish at home (78% speak English very well, 17% speak English well, 3% speak English not well, 3% don't speak English at all).
8.5% of residents speak other Indo-European language at home (78% speak English very well, 15% speak English well, 6% speak English not well, 1% don't speak English at all).
1.9% of residents speak Asian or Pacific Island language at home (59% speak English very well, 20% speak English well, 18% speak English not well, 3% don't speak English at all).
0.5% of residents speak other language at home (100% speak English very well).
Foreign born population: 3,351 (14.5%)
(67.5% of them are naturalized citizens)
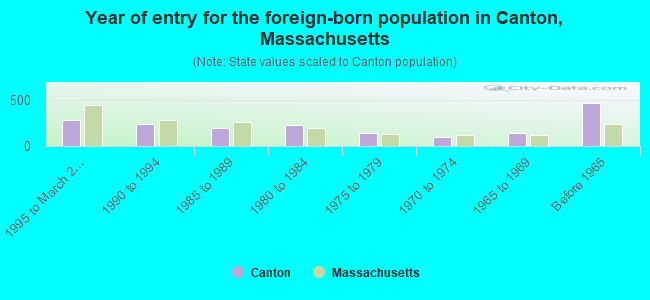
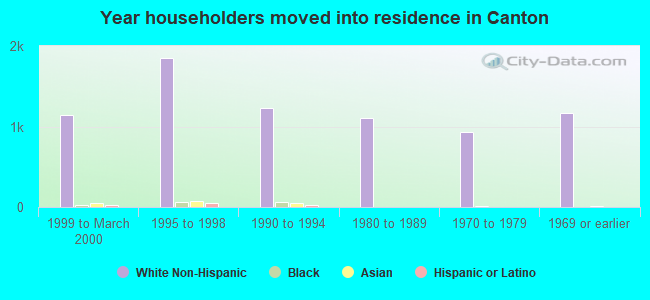
Year of entry for the foreign-born population in Canton, Massachusetts
2811995 to March 2000
2391990 to 1994
2001985 to 1989
2241980 to 1984
1381975 to 1979
1021970 to 1974
1421965 to 1969
465Before 1965
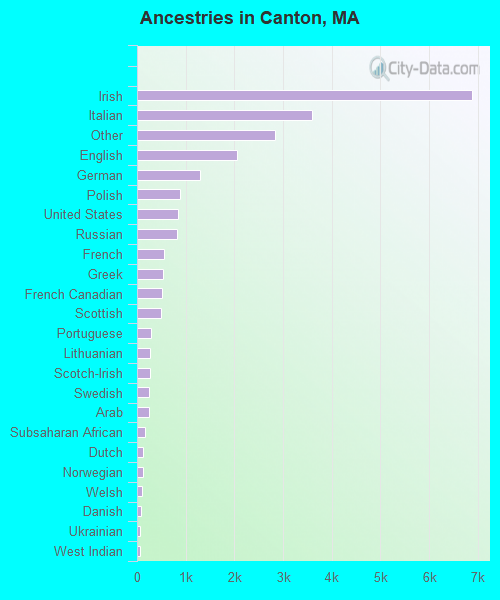
First ancestries reported:
Irish: 6,884 (29.3%)
Italian: 3,585 (15.3%)
Other: 2,833 (12.1%)
English: 2,063 (8.8%)
German: 1,291 (5.5%)
Polish: 892 (3.8%)
United States: 835 (3.6%)
Russian: 815 (3.5%)
French: 563 (2.4%)
Greek: 536 (2.3%)
French Canadian: 510 (2.2%)
Scottish: 502 (2.1%)
Portuguese: 284 (1.2%)
Lithuanian: 271 (1.2%)
Scotch-Irish: 265 (1.1%)
Swedish: 245 (1.0%)
Arab: 244 (1.0%)
Subsaharan African: 171 (0.7%)
Dutch: 121 (0.5%)
Norwegian: 119 (0.5%)
Welsh: 103 (0.4%)
Danish: 77 (0.3%)
Ukrainian: 67 (0.3%)
West Indian: 67 (0.3%)
Swiss: 55 (0.2%)
Hungarian: 30 (0.1%)
Slovak: 18 (0.08%)
Czech: 15 (0.06%)
Most common places of birth for foreign-born residents (%):
Italy
Canton:
10.8% (194)
Massachusetts:
3.7% (28,319)
Ireland
Canton:
8.2% (146)
Massachusetts:
2.3% (17,987)
Greece
Canton:
8.0% (143)
Massachusetts:
1.7% (12,975)
China, excluding Hong Kong and Taiwan
Canton:
6.4% (115)
Massachusetts:
5.1% (39,255)
Canada
Canton:
6.2% (111)
Massachusetts:
5.2% (40,247)
United Kingdom
Canton:
5.8% (104)
Massachusetts:
3.3% (25,403)
India
Canton:
5.7% (102)
Massachusetts:
3.6% (28,086)
Germany
Canton:
4.2% (76)
Massachusetts:
1.9% (14,883)
Russia
Canton:
3.8% (68)
Massachusetts:
2.3% (17,449)
Japan
Canton:
3.5% (63)
Massachusetts:
1.1% (8,682)
Other Western Africa
Canton:
3.0% (54)
Massachusetts:
2.6% (20,299)
Poland
Canton:
3.0% (54)
Massachusetts:
1.8% (13,543)
Vietnam
Canton:
2.9% (52)
Massachusetts:
3.9% (30,457)
Haiti
Canton:
2.2% (40)
Massachusetts:
4.4% (33,862)
Ukraine
Canton:
2.2% (39)
Massachusetts:
1.1% (8,754)
Other Western Europe
Canton:
2.1% (38)
Massachusetts:
0.3% (2,642)
Colombia
Canton:
2.0% (35)
Massachusetts:
2.0% (15,286)
Hong Kong
Canton:
2.0% (35)
Massachusetts:
1.0% (7,937)
Other Eastern Europe
Canton:
1.7% (31)
Massachusetts:
1.6% (12,350)
Portugal
Canton:
1.7% (30)
Massachusetts:
8.6% (66,627)
Place of birth for U.S.-born residents:
This state: 15,678
Other state: 3,155
Northeast: 1,855
Midwest: 374
South: 675
West: 251
64% of Canton residents lived in the same house 5 years ago. Out of people who lived in different houses, 50% lived in this county. Out of people who lived in different counties, 67% lived in Massachusetts.
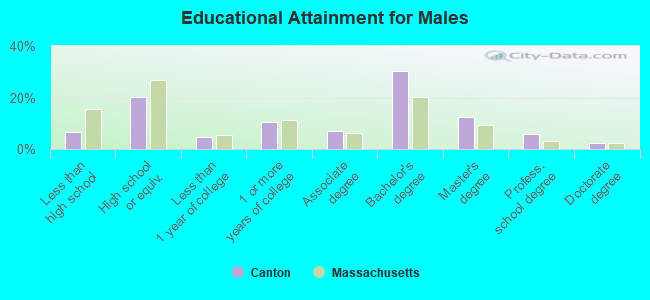
Education attainment for males 25 years and older:
No schooling: 50
Nursery to 4th grade: 0
5th and 6th grade: 59
7th and 8th grade: 57
9th grade: 42
10th grade: 116
11th grade: 25
12th grade, no diploma: 95
High school graduate (or equivalency): 1,336
Less than 1 year of college: 315
Some college more than 1 year, no degree: 688
Associate degree: 470
Bachelor's degree: 2,001
Master's degree: 817
Professional school degree: 387
Doctorate degree: 154
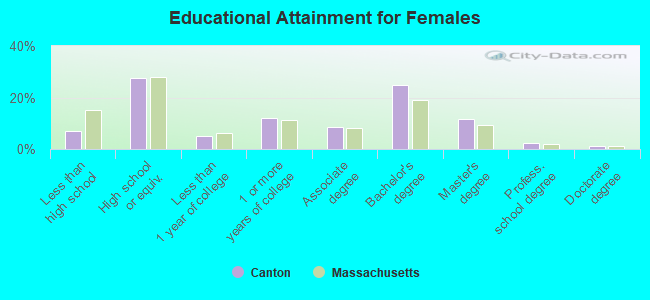
Education attainment for females 25 years and older:
No schooling: 50
Nursery to 4th grade: 23
5th and 6th grade: 64
7th and 8th grade: 96
9th grade: 41
10th grade: 101
11th grade: 29
12th grade, no diploma: 153
High school graduate (or equivalency): 2,232
Less than 1 year of college: 398
Some college more than 1 year, no degree: 984
Associate degree: 699
Bachelor's degree: 2,016
Master's degree: 948
Professional school degree: 173
Doctorate degree: 83
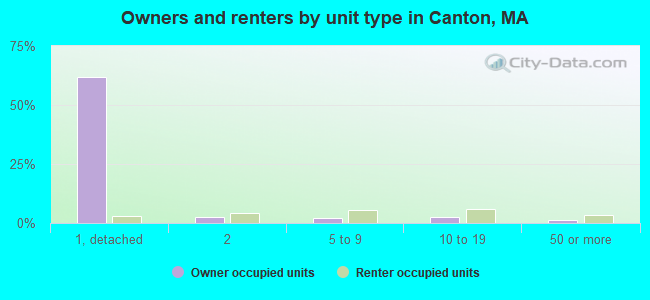
Housing units in structures:
One, detached: 5,210
One, attached: 342
Two: 569
3 or 4: 180
5 to 9: 616
10 to 19: 742
20 to 49: 161
50 or more: 343
Housing units lacking complete plumbing facilities: 0.2%
Housing units lacking complete kitchen facilities: 0.4%