Carson City, NV (Nevada) Houses and Residents
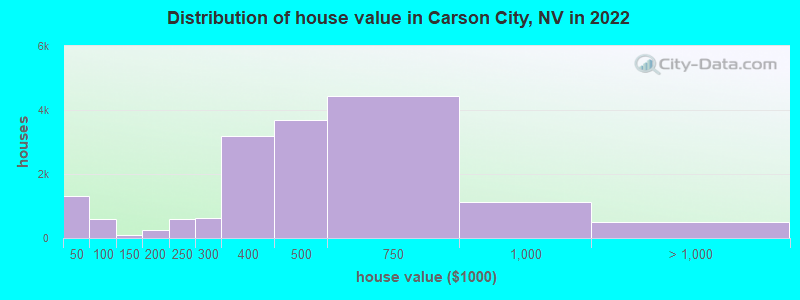
Estimated median house or condo value in 2022: $454,470 (it was $136,300 in 2000 )
Carson City:
$454,470Nevada:
$434,700
Lower value quartile - upper value quartile: $330,503 - $653,513Mean price in 2022: Detached houses: $606,279 Here:
$606,279State:
$549,327
Townhouses or other attached units: $446,034 Here:
$446,034State:
$328,893
In 2-unit structures: $339,225 Here:
$339,225State:
$326,466
In 3-to-4-unit structures: $373,762 Here:
$373,762State:
$295,216
In 5-or-more-unit structures: $154,697 Here:
$154,697State:
$297,847
Mobile homes: $81,299 Here:
$81,299State:
$159,995
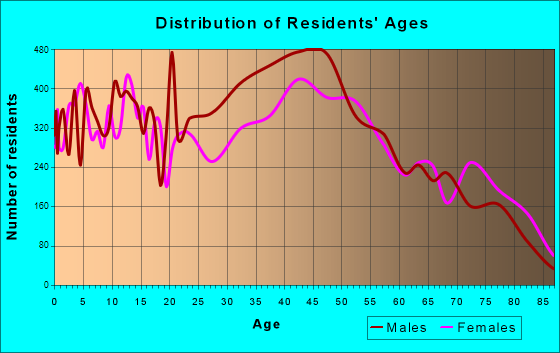
Total population: 54,522 (Urban population: 49,316, Rural population: 3,141 (all nonfarm) )
Houses: 25,406 (24,087 occupied: 14,880 owner occupied, 9,170 renter occupied )
% of renters here:
38%State:
40%
Housing density: 177 houses/condos per square mile
Median price asked for vacant for-sale houses and condos in 2022: $622,578.
Median contract rent in 2022: $1,095 (lower quartile is $832, upper quartile is $1,430)
Median rent asked for vacant for-rent units in 2022: $1,050
Median gross rent in Carson City, NV in 2022: $1,191
Housing units in Carson City with a mortgage: 8,882 (609 second mortgage, 22 home equity loan, 390 both second mortgage and home equity loan )Houses without a mortgage: 153
Median household income for houses/condos with a mortgage: $91,604
Median household income for apartments without a mortgage: $70,010
Median monthly housing costs: $1,143
Data:
Median house or condo value ($)
Median house or condo value ($ change since 2000)
Median house or condo value ($) - White
Median house or condo value ($) - Black or African American
Median house or condo value ($) - Asian
Median house or condo value ($) - Hispanic or Latino
Median house or condo value ($) - American Indian and Alaska Native
Median house or condo value ($) - Multirace
Median house or condo value ($) - Other Race
Median price asked for mobile homes ($)
Household density (households per square mile)
Mean house or condo value by units in structure - 1, detached ($)
Mean house or condo value by units in structure - 1, attached ($)
Mean house or condo value by units in structure - 2 ($)
Mean house or condo value by units in structure by units in structure - 3 or 4 ($)
Mean house or condo value by units in structure - 5 or more ($)
Mean house or condo value by units in structure - Boat, RV, van, etc. ($)
Mean house or condo value by units in structure - Mobile home ($)
Median contract rent ($)
Median contract rent - Lower quartile ($)
Median contract rent - Upper quartile ($)
Median gross rent ($)
Urban houses (%)
Rural houses (%)
Houses occupied (%)
Houses occupied (% change since 2000)
Houses owner occupied (%)
Houses owner occupied (% change since 2000)
Houses renter occupied (%)
Houses renter occupied (% change since 2000)
Vacant housing units - For rent (%)
Vacant housing units - For rent (% change since 2000)
Vacant housing units - For sale only (%)
Vacant housing units - For sale only (% change since 2000)
Vacant housing units - Rented or sold, not occupied (%)
Vacant housing units - Rented or sold, not occupied (% change since 2000)
Vacant housing units - For seasonal, recreational, or occasional use (%)
Vacant housing units - For seasonal, recreational, or occasional use (% change since 2000)
Vacant housing units - For migrant workers (%)
Vacant housing units - For migrant workers (% change since 2000)
Vacant housing units - Other vacant (%)
Vacant housing units - Other vacant (% change since 2000)
Median monthly housing costs ($)
Median household income for houses/condos with a mortgage ($)
Median household income for houses/condos without a mortgage ($)
Median household income ($)
Median household income ($) - White
Median household income ($) - Black or African American
Median household income ($) - Asian
Median household income ($) - Hispanic or Latino
Median household income ($) - American Indian and Alaska Native
Median household income ($) - Multirace
Median household income ($) - Other Race
Mortgage status - with mortgage (%)
Mortgage status - with second mortgage (%)
Mortgage status - with home equity loan (%)
Mortgage status - with both second mortgage and home equity loan (%)
Mortgage status - without a mortgage (%)
Median year house/condo built
Median year apartment built
Household type by relationship - Male householder living alone (%)
Household type by relationship - Male householder not living alone (%)
Household type by relationship - Female householder living alone (%)
Household type by relationship - Female householder not living alone (%)
Household type by relationship - Opposite-Sex spouse (%)
Household type by relationship - Same-Sex spouse (%)
Household type by relationship - Opposite-Sex unmarried partner (%)
Household type by relationship - Same-Sex unmarried partner (%)
Household type by relationship - In group quarters (%)
Size of family households - 2-person household (%)
Size of family households - 3-person household (%)
Size of family households - 4-person household (%)
Size of family households - 5-person household (%)
Size of family households - 6-person household (%)
Size of family households - 7-or-more-person household (%)
Size of nonfamily households - 1-person household (%)
Size of nonfamily households - 2-person household (%)
Size of nonfamily households - 3-person household (%)
Size of nonfamily households - 4-person household (%)
Size of nonfamily households - 5-person household (%)
Size of nonfamily households - 6-person household (%)
Size of nonfamily households - 7-or-moreperson household (%)
Year house built - Built 2010 or later (%)
Year house built - Built 2000 to 2009 (%)
Year house built - Built 1990 to 1999 (%)
Year house built - Built 1980 to 1989 (%)
Year house built - Built 1970 to 1979 (%)
Year house built - Built 1960 to 1969 (%)
Year house built - Built 1950 to 1959 (%)
Year house built - Built 1940 to 1949 (%)
Year house built - Built 1939 or earlier (%)
Median number of rooms in houses and condos
Median number of rooms in apartments
Median number of bedrooms in owner occupied houses
Mean number of bedrooms in owner occupied houses
Median number of bedrooms in renter occupied houses
Mean number of bedrooms in renter occupied houses
Median number of vehichles in owner occupied houses
Mean number of vehichles in owner occupied houses
Median number of vehichles in renter occupied houses
Mean number of vehichles in renter occupied houses
Rooms in owner-occupied houses - 1 room (%)
Rooms in owner-occupied houses - 2 rooms (%)
Rooms in owner-occupied houses - 3 rooms (%)
Rooms in owner-occupied houses - 4 rooms (%)
Rooms in owner-occupied houses - 5 rooms (%)
Rooms in owner-occupied houses - 6 rooms (%)
Rooms in owner-occupied houses - 7 rooms (%)
Rooms in owner-occupied houses - 8 rooms (%)
Rooms in owner-occupied houses - 9+ rooms (%)
Rooms in renter-occupied houses - 1 room (%)
Rooms in renter-occupied houses - 2 rooms (%)
Rooms in renter-occupied houses - 3 rooms (%)
Rooms in renter-occupied houses - 4 rooms (%)
Rooms in renter-occupied houses - 5 rooms (%)
Rooms in renter-occupied houses - 6 rooms (%)
Rooms in renter-occupied houses - 7 rooms (%)
Rooms in renter-occupied houses - 8 rooms (%)
Rooms in renter-occupied houses - 9+ rooms (%)
Bedrooms in owner-occupied houses - no bedrooms (%)
Bedrooms in owner-occupied houses - 1 bedroom (%)
Bedrooms in owner-occupied houses - 2 bedrooms (%)
Bedrooms in owner-occupied houses - 3 bedrooms (%)
Bedrooms in owner-occupied houses - 4 bedrooms (%)
Bedrooms in owner-occupied houses - 5+ bedrooms (%)
Bedrooms in renter-occupied houses - no bedrooms (%)
Bedrooms in renter-occupied houses - 1 bedroom (%)
Bedrooms in renter-occupied houses - 2 bedrooms (%)
Bedrooms in renter-occupied houses - 3 bedrooms (%)
Bedrooms in renter-occupied houses - 4 bedrooms (%)
Bedrooms in renter-occupied houses - 5+ bedrooms (%)
Vehicles available in owner-occupied houses - no vehicle available (%)
Vehicles available in owner-occupied houses - 1 vehicle available(%)
Vehicles available in owner-occupied houses - 2 Vehicles available (%)
Vehicles available in owner-occupied houses - 3 Vehicles available (%)
Vehicles available in owner-occupied houses - 4 Vehicles available (%)
Vehicles available in owner-occupied houses - 5+ Vehicles available (%)
Vehicles available in renter-occupied houses - no vehicle available (%)
Vehicles available in renter-occupied houses - 1 vehicle available (%)
Vehicles available in renter-occupied houses - 2 Vehicles available (%)
Vehicles available in renter-occupied houses - 3 Vehicles available (%)
Vehicles available in renter-occupied houses - 4 Vehicles available (%)
Vehicles available in renter-occupied houses - 5+ Vehicles available (%)
Housing units in structures - 1, detached (%)
Housing units in structures - 1, attached (%)
Housing units in structures - 2 (%)
Housing units in structures - 3 or 4 (%)
Housing units in structures - 5 to 9 (%)
Housing units in structures - 10 to 19 (%)
Housing units in structures - 20 to 49 (%)
Housing units in structures - 50 or more (%)
Housing units in structures - Mobile home (%)
Housing units in structures - Boat, RV, van, etc. (%)
Housing units in structures - Owners - 1, detached (%)
Housing units in structures - Owners - 1, attached (%)
Housing units in structures - Owners - 2 (%)
Housing units in structures - Owners - 3 or 4 (%)
Housing units in structures - Owners - 5 to 9 (%)
Housing units in structures - Owners - 10 to 19 (%)
Housing units in structures - Owners - 20 to 49 (%)
Housing units in structures - Owners - 50 or more (%)
Housing units in structures - Owners - Mobile home (%)
Housing units in structures - Owners - Boat, RV, van, etc. (%)
Housing units in structures - Renters - 1, detached (%)
Housing units in structures - Renters - 1, attached (%)
Housing units in structures - Renters - 2 (%)
Housing units in structures - Renters - 3 or 4 (%)
Housing units in structures - Renters - 5 to 9 (%)
Housing units in structures - Renters - 10 to 19 (%)
Housing units in structures - Renters - 20 to 49 (%)
Housing units in structures - Renters - 50 or more (%)
Housing units in structures - Renters - Mobile home (%)
Housing units in structures - Renters - Boat, RV, van, etc. (%)
House/condo owner moved in on average (years ago)
Renter moved in on average (years ago)
Year householder moved into unit - Moved in 1999 to March 2000 (%)
Year householder moved into unit - Moved in 1999 to March 2000 (%) - White
Year householder moved into unit - Moved in 1999 to March 2000 (%) - Black or African American
Year householder moved into unit - Moved in 1999 to March 2000 (%) - Asian
Year householder moved into unit - Moved in 1999 to March 2000 (%) - Hispanic or Latino
Year householder moved into unit - Moved in 1999 to March 2000 (%) - American Indian and Alaska Native
Year householder moved into unit - Moved in 1999 to March 2000 (%) - Multirace
Year householder moved into unit - Moved in 1999 to March 2000 (%) - Other Race
Year householder moved into unit - Moved in 1995 to 1998 (%)
Year householder moved into unit - Moved in 1995 to 1998 (%) - White
Year householder moved into unit - Moved in 1995 to 1998 (%) - Black or African American
Year householder moved into unit - Moved in 1995 to 1998 (%) - Asian
Year householder moved into unit - Moved in 1995 to 1998 (%) - Hispanic or Latino
Year householder moved into unit - Moved in 1995 to 1998 (%) - American Indian and Alaska Native
Year householder moved into unit - Moved in 1995 to 1998 (%) - Multirace
Year householder moved into unit - Moved in 1995 to 1998 (%) - Other Race
Year householder moved into unit - Moved in 1990 to 1994 (%)
Year householder moved into unit - Moved in 1990 to 1994 (%) - White
Year householder moved into unit - Moved in 1990 to 1994 (%) - Black or African American
Year householder moved into unit - Moved in 1990 to 1994 (%) - Asian
Year householder moved into unit - Moved in 1990 to 1994 (%) - Hispanic or Latino
Year householder moved into unit - Moved in 1990 to 1994 (%) - American Indian and Alaska Native
Year householder moved into unit - Moved in 1990 to 1994 (%) - Multirace
Year householder moved into unit - Moved in 1990 to 1994 (%) - Other Race
Year householder moved into unit - Moved in 1980 to 1989 (%)
Year householder moved into unit - Moved in 1980 to 1989 (%) - White
Year householder moved into unit - Moved in 1980 to 1989 (%) - Black or African American
Year householder moved into unit - Moved in 1980 to 1989 (%) - Asian
Year householder moved into unit - Moved in 1980 to 1989 (%) - Hispanic or Latino
Year householder moved into unit - Moved in 1980 to 1989 (%) - American Indian and Alaska Native
Year householder moved into unit - Moved in 1980 to 1989 (%) - Multirace
Year householder moved into unit - Moved in 1980 to 1989 (%) - Other Race
Year householder moved into unit - Moved in 1970 to 1979 (%)
Year householder moved into unit - Moved in 1970 to 1979 (%) - White
Year householder moved into unit - Moved in 1970 to 1979 (%) - Black or African American
Year householder moved into unit - Moved in 1970 to 1979 (%) - Asian
Year householder moved into unit - Moved in 1970 to 1979 (%) - Hispanic or Latino
Year householder moved into unit - Moved in 1970 to 1979 (%) - American Indian and Alaska Native
Year householder moved into unit - Moved in 1970 to 1979 (%) - Multirace
Year householder moved into unit - Moved in 1970 to 1979 (%) - Other Race
Year householder moved into unit - Moved in 1969 or earlier (%)
Year householder moved into unit - Moved in 1969 or earlier (%) - White
Year householder moved into unit - Moved in 1969 or earlier (%) - Black or African American
Year householder moved into unit - Moved in 1969 or earlier (%) - Asian
Year householder moved into unit - Moved in 1969 or earlier (%) - Hispanic or Latino
Year householder moved into unit - Moved in 1969 or earlier (%) - American Indian and Alaska Native
Year householder moved into unit - Moved in 1969 or earlier (%) - Multirace
Year householder moved into unit - Moved in 1969 or earlier (%) - Other Race
Housing units lacking complete plumbing facilities (%)
Housing units lacking complete kitchen facilities (%)
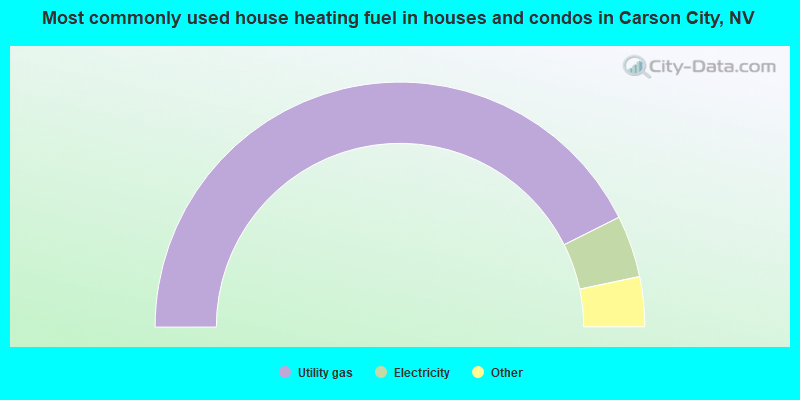
House heating fuel used in houses and condos - Utility gas (%)
House heating fuel used in houses and condos - Bottled, tank, or LP gas (%)
House heating fuel used in houses and condos - Electricity (%)
House heating fuel used in houses and condos - Fuel oil, kerosene, etc. (%)
House heating fuel used in houses and condos - Coal or coke (%)
House heating fuel used in houses and condos - Wood (%)
House heating fuel used in houses and condos - Solar energy (%)
House heating fuel used in houses and condos - Other fuel (%)
House heating fuel used in houses and condos - No fuel used (%)
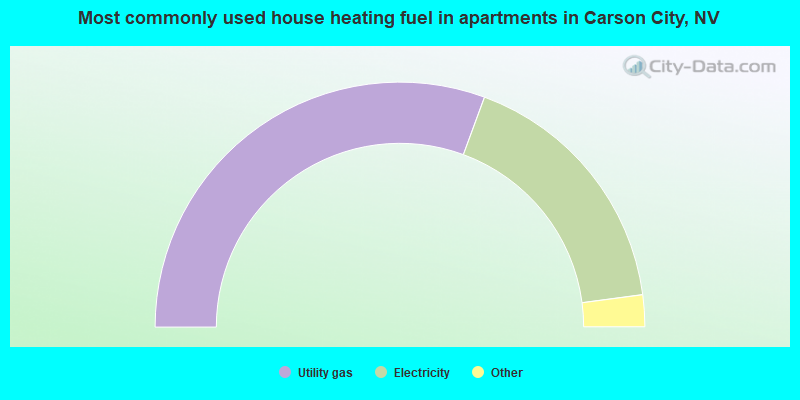
House heating fuel used in apartments - Utility gas (%)
House heating fuel used in apartments - Bottled, tank, or LP gas (%)
House heating fuel used in apartments - Electricity (%)
House heating fuel used in apartments - Fuel oil, kerosene, etc. (%)
House heating fuel used in apartments - Coal or coke (%)
House heating fuel used in apartments - Wood (%)
House heating fuel used in apartments - Solar energy (%)
House heating fuel used in apartments - Other fuel (%)
House heating fuel used in apartments - No fuel used (%)
Median year house/condo built: 1984Median year apartment built: 1979Household type by relationship:
Households: 59,617
Male householders: 11,489 (3,279 living alone ), Female householders: 12,413 (4,118 living alone )10,321 spouses (10,206 opposite-sex spouses ), 1,888 unmarried partners , (1,825 opposite-sex unmarried partners ), 15,218 children (14,281 natural , 151 adopted , 785 stepchildren ), 999 grandchildren , 724 brothers or sisters , 729 parents , 23 foster children , 1,141 other relatives , 1,999 non-relatives In group quarters: 2,666
Size of family households: 6,615 2-persons , 3,635 3-persons , 2,682 4-persons , 1,713 5-persons , 507 6-persons , 170 7-or-more-persons .
Size of nonfamily households: 7,336 1-person , 1,227 2-persons , 121 3-persons , 44 4-persons , 11 6-persons .
6,211 married couples with children. single-parent households (1,180 men , 2,689 women ).
78.2% of residents of Carson City speak English at home. of residents speak Spanish at home (69% speak English very well , 19% speak English well , 9% speak English not well , 3% don't speak English at all ).of residents speak other Indo-European language at home (69% speak English very well , 21% speak English well , 10% speak English not well ).of residents speak Asian or Pacific Island language at home (67% speak English very well , 29% speak English well , 3% speak English not well ).of residents speak other language at home (81% speak English very well , 8% speak English well , 11% speak English not well ).
Foreign born population: 7,719 (12.9%)of them are naturalized citizens )
Median number of rooms in houses and condos:
Median number of rooms in apartments
Owner-occupied Renter-occupied
Rooms in owner-occupied houses in Carson City, Nevada
68 1 room 25 2 rooms 698 3 rooms 1,420 4 rooms 3,496 5 rooms 3,483 6 rooms 2,469 7 rooms 1,314 8 rooms 1,907 9+ rooms
Rooms in renter-occupied apartments in Carson City, Nevada
890 1 room 532 2 rooms 1,841 3 rooms 2,170 4 rooms 1,828 5 rooms 1,170 6 rooms 447 7 rooms 73 8 rooms 219 9+ rooms
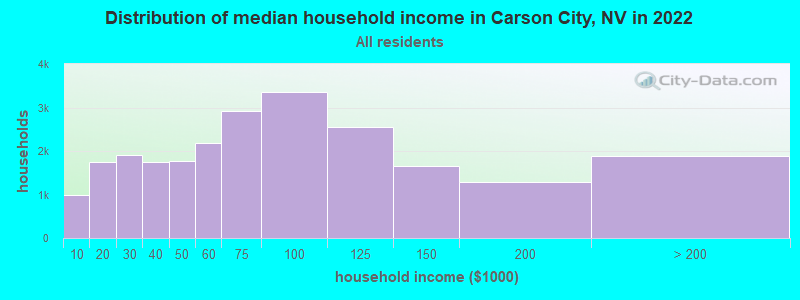
Carson City, NV household income distribution 978 Less than $10,0001,755 $10,000 to $19,9991,905 $20,000 to $29,9991,751 $30,000 to $39,9991,764 $40,000 to $49,9992,177 $50,000 to $59,9992,911 $60,000 to $74,9993,365 $75,000 to $99,9992,563 $100,000 to $124,9991,644 $125,000 to $149,9991,291 $150,000 to $199,9991,889 $200,000 or more
Home value of owner - occupied houses in 2022 in Carson City, NV 499 Less than $10,00046 $10,000 to $14,999152 $15,000 to $19,999140 $20,000 to $24,99991 $25,000 to $29,999196 $30,000 to $34,99916 $35,000 to $39,999174 $40,000 to $49,999158 $50,000 to $59,99990 $60,000 to $69,99955 $70,000 to $79,99995 $80,000 to $89,9996 $90,000 to $99,99974 $100,000 to $124,99932 $125,000 to $149,999151 $150,000 to $174,99985 $175,000 to $199,999594 $200,000 to $249,999633 $250,000 to $299,9993,188 $300,000 to $399,9993,671 $400,000 to $499,9994,441 $500,000 to $749,9991,138 $750,000 to $999,999350 $1,000,000 to $1,499,99952 $1,500,000 to $1,999,999106 $2,000,000 or moreRent paid by renters in 2022 in Carson City, NV 91 Less than $10014 $100 to $14971 $150 to $199215 $200 to $249115 $250 to $2999 $350 to $39972 $400 to $44933 $450 to $499100 $500 to $549154 $550 to $599126 $600 to $649233 $650 to $699423 $700 to $749326 $750 to $799586 $800 to $899856 $900 to $9991,943 $1,000 to $1,2491,052 $1,250 to $1,4991,176 $1,500 to $1,999283 $2,000 to $2,499108 $2,500 to $2,99913 $3,500 or more143 No cash rent
Percentage of workers working in this county: 66.7%Number of people working at home: 2,609 (9.3% of all workers )
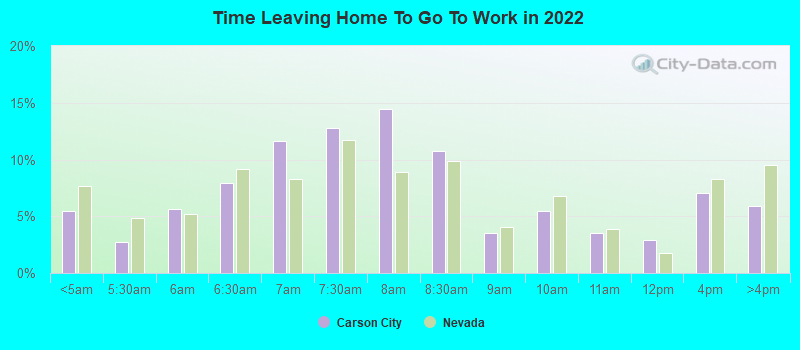
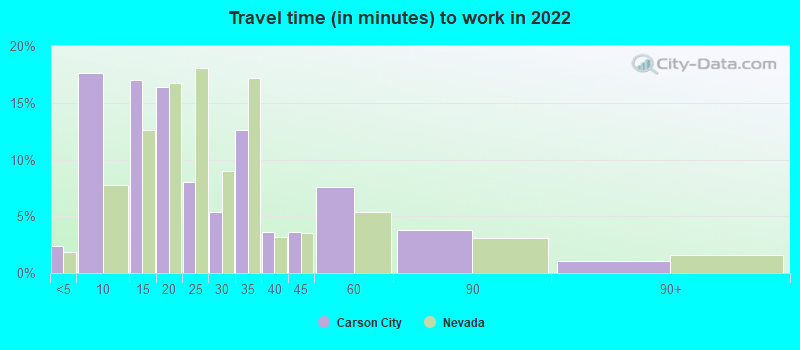
Travel time to work (commute)
Less than 5 minutes: 6135 to 9 minutes: 4,87710 to 14 minutes: 4,64115 to 19 minutes: 4,52620 to 24 minutes: 1,69225 to 29 minutes: 1,08530 to 34 minutes: 2,88035 to 39 minutes: 66340 to 44 minutes: 99745 to 59 minutes: 1,29760 to 89 minutes: 1,34690 or more minutes: 266
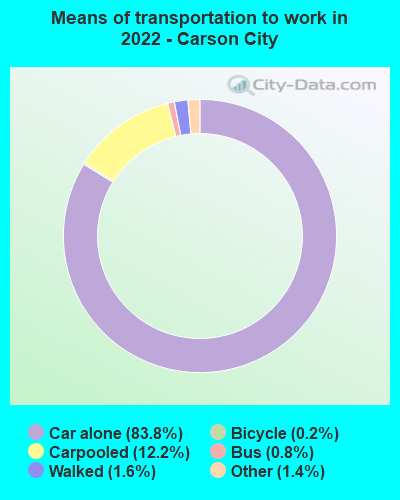
Means of transportation to work:
Drove a car alone: 24,467 (75.0%)Carpooled: 3,930 (12.0%)Bus : 222 (0.7%)Light rail, streetcar or trolley : 12 (0.0%)Taxi: 441 (1.4%)Bicycle: 70 (0.2%)Walked: 460 (1.4%)Worked at home: 2,609 (8.0%)
Unemployment by race in 2022
Unemployment rate for White non-Hispanic residents 3.8% Males1.9% FemalesUnemployment rate for Black residents 15.1% Males14.6% FemalesUnemployment rate for American Indian and Alaska Native residents 23.1% Males3.2% FemalesUnemployment rate for Asian residents 2.4% Males2.6% FemalesUnemployment rate for other race residents 3.7% Males4.5% FemalesUnemployment rate for two or more race residents 6.6% Males0.7% FemalesUnemployment rate for Hispanic or Latino residents 5.6% Males1.9% Females
Year of entry for the foreign-born population in Carson City, Nevada
1,225 2010 or later 2,457 2000 to 2009 1,702 1990 to 1999 1,635 1980 to 1989 474 1970 to 1979 828 Before 1970
First ancestries reported:
English: 3,100 (10.4%)
American: 2,620 (8.8%)
German: 1,950 (6.5%)
Irish: 1,493 (5.0%)
Italian: 821 (2.8%)
European: 561 (1.9%)
Polish: 533 (1.8%)
Scottish: 437 (1.5%)
African: 327 (1.1%)
French: 264 (0.9%)
Portuguese: 181 (0.6%)
Ukrainian: 176 (0.6%)
Swiss: 174 (0.6%)
Scotch-Irish: 170 (0.6%)
Norwegian: 166 (0.6%)
Swedish: 154 (0.5%)
French Canadian: 112 (0.4%)
Scandinavian: 93 (0.3%)
Basque: 92 (0.3%)
Hungarian: 89 (0.3%)
Eastern European: 89 (0.3%)
Danish: 87 (0.3%)
British: 79 (0.3%)
Dutch: 69 (0.2%)
Welsh: 58 (0.2%)
Croatian: 56 (0.2%)
Czechoslovakian: 39 (0.1%)
Brazilian: 38 (0.1%)
Arab: 31 (0.1%)
Greek: 30 (0.1%)
Austrian: 29 (0.10%)
Czech: 29 (0.10%)
Belgian: 29 (0.10%)
Northern European: 28 (0.09%)
Finnish: 28 (0.09%)
Lebanese: 26 (0.09%)
Yugoslavian: 18 (0.06%)
Sudanese: 15 (0.05%)
Russian: 12 (0.04%)
Romanian: 11 (0.04%)
Latvian: 9 (0.03%)
Canadian: 6 (0.02%)
New Zealander: 6 (0.02%)
Pennsylvania German: 6 (0.02%)
Slovak: 4 (0.01%) Most common places of birth for foreign-born residents (%): Mexico Carson City:
54.3% (4,194)Nevada:
36.8% (218,248)
El Salvador Carson City:
8.2% (633)Nevada:
4.0% (23,923)
Philippines Carson City:
7.7% (592)Nevada:
15.5% (91,628)
Senegal Carson City:
3.6% (277)Nevada:
0.1% (427)
Canada Carson City:
3.1% (241)Nevada:
1.9% (11,407)
England Carson City:
2.7% (211)Nevada:
0.7% (4,038)
Vietnam Carson City:
2.5% (192)Nevada:
2.0% (11,718)
Honduras Carson City:
1.7% (128)Nevada:
0.8% (4,679)
Nicaragua Carson City:
1.6% (125)Nevada:
0.7% (3,973)
Place of birth for U.S.-born residents:
This state: 19,316Other state: 31,741Northeast: 2,104Midwest: 4,520South: 2,858West: 22,391 87.5% of Carson City residents lived in the same house 1 years ago.
Out of people who lived in different houses, 26.2% lived in this county.
Out of people who lived in different counties, 58.7% lived in Nevada.
Carson City:
87.5%State average:
86.4%
Education attainment for males 25 years and older:
No schooling: 436Nursery to 4th grade: 1375th and 6th grade: 1347th and 8th grade: 1959th grade: 24410th grade: 37611th grade: 32712th grade, no diploma: 625High school graduate (or equivalency): 6,178Less than 1 year of college: 2,332Some college more than 1 year, no degree: 3,991Associate degree: 2,132Bachelor's degree: 3,568Master's degree: 1,199Professional school degree: 401Doctorate degree: 126
Education attainment for females 25 years and older:
No schooling: 388Nursery to 4th grade: 1225th and 6th grade: 897th and 8th grade: 2569th grade: 29910th grade: 29111th grade: 39312th grade, no diploma: 447High school graduate (or equivalency): 5,036Less than 1 year of college: 2,399Some college more than 1 year, no degree: 3,085Associate degree: 2,663Bachelor's degree: 3,665Master's degree: 1,230Professional school degree: 369Doctorate degree: 151
Housing units in structures:
One, detached: 14,872One, attached: 1,532Two: 3963 or 4: 1,3095 to 9: 1,49810 to 19: 92520 to 49: 1,52350 or more: 1,048Mobile homes: 2,281Boats, RVs, vans, etc.: 17Median worth of mobile homes: $38,337
Housing units lacking complete plumbing facilities in 2022: 1.4%Housing units lacking complete kitchen facilities in 2022: 2.4%House/condo owner moved in on average 12 years ago
Renter moved in on average 4 years ago
Private vs. public school enrollment:
Students in private schools in grades 1 to 8 (elementary and middle school): 379 Students in private schools in grades 9 to 12 (high school): 334 Students in private undergraduate colleges: 190