Centerville, UT (Utah) Houses and Residents
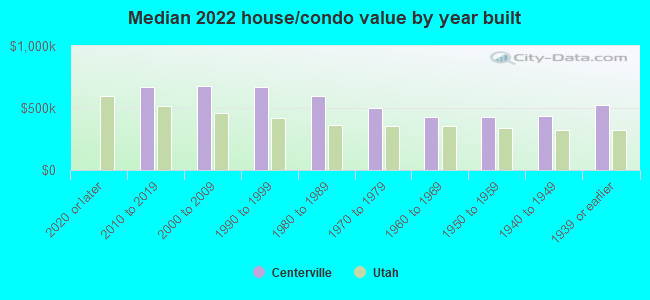
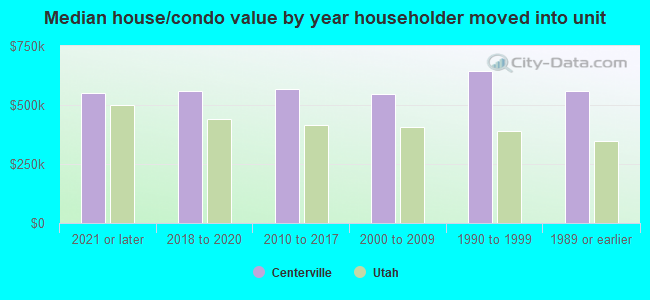
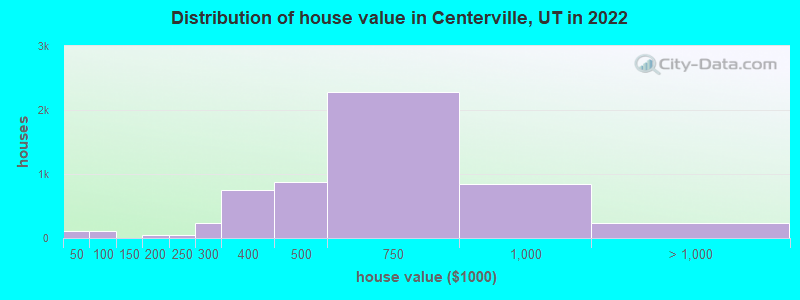
Estimated median house or condo value in 2022: $566,713 (it was $179,800 in 2000 )
Centerville:
$566,713Utah:
$499,500
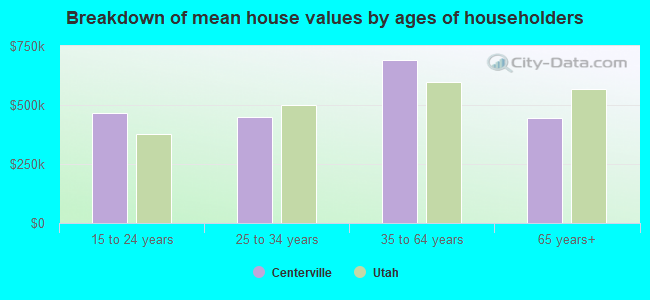
Lower value quartile - upper value quartile: $413,626 - $757,386Mean price in 2022: Detached houses: $573,112 Here:
$573,112State:
$607,750
Townhouses or other attached units: $384,369 Here:
$384,369State:
$444,505
In 3-to-4-unit structures: $430,483 Here:
$430,483State:
$362,850
In 5-or-more-unit structures: $216,232 Here:
$216,232State:
$412,810
Mobile homes: $60,929 Here:
$60,929State:
$113,475
Total population: 16,819 (Urban population: 14,278, Rural population: 93 (all nonfarm) )
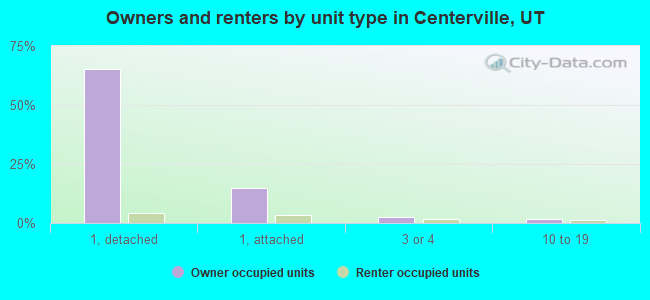
Houses: 6,107 (5,949 occupied: 5,112 owner occupied, 792 renter occupied )
% of renters here:
13%State:
29%
Housing density: 1,012 houses/condos per square mile
Median price asked for vacant for-sale houses and condos in 2022 in this county: $500,085.
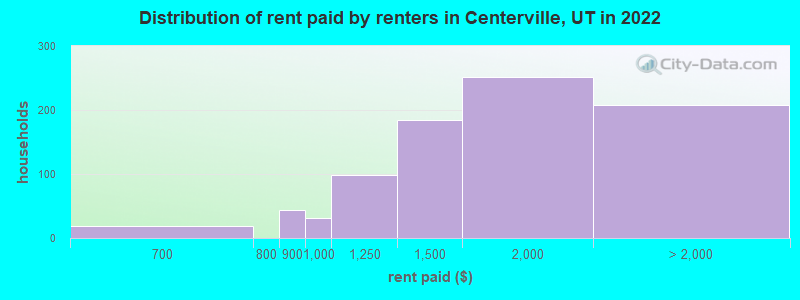
Median contract rent in 2022: $1,566 (lower quartile is $1,266, upper quartile is $1,908)
Median rent asked for vacant for-rent units in 2022: $5,757
Median gross rent in Centerville, UT in 2022: $1,637
Housing units in Centerville with a mortgage: 3,091 (375 second mortgage, 11 home equity loan, 340 both second mortgage and home equity loan )Houses without a mortgage: 78
Median household income for houses/condos with a mortgage: $127,536
Median household income for apartments without a mortgage: $108,844
Median monthly housing costs: $1,459
Data:
Median house or condo value ($)
Median house or condo value ($ change since 2000)
Median house or condo value ($) - White
Median house or condo value ($) - Black or African American
Median house or condo value ($) - Asian
Median house or condo value ($) - Hispanic or Latino
Median house or condo value ($) - American Indian and Alaska Native
Median house or condo value ($) - Multirace
Median house or condo value ($) - Other Race
Median price asked for mobile homes ($)
Household density (households per square mile)
Mean house or condo value by units in structure - 1, detached ($)
Mean house or condo value by units in structure - 1, attached ($)
Mean house or condo value by units in structure - 2 ($)
Mean house or condo value by units in structure by units in structure - 3 or 4 ($)
Mean house or condo value by units in structure - 5 or more ($)
Mean house or condo value by units in structure - Boat, RV, van, etc. ($)
Mean house or condo value by units in structure - Mobile home ($)
Median contract rent ($)
Median contract rent - Lower quartile ($)
Median contract rent - Upper quartile ($)
Median gross rent ($)
Urban houses (%)
Rural houses (%)
Houses occupied (%)
Houses occupied (% change since 2000)
Houses owner occupied (%)
Houses owner occupied (% change since 2000)
Houses renter occupied (%)
Houses renter occupied (% change since 2000)
Vacant housing units - For rent (%)
Vacant housing units - For rent (% change since 2000)
Vacant housing units - For sale only (%)
Vacant housing units - For sale only (% change since 2000)
Vacant housing units - Rented or sold, not occupied (%)
Vacant housing units - Rented or sold, not occupied (% change since 2000)
Vacant housing units - For seasonal, recreational, or occasional use (%)
Vacant housing units - For seasonal, recreational, or occasional use (% change since 2000)
Vacant housing units - For migrant workers (%)
Vacant housing units - For migrant workers (% change since 2000)
Vacant housing units - Other vacant (%)
Vacant housing units - Other vacant (% change since 2000)
Median monthly housing costs ($)
Median household income for houses/condos with a mortgage ($)
Median household income for houses/condos without a mortgage ($)
Median household income ($)
Median household income ($) - White
Median household income ($) - Black or African American
Median household income ($) - Asian
Median household income ($) - Hispanic or Latino
Median household income ($) - American Indian and Alaska Native
Median household income ($) - Multirace
Median household income ($) - Other Race
Mortgage status - with mortgage (%)
Mortgage status - with second mortgage (%)
Mortgage status - with home equity loan (%)
Mortgage status - with both second mortgage and home equity loan (%)
Mortgage status - without a mortgage (%)
Median year house/condo built
Median year apartment built
Household type by relationship - Male householder living alone (%)
Household type by relationship - Male householder not living alone (%)
Household type by relationship - Female householder living alone (%)
Household type by relationship - Female householder not living alone (%)
Household type by relationship - Opposite-Sex spouse (%)
Household type by relationship - Same-Sex spouse (%)
Household type by relationship - Opposite-Sex unmarried partner (%)
Household type by relationship - Same-Sex unmarried partner (%)
Household type by relationship - In group quarters (%)
Size of family households - 2-person household (%)
Size of family households - 3-person household (%)
Size of family households - 4-person household (%)
Size of family households - 5-person household (%)
Size of family households - 6-person household (%)
Size of family households - 7-or-more-person household (%)
Size of nonfamily households - 1-person household (%)
Size of nonfamily households - 2-person household (%)
Size of nonfamily households - 3-person household (%)
Size of nonfamily households - 4-person household (%)
Size of nonfamily households - 5-person household (%)
Size of nonfamily households - 6-person household (%)
Size of nonfamily households - 7-or-moreperson household (%)
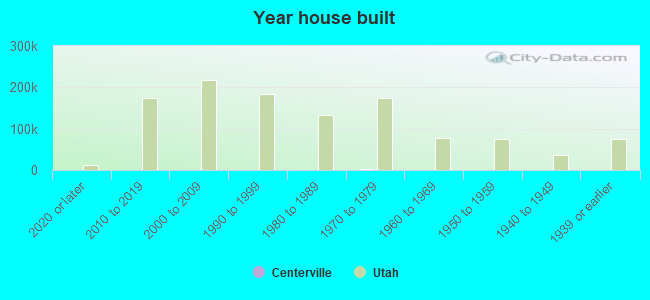
Year house built - Built 2010 or later (%)
Year house built - Built 2000 to 2009 (%)
Year house built - Built 1990 to 1999 (%)
Year house built - Built 1980 to 1989 (%)
Year house built - Built 1970 to 1979 (%)
Year house built - Built 1960 to 1969 (%)
Year house built - Built 1950 to 1959 (%)
Year house built - Built 1940 to 1949 (%)
Year house built - Built 1939 or earlier (%)
Median number of rooms in houses and condos
Median number of rooms in apartments
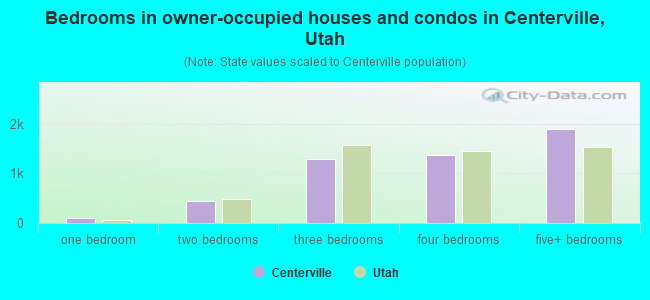
Median number of bedrooms in owner occupied houses
Mean number of bedrooms in owner occupied houses
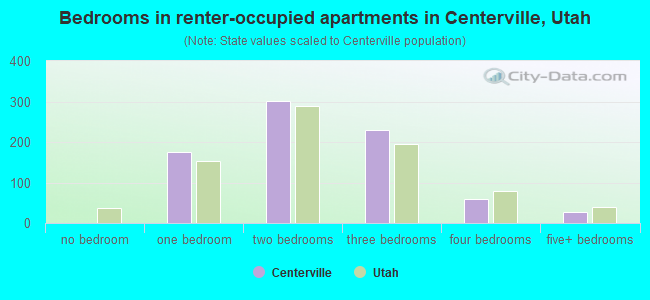
Median number of bedrooms in renter occupied houses
Mean number of bedrooms in renter occupied houses
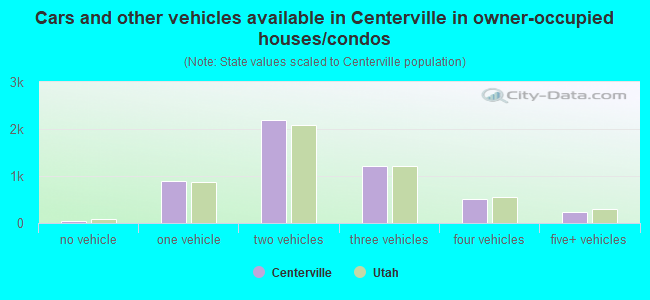
Median number of vehichles in owner occupied houses
Mean number of vehichles in owner occupied houses
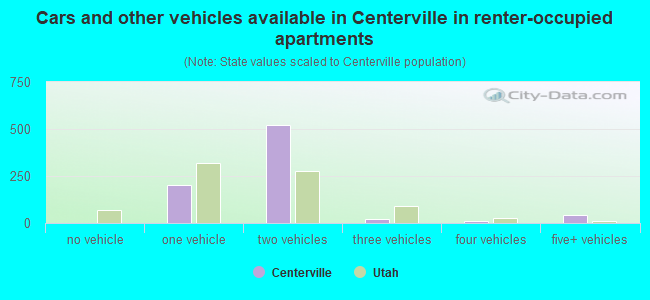
Median number of vehichles in renter occupied houses
Mean number of vehichles in renter occupied houses
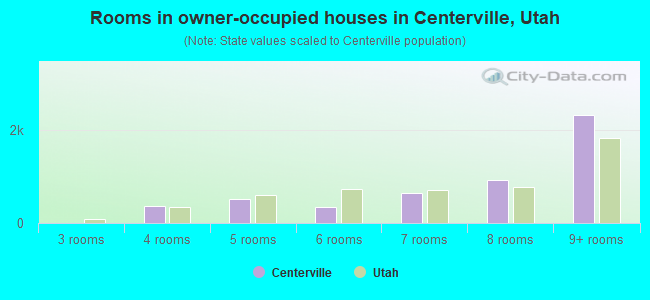
Rooms in owner-occupied houses - 1 room (%)
Rooms in owner-occupied houses - 2 rooms (%)
Rooms in owner-occupied houses - 3 rooms (%)
Rooms in owner-occupied houses - 4 rooms (%)
Rooms in owner-occupied houses - 5 rooms (%)
Rooms in owner-occupied houses - 6 rooms (%)
Rooms in owner-occupied houses - 7 rooms (%)
Rooms in owner-occupied houses - 8 rooms (%)
Rooms in owner-occupied houses - 9+ rooms (%)
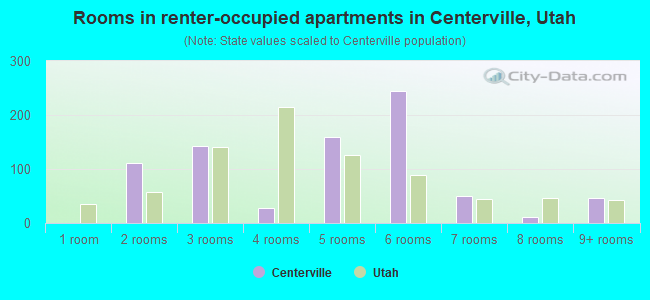
Rooms in renter-occupied houses - 1 room (%)
Rooms in renter-occupied houses - 2 rooms (%)
Rooms in renter-occupied houses - 3 rooms (%)
Rooms in renter-occupied houses - 4 rooms (%)
Rooms in renter-occupied houses - 5 rooms (%)
Rooms in renter-occupied houses - 6 rooms (%)
Rooms in renter-occupied houses - 7 rooms (%)
Rooms in renter-occupied houses - 8 rooms (%)
Rooms in renter-occupied houses - 9+ rooms (%)
Bedrooms in owner-occupied houses - no bedrooms (%)
Bedrooms in owner-occupied houses - 1 bedroom (%)
Bedrooms in owner-occupied houses - 2 bedrooms (%)
Bedrooms in owner-occupied houses - 3 bedrooms (%)
Bedrooms in owner-occupied houses - 4 bedrooms (%)
Bedrooms in owner-occupied houses - 5+ bedrooms (%)
Bedrooms in renter-occupied houses - no bedrooms (%)
Bedrooms in renter-occupied houses - 1 bedroom (%)
Bedrooms in renter-occupied houses - 2 bedrooms (%)
Bedrooms in renter-occupied houses - 3 bedrooms (%)
Bedrooms in renter-occupied houses - 4 bedrooms (%)
Bedrooms in renter-occupied houses - 5+ bedrooms (%)
Vehicles available in owner-occupied houses - no vehicle available (%)
Vehicles available in owner-occupied houses - 1 vehicle available(%)
Vehicles available in owner-occupied houses - 2 Vehicles available (%)
Vehicles available in owner-occupied houses - 3 Vehicles available (%)
Vehicles available in owner-occupied houses - 4 Vehicles available (%)
Vehicles available in owner-occupied houses - 5+ Vehicles available (%)
Vehicles available in renter-occupied houses - no vehicle available (%)
Vehicles available in renter-occupied houses - 1 vehicle available (%)
Vehicles available in renter-occupied houses - 2 Vehicles available (%)
Vehicles available in renter-occupied houses - 3 Vehicles available (%)
Vehicles available in renter-occupied houses - 4 Vehicles available (%)
Vehicles available in renter-occupied houses - 5+ Vehicles available (%)
Housing units in structures - 1, detached (%)
Housing units in structures - 1, attached (%)
Housing units in structures - 2 (%)
Housing units in structures - 3 or 4 (%)
Housing units in structures - 5 to 9 (%)
Housing units in structures - 10 to 19 (%)
Housing units in structures - 20 to 49 (%)
Housing units in structures - 50 or more (%)
Housing units in structures - Mobile home (%)
Housing units in structures - Boat, RV, van, etc. (%)
Housing units in structures - Owners - 1, detached (%)
Housing units in structures - Owners - 1, attached (%)
Housing units in structures - Owners - 2 (%)
Housing units in structures - Owners - 3 or 4 (%)
Housing units in structures - Owners - 5 to 9 (%)
Housing units in structures - Owners - 10 to 19 (%)
Housing units in structures - Owners - 20 to 49 (%)
Housing units in structures - Owners - 50 or more (%)
Housing units in structures - Owners - Mobile home (%)
Housing units in structures - Owners - Boat, RV, van, etc. (%)
Housing units in structures - Renters - 1, detached (%)
Housing units in structures - Renters - 1, attached (%)
Housing units in structures - Renters - 2 (%)
Housing units in structures - Renters - 3 or 4 (%)
Housing units in structures - Renters - 5 to 9 (%)
Housing units in structures - Renters - 10 to 19 (%)
Housing units in structures - Renters - 20 to 49 (%)
Housing units in structures - Renters - 50 or more (%)
Housing units in structures - Renters - Mobile home (%)
Housing units in structures - Renters - Boat, RV, van, etc. (%)
House/condo owner moved in on average (years ago)
Renter moved in on average (years ago)
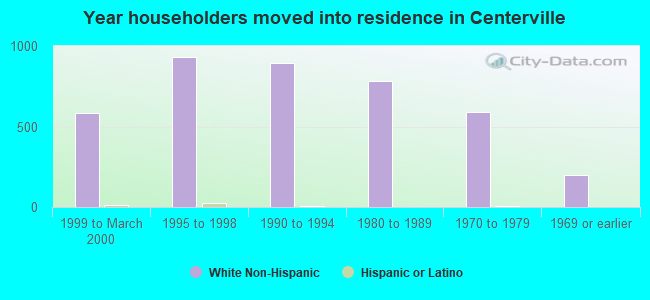
Year householder moved into unit - Moved in 1999 to March 2000 (%)
Year householder moved into unit - Moved in 1999 to March 2000 (%) - White
Year householder moved into unit - Moved in 1999 to March 2000 (%) - Black or African American
Year householder moved into unit - Moved in 1999 to March 2000 (%) - Asian
Year householder moved into unit - Moved in 1999 to March 2000 (%) - Hispanic or Latino
Year householder moved into unit - Moved in 1999 to March 2000 (%) - American Indian and Alaska Native
Year householder moved into unit - Moved in 1999 to March 2000 (%) - Multirace
Year householder moved into unit - Moved in 1999 to March 2000 (%) - Other Race
Year householder moved into unit - Moved in 1995 to 1998 (%)
Year householder moved into unit - Moved in 1995 to 1998 (%) - White
Year householder moved into unit - Moved in 1995 to 1998 (%) - Black or African American
Year householder moved into unit - Moved in 1995 to 1998 (%) - Asian
Year householder moved into unit - Moved in 1995 to 1998 (%) - Hispanic or Latino
Year householder moved into unit - Moved in 1995 to 1998 (%) - American Indian and Alaska Native
Year householder moved into unit - Moved in 1995 to 1998 (%) - Multirace
Year householder moved into unit - Moved in 1995 to 1998 (%) - Other Race
Year householder moved into unit - Moved in 1990 to 1994 (%)
Year householder moved into unit - Moved in 1990 to 1994 (%) - White
Year householder moved into unit - Moved in 1990 to 1994 (%) - Black or African American
Year householder moved into unit - Moved in 1990 to 1994 (%) - Asian
Year householder moved into unit - Moved in 1990 to 1994 (%) - Hispanic or Latino
Year householder moved into unit - Moved in 1990 to 1994 (%) - American Indian and Alaska Native
Year householder moved into unit - Moved in 1990 to 1994 (%) - Multirace
Year householder moved into unit - Moved in 1990 to 1994 (%) - Other Race
Year householder moved into unit - Moved in 1980 to 1989 (%)
Year householder moved into unit - Moved in 1980 to 1989 (%) - White
Year householder moved into unit - Moved in 1980 to 1989 (%) - Black or African American
Year householder moved into unit - Moved in 1980 to 1989 (%) - Asian
Year householder moved into unit - Moved in 1980 to 1989 (%) - Hispanic or Latino
Year householder moved into unit - Moved in 1980 to 1989 (%) - American Indian and Alaska Native
Year householder moved into unit - Moved in 1980 to 1989 (%) - Multirace
Year householder moved into unit - Moved in 1980 to 1989 (%) - Other Race
Year householder moved into unit - Moved in 1970 to 1979 (%)
Year householder moved into unit - Moved in 1970 to 1979 (%) - White
Year householder moved into unit - Moved in 1970 to 1979 (%) - Black or African American
Year householder moved into unit - Moved in 1970 to 1979 (%) - Asian
Year householder moved into unit - Moved in 1970 to 1979 (%) - Hispanic or Latino
Year householder moved into unit - Moved in 1970 to 1979 (%) - American Indian and Alaska Native
Year householder moved into unit - Moved in 1970 to 1979 (%) - Multirace
Year householder moved into unit - Moved in 1970 to 1979 (%) - Other Race
Year householder moved into unit - Moved in 1969 or earlier (%)
Year householder moved into unit - Moved in 1969 or earlier (%) - White
Year householder moved into unit - Moved in 1969 or earlier (%) - Black or African American
Year householder moved into unit - Moved in 1969 or earlier (%) - Asian
Year householder moved into unit - Moved in 1969 or earlier (%) - Hispanic or Latino
Year householder moved into unit - Moved in 1969 or earlier (%) - American Indian and Alaska Native
Year householder moved into unit - Moved in 1969 or earlier (%) - Multirace
Year householder moved into unit - Moved in 1969 or earlier (%) - Other Race
Housing units lacking complete plumbing facilities (%)
Housing units lacking complete kitchen facilities (%)
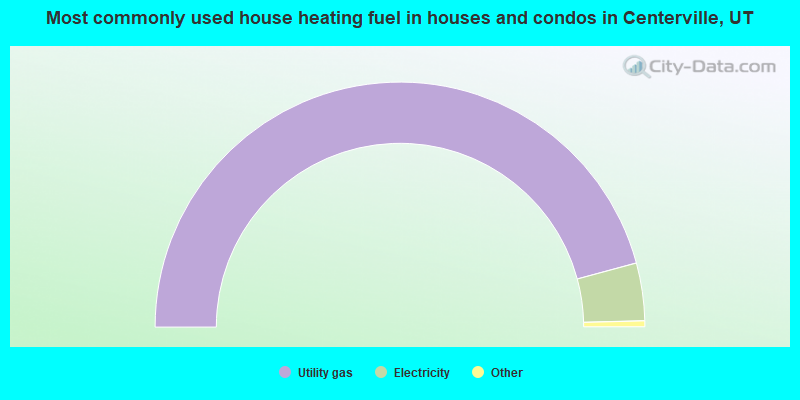
House heating fuel used in houses and condos - Utility gas (%)
House heating fuel used in houses and condos - Bottled, tank, or LP gas (%)
House heating fuel used in houses and condos - Electricity (%)
House heating fuel used in houses and condos - Fuel oil, kerosene, etc. (%)
House heating fuel used in houses and condos - Coal or coke (%)
House heating fuel used in houses and condos - Wood (%)
House heating fuel used in houses and condos - Solar energy (%)
House heating fuel used in houses and condos - Other fuel (%)
House heating fuel used in houses and condos - No fuel used (%)
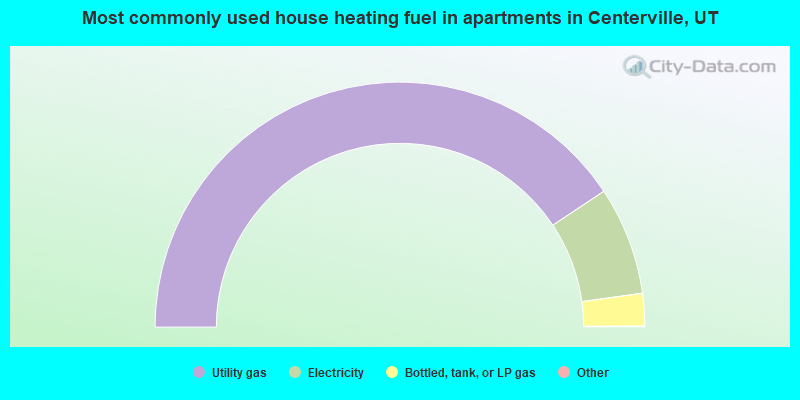
House heating fuel used in apartments - Utility gas (%)
House heating fuel used in apartments - Bottled, tank, or LP gas (%)
House heating fuel used in apartments - Electricity (%)
House heating fuel used in apartments - Fuel oil, kerosene, etc. (%)
House heating fuel used in apartments - Coal or coke (%)
House heating fuel used in apartments - Wood (%)
House heating fuel used in apartments - Solar energy (%)
House heating fuel used in apartments - Other fuel (%)
House heating fuel used in apartments - No fuel used (%)
Latest news about housing in Centerville, UT collected exclusively by city-data.com from local newspapers, TV, and radio stations
Median year house/condo built: 1984Median year apartment built: 2003Household type by relationship:
Households: 17,058
Male householders: 3,097 (351 living alone ), Female householders: 2,685 (687 living alone )4,048 spouses (4,048 opposite-sex spouses ), 55 unmarried partners , (55 opposite-sex unmarried partners ), 5,782 children (5,321 natural , 300 adopted , 159 stepchildren ), 364 grandchildren , 153 brothers or sisters , 264 parents , 20 foster children , 239 other relatives , 294 non-relatives In group quarters: 51
Size of family households: 2,064 2-persons , 990 3-persons , 703 4-persons , 470 5-persons , 225 6-persons , 305 7-or-more-persons .
Size of nonfamily households: 984 1-person , 165 2-persons , 10 4-persons .
3,876 married couples with children. single-parent households (71 men , 97 women ).
92.4% of residents of Centerville speak English at home. of residents speak Spanish at home (89% speak English very well , 8% speak English well , 3% speak English not well ).of residents speak other Indo-European language at home (88% speak English very well , 12% speak English not well ).of residents speak Asian or Pacific Island language at home (96% speak English very well , 2% speak English well , 2% speak English not well ).of residents speak other language at home (100% speak English very well ).
Foreign born population: 398 (2.3%)of them are naturalized citizens )
Median number of rooms in houses and condos:
Median number of rooms in apartments
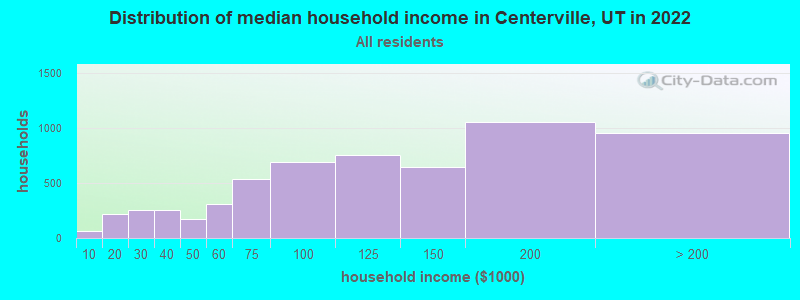
Centerville, UT household income distribution 61 Less than $10,000215 $10,000 to $19,999258 $20,000 to $29,999256 $30,000 to $39,999171 $40,000 to $49,999312 $50,000 to $59,999536 $60,000 to $74,999691 $75,000 to $99,999755 $100,000 to $124,999644 $125,000 to $149,9991,054 $150,000 to $199,999951 $200,000 or more
Home value of owner - occupied houses in 2022 in Centerville, UT 29 Less than $10,00047 $10,000 to $14,9998 $20,000 to $24,9993 $35,000 to $39,99928 $40,000 to $49,99921 $50,000 to $59,99926 $70,000 to $79,99931 $80,000 to $89,9995 $100,000 to $124,99915 $150,000 to $174,99928 $175,000 to $199,99953 $200,000 to $249,999230 $250,000 to $299,999754 $300,000 to $399,999880 $400,000 to $499,9992,274 $500,000 to $749,999845 $750,000 to $999,999189 $1,000,000 to $1,499,99935 $1,500,000 to $1,999,9998 $2,000,000 or moreRent paid by renters in 2022 in Centerville, UT 18 $650 to $69943 $800 to $89932 $900 to $99998 $1,000 to $1,249184 $1,250 to $1,499252 $1,500 to $1,99982 $2,000 to $2,4997 $3,000 to $3,499117 No cash rent
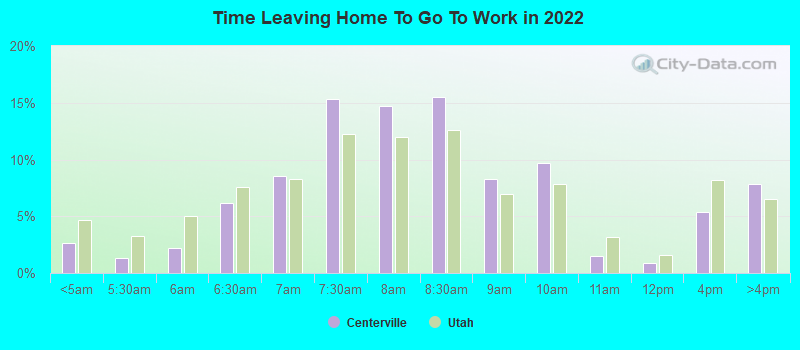
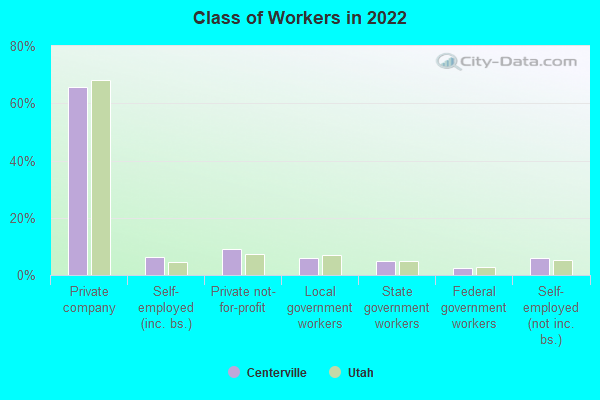
Percentage of workers working in this county: 59.4%Number of people working at home: 2,359 (27.6% of all workers )
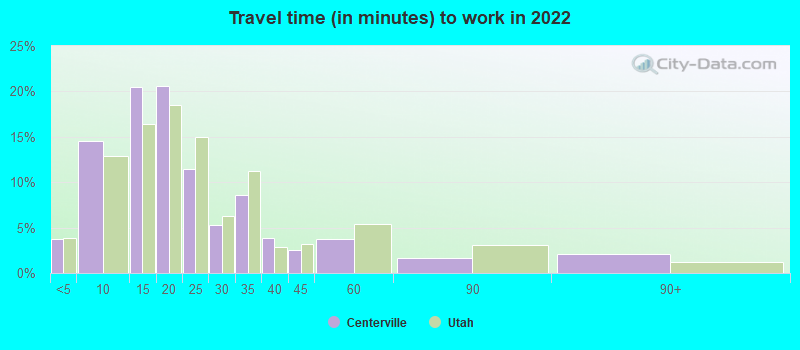
Travel time to work (commute)
Less than 5 minutes: 2065 to 9 minutes: 79310 to 14 minutes: 1,26715 to 19 minutes: 91520 to 24 minutes: 85125 to 29 minutes: 66730 to 34 minutes: 85535 to 39 minutes: 40640 to 44 minutes: 19745 to 59 minutes: 17160 to 89 minutes: 4790 or more minutes: 18
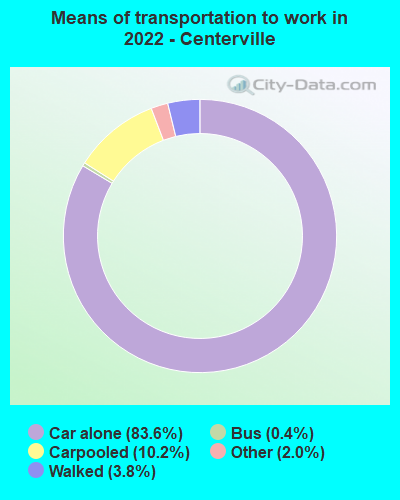
Means of transportation to work:
Drove a car alone: 4,672 (58.7%)Carpooled: 719 (9.0%)Bus : 48 (0.6%)Taxi: 153 (1.9%)Walked: 215 (2.7%)Worked at home: 2,359 (29.6%)
Unemployment by race in 2022
Unemployment rate for White non-Hispanic residents 0.8% Males2.0% FemalesUnemployment rate for two or more race residents 9.5% MalesUnemployment rate for Hispanic or Latino residents 3.1% Males
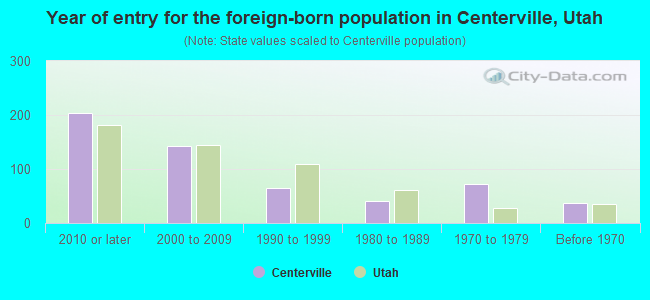
Year of entry for the foreign-born population in Centerville, Utah
203 2010 or later 143 2000 to 2009 64 1990 to 1999 40 1980 to 1989 73 1970 to 1979 37 Before 1970
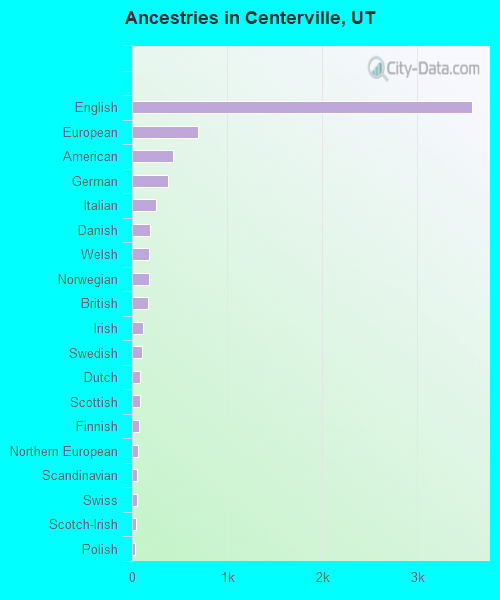
First ancestries reported:
English: 3,577 (43.9%)
European: 696 (8.5%)
American: 429 (5.3%)
German: 377 (4.6%)
Italian: 253 (3.1%)
Danish: 189 (2.3%)
Welsh: 178 (2.2%)
Norwegian: 175 (2.1%)
British: 171 (2.1%)
Irish: 112 (1.4%)
Swedish: 102 (1.3%)
Dutch: 86 (1.1%)
Scottish: 82 (1.0%)
Finnish: 78 (1.0%)
Northern European: 58 (0.7%)
Scandinavian: 52 (0.6%)
Swiss: 49 (0.6%)
Scotch-Irish: 42 (0.5%)
Polish: 33 (0.4%)
Pennsylvania German: 29 (0.4%)
Lebanese: 26 (0.3%)
Australian: 22 (0.3%)
Croatian: 14 (0.2%)
French: 14 (0.2%)
Czech: 10 (0.1%)
Ethiopian: 6 (0.07%)
African: 6 (0.07%) Most common places of birth for foreign-born residents (%): Mexico Centerville:
15.2% (78)Utah:
36.1% (99,740)
Brazil Centerville:
11.9% (61)Utah:
2.8% (7,644)
Guatemala Centerville:
10.3% (53)Utah:
2.1% (5,902)
Oceania, n.e.c. Centerville:
9.4% (48)Utah:
2.7% (7,472)
Peru Centerville:
8.8% (45)Utah:
2.9% (7,901)
England Centerville:
8.4% (43)Utah:
1.1% (2,900)
Philippines Centerville:
4.7% (24)Utah:
2.3% (6,468)
Australia Centerville:
4.3% (22)Utah:
0.5% (1,280)
Iran Centerville:
3.9% (20)Utah:
0.8% (2,137)
Bolivia Centerville:
3.9% (20)Utah:
0.4% (977)
Austria Centerville:
3.7% (19)Utah:
0.1% (217)
China, excluding Hong Kong and Taiwan Centerville:
3.7% (19)Utah:
2.9% (8,017)
Korea Centerville:
2.7% (14)Utah:
1.6% (4,524)
Canada Centerville:
2.3% (12)Utah:
3.0% (8,341)
Laos Centerville:
1.8% (9)Utah:
0.4% (1,228)
Argentina Centerville:
1.8% (9)Utah:
1.3% (3,570)
Place of birth for U.S.-born residents:
This state: 11,936Other state: 4,588Northeast: 234Midwest: 786South: 556West: 3,049 90.3% of Centerville residents lived in the same house 1 years ago.
Out of people who lived in different houses, 41.8% lived in this county.
Out of people who lived in different counties, 70.1% lived in Utah.
Centerville:
90.3%State average:
85.7%
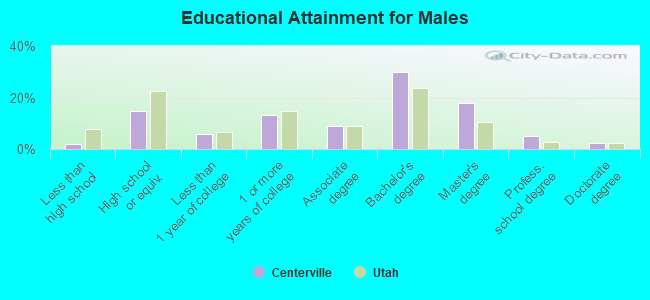
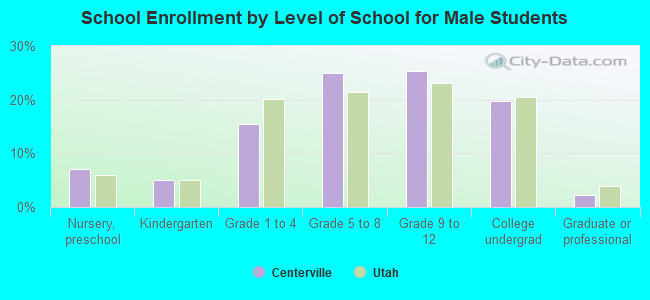
Education attainment for males 25 years and older:
No schooling: 13Nursery to 4th grade: 05th and 6th grade: 197th and 8th grade: 179th grade: 2010th grade: 011th grade: 3312th grade, no diploma: 11High school graduate (or equivalency): 820Less than 1 year of college: 321Some college more than 1 year, no degree: 750Associate degree: 505Bachelor's degree: 1,679Master's degree: 1,007Professional school degree: 287Doctorate degree: 142
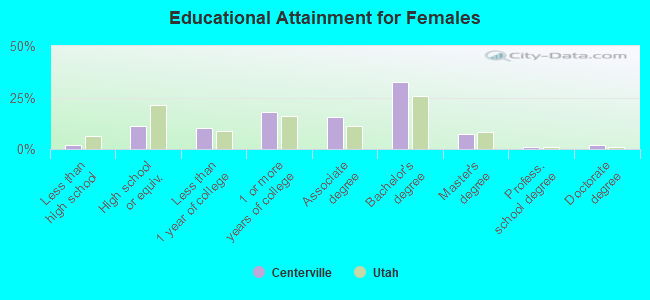
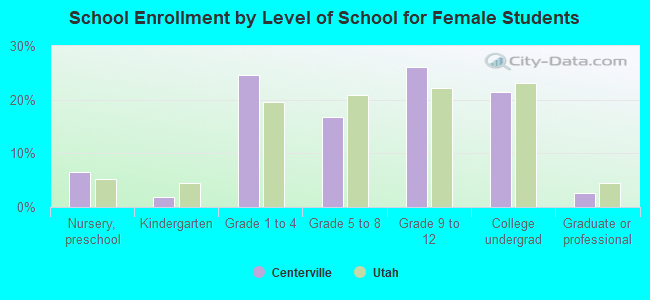
Education attainment for females 25 years and older:
No schooling: 19Nursery to 4th grade: 05th and 6th grade: 07th and 8th grade: 09th grade: 1010th grade: 311th grade: 1512th grade, no diploma: 68High school graduate (or equivalency): 680Less than 1 year of college: 630Some college more than 1 year, no degree: 1,126Associate degree: 967Bachelor's degree: 2,026Master's degree: 459Professional school degree: 56Doctorate degree: 132
Housing units in structures:
One, detached: 4,432One, attached: 628Two: 1243 or 4: 1155 to 9: 22910 to 19: 18720 to 49: 19950 or more: 114Mobile homes: 75Housing units lacking complete plumbing facilities in 2022: 0.5%Housing units lacking complete kitchen facilities in 2022: 0.5%House/condo owner moved in on average 14 years ago
Renter moved in on average 3 years ago
Private vs. public school enrollment:
Students in private schools in grades 1 to 8 (elementary and middle school): 127 Students in private schools in grades 9 to 12 (high school): 5 Students in private undergraduate colleges: 254