Cicero, IL (Illinois) Houses and Residents
Estimated median house or condo value in 2022: $243,900 (it was $120,200 in 2000 )
Cicero:
$243,900Illinois:
$251,600
Lower value quartile - upper value quartile: $169,800 - $289,800Mean price in 2022: Detached houses: $226,717 Here:
$226,717State:
$310,164
Townhouses or other attached units: $183,722 Here:
$183,722State:
$286,230
In 2-unit structures: $213,381 Here:
$213,381State:
$299,638
In 3-to-4-unit structures: $296,988 Here:
$296,988State:
$330,907
In 5-or-more-unit structures: $183,093 Here:
$183,093State:
$318,887
Mobile homes: $150,581 Here:
$150,581State:
$78,855
Total population: 84,354 (All urban)
Houses: 28,572 (27,136 occupied: 15,172 owner occupied, 11,964 renter occupied )
% of renters here:
44%State:
33%
Housing density: 4,887 houses/condos per square mile
Median price asked for vacant for-sale houses and condos in 2022: $241,826.
Median contract rent in 2022: $929 (lower quartile is $784, upper quartile is $1,105)
Median rent asked for vacant for-rent units in 2022: $1,016
Median gross rent in Cicero, IL in 2022: $1,000
Housing units in Cicero with a mortgage: 7,727 (364 second mortgage, 66 home equity loan, 208 both second mortgage and home equity loan )Houses without a mortgage: 129
Median household income for houses/condos with a mortgage: $90,248
Median household income for apartments without a mortgage: $71,140
Median monthly housing costs: $1,038
Data:
Median house or condo value ($)
Median house or condo value ($ change since 2000)
Median house or condo value ($) - White
Median house or condo value ($) - Black or African American
Median house or condo value ($) - Asian
Median house or condo value ($) - Hispanic or Latino
Median house or condo value ($) - American Indian and Alaska Native
Median house or condo value ($) - Multirace
Median house or condo value ($) - Other Race
Median price asked for mobile homes ($)
Household density (households per square mile)
Mean house or condo value by units in structure - 1, detached ($)
Mean house or condo value by units in structure - 1, attached ($)
Mean house or condo value by units in structure - 2 ($)
Mean house or condo value by units in structure by units in structure - 3 or 4 ($)
Mean house or condo value by units in structure - 5 or more ($)
Mean house or condo value by units in structure - Boat, RV, van, etc. ($)
Mean house or condo value by units in structure - Mobile home ($)
Median contract rent ($)
Median contract rent - Lower quartile ($)
Median contract rent - Upper quartile ($)
Median gross rent ($)
Urban houses (%)
Rural houses (%)
Houses occupied (%)
Houses occupied (% change since 2000)
Houses owner occupied (%)
Houses owner occupied (% change since 2000)
Houses renter occupied (%)
Houses renter occupied (% change since 2000)
Vacant housing units - For rent (%)
Vacant housing units - For rent (% change since 2000)
Vacant housing units - For sale only (%)
Vacant housing units - For sale only (% change since 2000)
Vacant housing units - Rented or sold, not occupied (%)
Vacant housing units - Rented or sold, not occupied (% change since 2000)
Vacant housing units - For seasonal, recreational, or occasional use (%)
Vacant housing units - For seasonal, recreational, or occasional use (% change since 2000)
Vacant housing units - For migrant workers (%)
Vacant housing units - For migrant workers (% change since 2000)
Vacant housing units - Other vacant (%)
Vacant housing units - Other vacant (% change since 2000)
Median monthly housing costs ($)
Median household income for houses/condos with a mortgage ($)
Median household income for houses/condos without a mortgage ($)
Median household income ($)
Median household income ($) - White
Median household income ($) - Black or African American
Median household income ($) - Asian
Median household income ($) - Hispanic or Latino
Median household income ($) - American Indian and Alaska Native
Median household income ($) - Multirace
Median household income ($) - Other Race
Mortgage status - with mortgage (%)
Mortgage status - with second mortgage (%)
Mortgage status - with home equity loan (%)
Mortgage status - with both second mortgage and home equity loan (%)
Mortgage status - without a mortgage (%)
Median year house/condo built
Median year apartment built
Household type by relationship - Male householder living alone (%)
Household type by relationship - Male householder not living alone (%)
Household type by relationship - Female householder living alone (%)
Household type by relationship - Female householder not living alone (%)
Household type by relationship - Opposite-Sex spouse (%)
Household type by relationship - Same-Sex spouse (%)
Household type by relationship - Opposite-Sex unmarried partner (%)
Household type by relationship - Same-Sex unmarried partner (%)
Household type by relationship - In group quarters (%)
Size of family households - 2-person household (%)
Size of family households - 3-person household (%)
Size of family households - 4-person household (%)
Size of family households - 5-person household (%)
Size of family households - 6-person household (%)
Size of family households - 7-or-more-person household (%)
Size of nonfamily households - 1-person household (%)
Size of nonfamily households - 2-person household (%)
Size of nonfamily households - 3-person household (%)
Size of nonfamily households - 4-person household (%)
Size of nonfamily households - 5-person household (%)
Size of nonfamily households - 6-person household (%)
Size of nonfamily households - 7-or-moreperson household (%)
Year house built - Built 2010 or later (%)
Year house built - Built 2000 to 2009 (%)
Year house built - Built 1990 to 1999 (%)
Year house built - Built 1980 to 1989 (%)
Year house built - Built 1970 to 1979 (%)
Year house built - Built 1960 to 1969 (%)
Year house built - Built 1950 to 1959 (%)
Year house built - Built 1940 to 1949 (%)
Year house built - Built 1939 or earlier (%)
Median number of rooms in houses and condos
Median number of rooms in apartments
Median number of bedrooms in owner occupied houses
Mean number of bedrooms in owner occupied houses
Median number of bedrooms in renter occupied houses
Mean number of bedrooms in renter occupied houses
Median number of vehichles in owner occupied houses
Mean number of vehichles in owner occupied houses
Median number of vehichles in renter occupied houses
Mean number of vehichles in renter occupied houses
Rooms in owner-occupied houses - 1 room (%)
Rooms in owner-occupied houses - 2 rooms (%)
Rooms in owner-occupied houses - 3 rooms (%)
Rooms in owner-occupied houses - 4 rooms (%)
Rooms in owner-occupied houses - 5 rooms (%)
Rooms in owner-occupied houses - 6 rooms (%)
Rooms in owner-occupied houses - 7 rooms (%)
Rooms in owner-occupied houses - 8 rooms (%)
Rooms in owner-occupied houses - 9+ rooms (%)
Rooms in renter-occupied houses - 1 room (%)
Rooms in renter-occupied houses - 2 rooms (%)
Rooms in renter-occupied houses - 3 rooms (%)
Rooms in renter-occupied houses - 4 rooms (%)
Rooms in renter-occupied houses - 5 rooms (%)
Rooms in renter-occupied houses - 6 rooms (%)
Rooms in renter-occupied houses - 7 rooms (%)
Rooms in renter-occupied houses - 8 rooms (%)
Rooms in renter-occupied houses - 9+ rooms (%)
Bedrooms in owner-occupied houses - no bedrooms (%)
Bedrooms in owner-occupied houses - 1 bedroom (%)
Bedrooms in owner-occupied houses - 2 bedrooms (%)
Bedrooms in owner-occupied houses - 3 bedrooms (%)
Bedrooms in owner-occupied houses - 4 bedrooms (%)
Bedrooms in owner-occupied houses - 5+ bedrooms (%)
Bedrooms in renter-occupied houses - no bedrooms (%)
Bedrooms in renter-occupied houses - 1 bedroom (%)
Bedrooms in renter-occupied houses - 2 bedrooms (%)
Bedrooms in renter-occupied houses - 3 bedrooms (%)
Bedrooms in renter-occupied houses - 4 bedrooms (%)
Bedrooms in renter-occupied houses - 5+ bedrooms (%)
Vehicles available in owner-occupied houses - no vehicle available (%)
Vehicles available in owner-occupied houses - 1 vehicle available(%)
Vehicles available in owner-occupied houses - 2 Vehicles available (%)
Vehicles available in owner-occupied houses - 3 Vehicles available (%)
Vehicles available in owner-occupied houses - 4 Vehicles available (%)
Vehicles available in owner-occupied houses - 5+ Vehicles available (%)
Vehicles available in renter-occupied houses - no vehicle available (%)
Vehicles available in renter-occupied houses - 1 vehicle available (%)
Vehicles available in renter-occupied houses - 2 Vehicles available (%)
Vehicles available in renter-occupied houses - 3 Vehicles available (%)
Vehicles available in renter-occupied houses - 4 Vehicles available (%)
Vehicles available in renter-occupied houses - 5+ Vehicles available (%)
Housing units in structures - 1, detached (%)
Housing units in structures - 1, attached (%)
Housing units in structures - 2 (%)
Housing units in structures - 3 or 4 (%)
Housing units in structures - 5 to 9 (%)
Housing units in structures - 10 to 19 (%)
Housing units in structures - 20 to 49 (%)
Housing units in structures - 50 or more (%)
Housing units in structures - Mobile home (%)
Housing units in structures - Boat, RV, van, etc. (%)
Housing units in structures - Owners - 1, detached (%)
Housing units in structures - Owners - 1, attached (%)
Housing units in structures - Owners - 2 (%)
Housing units in structures - Owners - 3 or 4 (%)
Housing units in structures - Owners - 5 to 9 (%)
Housing units in structures - Owners - 10 to 19 (%)
Housing units in structures - Owners - 20 to 49 (%)
Housing units in structures - Owners - 50 or more (%)
Housing units in structures - Owners - Mobile home (%)
Housing units in structures - Owners - Boat, RV, van, etc. (%)
Housing units in structures - Renters - 1, detached (%)
Housing units in structures - Renters - 1, attached (%)
Housing units in structures - Renters - 2 (%)
Housing units in structures - Renters - 3 or 4 (%)
Housing units in structures - Renters - 5 to 9 (%)
Housing units in structures - Renters - 10 to 19 (%)
Housing units in structures - Renters - 20 to 49 (%)
Housing units in structures - Renters - 50 or more (%)
Housing units in structures - Renters - Mobile home (%)
Housing units in structures - Renters - Boat, RV, van, etc. (%)
House/condo owner moved in on average (years ago)
Renter moved in on average (years ago)
Year householder moved into unit - Moved in 1999 to March 2000 (%)
Year householder moved into unit - Moved in 1999 to March 2000 (%) - White
Year householder moved into unit - Moved in 1999 to March 2000 (%) - Black or African American
Year householder moved into unit - Moved in 1999 to March 2000 (%) - Asian
Year householder moved into unit - Moved in 1999 to March 2000 (%) - Hispanic or Latino
Year householder moved into unit - Moved in 1999 to March 2000 (%) - American Indian and Alaska Native
Year householder moved into unit - Moved in 1999 to March 2000 (%) - Multirace
Year householder moved into unit - Moved in 1999 to March 2000 (%) - Other Race
Year householder moved into unit - Moved in 1995 to 1998 (%)
Year householder moved into unit - Moved in 1995 to 1998 (%) - White
Year householder moved into unit - Moved in 1995 to 1998 (%) - Black or African American
Year householder moved into unit - Moved in 1995 to 1998 (%) - Asian
Year householder moved into unit - Moved in 1995 to 1998 (%) - Hispanic or Latino
Year householder moved into unit - Moved in 1995 to 1998 (%) - American Indian and Alaska Native
Year householder moved into unit - Moved in 1995 to 1998 (%) - Multirace
Year householder moved into unit - Moved in 1995 to 1998 (%) - Other Race
Year householder moved into unit - Moved in 1990 to 1994 (%)
Year householder moved into unit - Moved in 1990 to 1994 (%) - White
Year householder moved into unit - Moved in 1990 to 1994 (%) - Black or African American
Year householder moved into unit - Moved in 1990 to 1994 (%) - Asian
Year householder moved into unit - Moved in 1990 to 1994 (%) - Hispanic or Latino
Year householder moved into unit - Moved in 1990 to 1994 (%) - American Indian and Alaska Native
Year householder moved into unit - Moved in 1990 to 1994 (%) - Multirace
Year householder moved into unit - Moved in 1990 to 1994 (%) - Other Race
Year householder moved into unit - Moved in 1980 to 1989 (%)
Year householder moved into unit - Moved in 1980 to 1989 (%) - White
Year householder moved into unit - Moved in 1980 to 1989 (%) - Black or African American
Year householder moved into unit - Moved in 1980 to 1989 (%) - Asian
Year householder moved into unit - Moved in 1980 to 1989 (%) - Hispanic or Latino
Year householder moved into unit - Moved in 1980 to 1989 (%) - American Indian and Alaska Native
Year householder moved into unit - Moved in 1980 to 1989 (%) - Multirace
Year householder moved into unit - Moved in 1980 to 1989 (%) - Other Race
Year householder moved into unit - Moved in 1970 to 1979 (%)
Year householder moved into unit - Moved in 1970 to 1979 (%) - White
Year householder moved into unit - Moved in 1970 to 1979 (%) - Black or African American
Year householder moved into unit - Moved in 1970 to 1979 (%) - Asian
Year householder moved into unit - Moved in 1970 to 1979 (%) - Hispanic or Latino
Year householder moved into unit - Moved in 1970 to 1979 (%) - American Indian and Alaska Native
Year householder moved into unit - Moved in 1970 to 1979 (%) - Multirace
Year householder moved into unit - Moved in 1970 to 1979 (%) - Other Race
Year householder moved into unit - Moved in 1969 or earlier (%)
Year householder moved into unit - Moved in 1969 or earlier (%) - White
Year householder moved into unit - Moved in 1969 or earlier (%) - Black or African American
Year householder moved into unit - Moved in 1969 or earlier (%) - Asian
Year householder moved into unit - Moved in 1969 or earlier (%) - Hispanic or Latino
Year householder moved into unit - Moved in 1969 or earlier (%) - American Indian and Alaska Native
Year householder moved into unit - Moved in 1969 or earlier (%) - Multirace
Year householder moved into unit - Moved in 1969 or earlier (%) - Other Race
Housing units lacking complete plumbing facilities (%)
Housing units lacking complete kitchen facilities (%)
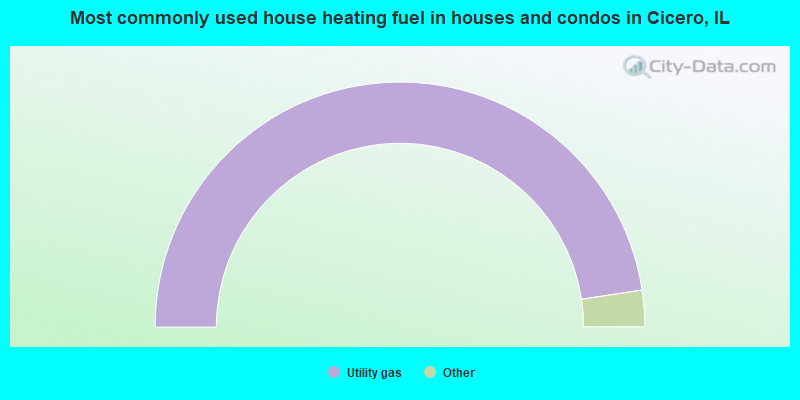
House heating fuel used in houses and condos - Utility gas (%)
House heating fuel used in houses and condos - Bottled, tank, or LP gas (%)
House heating fuel used in houses and condos - Electricity (%)
House heating fuel used in houses and condos - Fuel oil, kerosene, etc. (%)
House heating fuel used in houses and condos - Coal or coke (%)
House heating fuel used in houses and condos - Wood (%)
House heating fuel used in houses and condos - Solar energy (%)
House heating fuel used in houses and condos - Other fuel (%)
House heating fuel used in houses and condos - No fuel used (%)
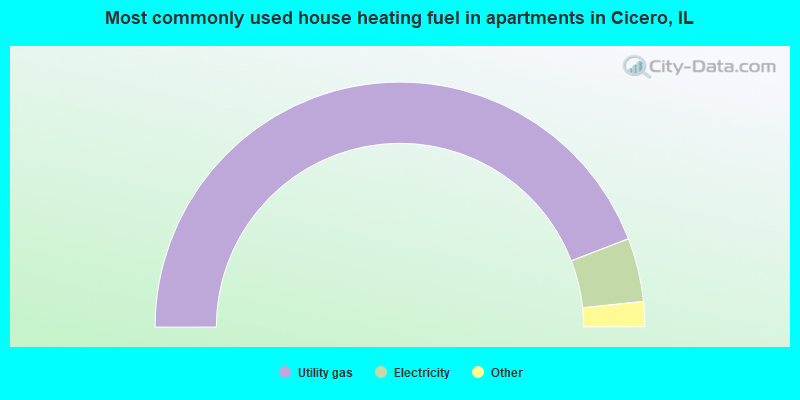
House heating fuel used in apartments - Utility gas (%)
House heating fuel used in apartments - Bottled, tank, or LP gas (%)
House heating fuel used in apartments - Electricity (%)
House heating fuel used in apartments - Fuel oil, kerosene, etc. (%)
House heating fuel used in apartments - Coal or coke (%)
House heating fuel used in apartments - Wood (%)
House heating fuel used in apartments - Solar energy (%)
House heating fuel used in apartments - Other fuel (%)
House heating fuel used in apartments - No fuel used (%)
Latest news about housing in Cicero, IL collected exclusively by city-data.com from local newspapers, TV, and radio stations
Median year house/condo built: 1938Median year apartment built: 1938Household type by relationship:
Households: 81,916
Male householders: 16,306 (3,583 living alone ), Female householders: 10,830 (2,324 living alone )11,787 spouses (11,787 opposite-sex spouses ), 2,850 unmarried partners , (2,850 opposite-sex unmarried partners ), 26,263 children (26,035 natural , 63 adopted , 165 stepchildren ), 4,241 grandchildren , 716 brothers or sisters , 1,978 parents , 0 foster children , 1,706 other relatives , 4,486 non-relatives In group quarters: 753
Size of family households: 4,605 2-persons , 4,521 3-persons , 6,153 4-persons , 2,345 5-persons , 1,366 6-persons , 817 7-or-more-persons .
Size of nonfamily households: 5,907 1-person , 1,155 2-persons , 149 3-persons , 118 6-persons .
8,579 married couples with children. single-parent households (3,153 men , 2,685 women ).
18.4% of residents of Cicero speak English at home. of residents speak Spanish at home (59% speak English very well , 21% speak English well , 15% speak English not well , 4% don't speak English at all ).of residents speak other Indo-European language at home (77% speak English very well , 10% speak English well , 13% speak English not well ).of residents speak Asian or Pacific Island language at home (80% speak English very well , 5% speak English well , 15% speak English not well ).of residents speak other language at home (100% speak English very well ).
Foreign born population: 31,169 (38.0%)of them are naturalized citizens )
Median number of rooms in houses and condos:
Median number of rooms in apartments
Owner-occupied Renter-occupied
Rooms in owner-occupied houses in Cicero, Illinois
232 1 room 0 2 rooms 212 3 rooms 1,813 4 rooms 3,615 5 rooms 5,711 6 rooms 1,855 7 rooms 1,081 8 rooms 653 9+ rooms
Rooms in renter-occupied apartments in Cicero, Illinois
881 1 room 433 2 rooms 2,260 3 rooms 2,029 4 rooms 4,249 5 rooms 1,611 6 rooms 74 7 rooms 427 8 rooms 0 9+ rooms
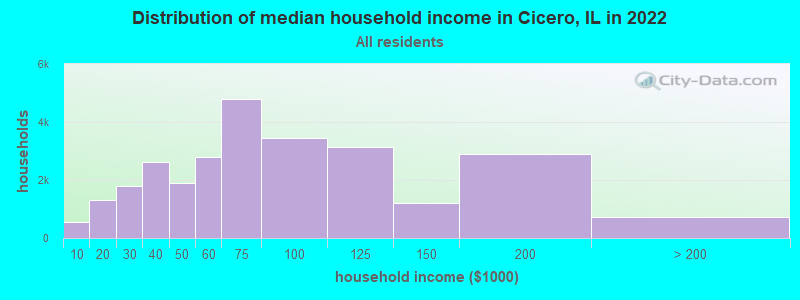
Cicero, IL household income distribution 547 Less than $10,0001,302 $10,000 to $19,9991,809 $20,000 to $29,9992,612 $30,000 to $39,9991,880 $40,000 to $49,9992,785 $50,000 to $59,9994,785 $60,000 to $74,9993,455 $75,000 to $99,9993,130 $100,000 to $124,9991,199 $125,000 to $149,9992,891 $150,000 to $199,999741 $200,000 or more
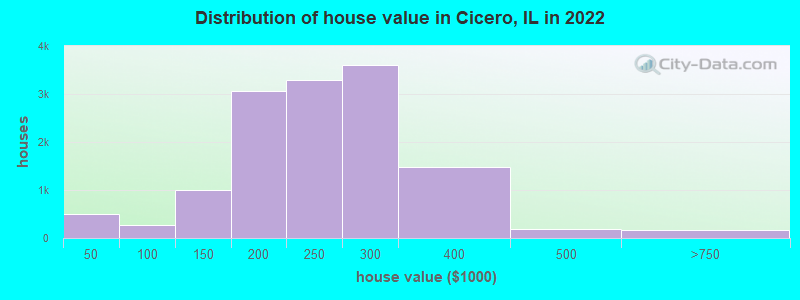
Home value of owner - occupied houses in 2022 in Cicero, IL 343 Less than $10,0007 $10,000 to $14,99925 $15,000 to $19,99955 $20,000 to $24,99913 $25,000 to $29,99923 $30,000 to $34,99914 $35,000 to $39,99914 $40,000 to $49,99919 $50,000 to $59,99924 $60,000 to $69,99973 $70,000 to $79,99996 $80,000 to $89,99935 $90,000 to $99,999482 $100,000 to $124,999525 $125,000 to $149,9991,737 $150,000 to $174,9991,334 $175,000 to $199,9993,286 $200,000 to $249,9993,594 $250,000 to $299,9991,484 $300,000 to $399,999189 $400,000 to $499,999103 $500,000 to $749,99930 $750,000 to $999,9998 $1,000,000 to $1,499,99917 $2,000,000 or moreRent paid by renters in 2022 in Cicero, IL 34 Less than $100186 $150 to $199263 $200 to $24931 $300 to $34913 $350 to $3996 $400 to $44952 $450 to $49935 $500 to $549100 $550 to $599440 $600 to $649242 $650 to $699655 $700 to $749733 $750 to $7992,023 $800 to $8991,691 $900 to $9993,140 $1,000 to $1,2491,016 $1,250 to $1,499456 $1,500 to $1,999116 $2,000 to $2,499410 No cash rent
Percentage of workers working in this county: 90.8%Number of people working at home: 2,047 (5.2% of all workers )
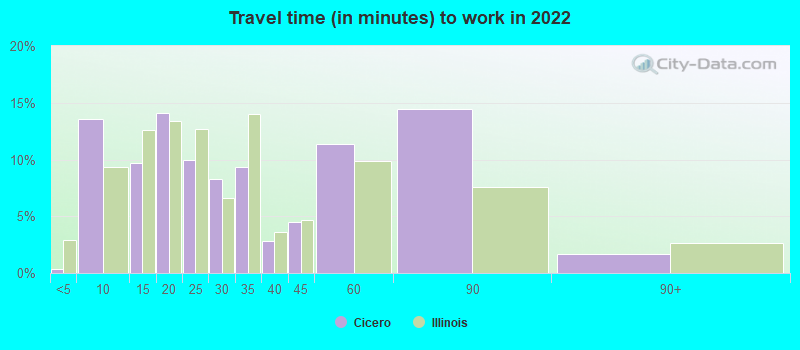
Travel time to work (commute)
Less than 5 minutes: 05 to 9 minutes: 3,50310 to 14 minutes: 3,76515 to 19 minutes: 3,37420 to 24 minutes: 7,38025 to 29 minutes: 3,02030 to 34 minutes: 7,28435 to 39 minutes: 75840 to 44 minutes: 2,43645 to 59 minutes: 2,59560 to 89 minutes: 2,92990 or more minutes: 196
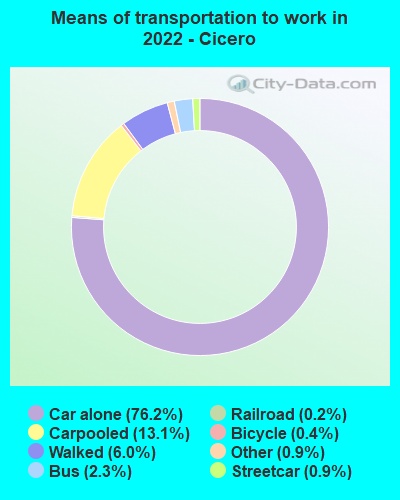
Means of transportation to work:
Drove a car alone: 12,678 (67.8%)Carpooled: 2,330 (12.5%)Bus : 354 (1.9%)Subway or elevated rail : 120 (0.6%)Light rail, streetcar or trolley : 25 (0.1%)Taxi: 144 (0.8%)Bicycle: 64 (0.3%)Walked: 1,035 (5.5%)Worked at home: 2,047 (11.0%)
Unemployment by race in 2022
Unemployment rate for White non-Hispanic residents 2.1% Males3.6% FemalesUnemployment rate for Black residents 10.6% Males7.6% FemalesUnemployment rate for American Indian and Alaska Native residents 11.8% Males1.7% FemalesUnemployment rate for other race residents 2.2% Males3.1% FemalesUnemployment rate for two or more race residents 2.8% Males4.1% FemalesUnemployment rate for Hispanic or Latino residents 6.3% Males6.2% Females
Year of entry for the foreign-born population in Cicero, Illinois
3,395 2010 or later 6,116 2000 to 2009 9,590 1990 to 1999 11,141 1980 to 1989 7,580 1970 to 1979 2,694 Before 1970
First ancestries reported:
Polish: 625 (1.0%)
American: 458 (0.7%)
Irish: 420 (0.7%)
Czech: 252 (0.4%)
German: 214 (0.3%)
Italian: 159 (0.3%)
Arab: 73 (0.1%)
French: 70 (0.1%)
Lithuanian: 69 (0.1%)
Croatian: 53 (0.08%)
Slovene: 47 (0.07%)
Ukrainian: 39 (0.06%)
Jamaican: 38 (0.06%)
Ugandan: 36 (0.06%)
Palestinian: 33 (0.05%)
Scottish: 33 (0.05%)
European: 32 (0.05%)
Serbian: 28 (0.04%)
English: 27 (0.04%)
Romanian: 25 (0.04%)
Scotch-Irish: 18 (0.03%)
Eastern European: 14 (0.02%)
African: 13 (0.02%)
Armenian: 11 (0.02%)
Greek: 11 (0.02%)
Swedish: 9 (0.01%)
Czechoslovakian: 7 (0.01%)
Russian: 7 (0.01%) Most common places of birth for foreign-born residents (%): Mexico Cicero:
90.1% (29,176)Illinois:
34.7% (626,958)
Guatemala Cicero:
2.3% (757)Illinois:
1.3% (22,793)
Colombia Cicero:
1.5% (501)Illinois:
0.9% (16,553)
Place of birth for U.S.-born residents:
This state: 44,358Other state: 5,099Northeast: 554Midwest: 738South: 2,286West: 1,521 94.7% of Cicero residents lived in the same house 1 years ago.
Out of people who lived in different houses, 48.0% lived in this county.
Out of people who lived in different counties, 49.1% lived in Illinois.
Cicero:
94.7%State average:
88.3%
Education attainment for males 25 years and older:
No schooling: 1,447Nursery to 4th grade: 7685th and 6th grade: 3,0267th and 8th grade: 5999th grade: 52410th grade: 7711th grade: 60212th grade, no diploma: 781High school graduate (or equivalency): 9,717Less than 1 year of college: 861Some college more than 1 year, no degree: 1,981Associate degree: 1,990Bachelor's degree: 2,704Master's degree: 514Professional school degree: 0Doctorate degree: 0
Education attainment for females 25 years and older:
No schooling: 1,588Nursery to 4th grade: 8195th and 6th grade: 1,6907th and 8th grade: 7179th grade: 1,24610th grade: 29711th grade: 67612th grade, no diploma: 551High school graduate (or equivalency): 9,893Less than 1 year of college: 1,213Some college more than 1 year, no degree: 1,554Associate degree: 1,775Bachelor's degree: 3,254Master's degree: 1,327Professional school degree: 60Doctorate degree: 0
Housing units in structures:
One, detached: 12,664One, attached: 694Two: 7,6013 or 4: 3,4865 to 9: 2,07610 to 19: 1,93220 to 49: 119Housing units lacking complete plumbing facilities in 2022: 2.0%Housing units lacking complete kitchen facilities in 2022: 2.4%House/condo owner moved in on average 15 years ago
Renter moved in on average 3 years ago
Private vs. public school enrollment:
Students in private schools in grades 1 to 8 (elementary and middle school): 831 Students in private schools in grades 9 to 12 (high school): 584 Students in private undergraduate colleges: 1,497