Covington, LA (Louisiana) Houses and Residents
| Covington: | $299,163 |
| Louisiana: | $209,200 |
Mean price in 2022:
Detached houses: $321,922
Here: $321,922 State: $273,555 Townhouses or other attached units: $303,514
Here: $303,514 State: $297,713 Mobile homes: $34,203
Here: $34,203 State: $89,857
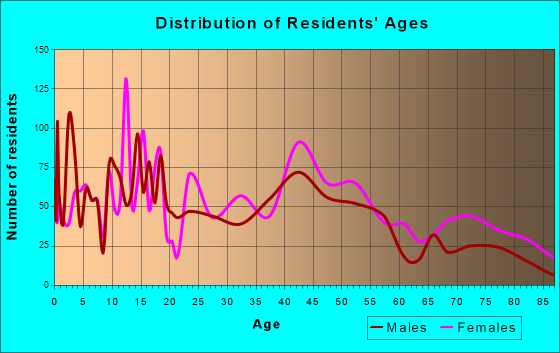
Total population: 9,686 (Urban population: 7,969, Rural population: 371 (all nonfarm))
Houses: 4,879 (4,381 occupied: 2,855 owner occupied, 1,590 renter occupied)
| % of renters here: | 36% |
| State: | 32% |
Housing density: 718 houses/condos per square mile
Median price asked for vacant for-sale houses and condos in 2022: $245,791.
Median contract rent in 2022: $1,050 (lower quartile is $795, upper quartile is $1,384)
Median rent asked for vacant for-rent units in 2022: $1,520
Median gross rent in Covington, LA in 2022: $1,318
Housing units in Covington with a mortgage: 1,573 (37 second mortgage, 19 home equity loan, 11 both second mortgage and home equity loan)
Houses without a mortgage: 11
Median household income for houses/condos with a mortgage: $118,607
Median household income for apartments without a mortgage: $62,585
Median monthly housing costs: $1,187
Compare current foreclosures in Covington, LA:
| Photo | Address | Area | Beds / Baths | Price | Details |
|---|---|---|---|---|---|

|
#1
Joyce Dr
Covington, LA 70435
|
- sq. feet
|
- baths - beds |
$5,366
|
show details |

|
#2
Pansy St
Covington, LA 70435
|
- sq. feet
|
- baths - beds |
$6,001
|
show details |

|
#3
St
Covington, LA 70435
|
- sq. feet
|
- baths - beds |
$6,001
|
show details |

|
#4
Rd
Covington, LA 70433
|
- sq. feet
|
- baths - beds |
$6,001
|
show details |

|
#5
Jasmine St
Covington, LA 70435
|
- sq. feet
|
- baths - beds |
$6,001
|
show details |

|
#6
Ave
Covington, LA 70433
|
- sq. feet
|
- baths - beds |
$6,001
|
show details |

|
#7
Spruce Dr
Covington, LA 70433
|
- sq. feet
|
- baths - beds |
$6,001
|
show details |

|
#8
Manor St
Covington, LA 70435
|
- sq. feet
|
- baths - beds |
$6,001
|
show details |

|
#9
5th St
Covington, LA 70433
|
- sq. feet
|
- baths - beds |
$6,001
|
show details |

|
#10
Ronald Reagan Hwy # 105
Covington, LA 70433
|
- sq. feet
|
- baths - beds |
show details |
| Photo | Address | Area | Beds / Baths | Price | Details |
|---|---|---|---|---|---|

|
#11
Eta Ave
Covington, LA 70435
|
- sq. feet
|
- baths - beds |
show details | |

|
#12
Continental Dr
Covington, LA 70433
|
- sq. feet
|
- baths - beds |
show details | |

|
#13
Covington Meadow Cir Apt F
Covington, LA 70433
|
- sq. feet
|
- baths - beds |
show details | |

|
#14
Highland Heights Dr
Covington, LA 70435
|
- sq. feet
|
- baths - beds |
show details | |

|
#15
Crestview Hills Loop
Covington, LA 70435
|
- sq. feet
|
- baths - beds |
show details | |

|
#16
Westshore Dr # K266
Covington, LA 70433
|
- sq. feet
|
- baths - beds |
show details | |

|
#17
Ok Ln
Covington, LA 70435
|
- sq. feet
|
- baths - beds |
show details | |

|
#18
Ronald Reagan Hwy # 103
Covington, LA 70433
|
- sq. feet
|
- baths - beds |
show details | |

|
#19
Dixie Dr
Covington, LA 70435
|
- sq. feet
|
- baths - beds |
show details | |

|
#20
E Brewster Rd
Covington, LA 70433
|
- sq. feet
|
- baths - beds |
show details |
| Photo | Address | Area | Beds / Baths | Price | Details |
|---|---|---|---|---|---|

|
#21
W 24th Ave
Covington, LA 70433
|
- sq. feet
|
- baths - beds |
show details | |

|
#22
Emerald Forest Blvd Apt 1201
Covington, LA 70433
|
- sq. feet
|
- baths - beds |
show details | |

|
#23
Park Place Dr Apt 2003
Covington, LA 70433
|
- sq. feet
|
- baths - beds |
show details | |

|
#24
N Florida St
Covington, LA 70433
|
- sq. feet
|
- baths - beds |
show details | |

|
#25
Ronald Reagan Hwy # 208
Covington, LA 70433
|
- sq. feet
|
- baths - beds |
show details | |

|
#26
Jasmine St
Covington, LA 70435
|
- sq. feet
|
- baths - beds |
show details | |

|
#27
Elaine Ln
Covington, LA 70435
|
- sq. feet
|
- baths - beds |
show details | |

|
#28
Karrie Ln
Covington, LA 70435
|
- sq. feet
|
- baths - beds |
show details | |

|
#29
Highway 21
Covington, LA 70433
|
- sq. feet
|
- baths - beds |
show details | |

|
#30
S America St
Covington, LA 70433
|
- sq. feet
|
- baths - beds |
show details |
| Photo | Address | Area | Beds / Baths | Price | Details |
|---|---|---|---|---|---|

|
#31
Sterken St
Covington, LA 70433
|
- sq. feet
|
- baths - beds |
show details | |

|
#32
Sullivan Ln, Apt 442
Covington, LA 70433
|
- sq. feet
|
- baths - beds |
show details | |

|
#33
Ronald Reagan Hwy # 308
Covington, LA 70433
|
- sq. feet
|
- baths - beds |
show details | |

|
#34
Saw Grass Loop
Covington, LA 70435
|
- sq. feet
|
- baths - beds |
show details | |

|
#35
K St
Covington, LA 70433
|
- sq. feet
|
- baths - beds |
show details | |

|
#36
Continental Dr, Unit 1017
Covington, LA 70433
|
- sq. feet
|
- baths - beds |
show details | |

|
#37
Emerald Fores 27-110
Covington, LA 70433
|
- sq. feet
|
- baths - beds |
show details | |

|
#38
N Highway 190
Covington, LA 70433
|
- sq. feet
|
- baths - beds |
show details | |

|
#39
Pickett Rd
Covington, LA 70435
|
- sq. feet
|
- baths - beds |
show details | |

|
#40
Jack Drive
Covington, LA 70433
|
- sq. feet
|
- baths - beds |
show details |
| Photo | Address | Area | Beds / Baths | Price | Details |
|---|---|---|---|---|---|

|
#41
Beech St
Covington, LA 70433
|
- sq. feet
|
- baths - beds |
show details | |

|
#42
E 7th Ave
Covington, LA 70433
|
- sq. feet
|
- baths - beds |
show details | |

|
#43
Emerald Forest Blvd Apt 16205
Covington, LA 70433
|
- sq. feet
|
- baths - beds |
show details | |

|
#44
Emerald Forest Blvd Apt 23104
Covington, LA 70433
|
- sq. feet
|
- baths - beds |
show details | |

|
#45
Lismore Ln
Covington, LA 70433
|
- sq. feet
|
- baths - beds |
show details | |

|
#46
Lismore Ln
Covington, LA 70433
|
- sq. feet
|
- baths - beds |
show details | |

|
#47
Lismore Ln
Covington, LA 70433
|
- sq. feet
|
- baths - beds |
show details | |

|
#48
Pear St
Covington, LA 70433
|
- sq. feet
|
- baths - beds |
show details | |

|
#49
Ochsner Blvd, Bldg 2 # Apt 217
Covington, LA 70433
|
- sq. feet
|
- baths - beds |
show details | |

|
Check over 1 million property listings on Foreclosure.com!
|
browse all offers | |||

Latest news about housing in Covington, LA collected exclusively by city-data.com from local newspapers, TV, and radio stations

 | Covington information (19 replies) |
| How much do you pay for rent in Nola? (3 replies) |
| Retiree want's to buy used trailer home in Covington. (0 replies) |
| Places to rent in Covington (0 replies) |
| Anyone from Mississippi currently living in the Covington or madisonville area? (0 replies) |
| Hammond area or Mississippi Coast for a single mom? (6 replies) |
Median year apartment built: 1987
Household type by relationship:
Households: 11,749- Male householders: 2,303 (508 living alone), Female householders: 2,050 (549 living alone)
1,949 spouses (1,916 opposite-sex spouses), 244 unmarried partners, (221 opposite-sex unmarried partners), 3,413 children (3,192 natural, 32 adopted, 187 stepchildren), 185 grandchildren, 118 brothers or sisters, 89 parents, 0 foster children, 268 other relatives, 198 non-relatives
- In group quarters: 927
Size of family households: 1,522 2-persons, 767 3-persons, 363 4-persons, 382 5-persons, 71 6-persons, 3 7-or-more-persons.
Size of nonfamily households: 1,143 1-person, 172 2-persons.
1,624 married couples with children.
843 single-parent households (207 men, 636 women).
92.5% of residents of Covington speak English at home.
4.8% of residents speak Spanish at home (60% speak English very well, 21% speak English well, 9% speak English not well, 10% don't speak English at all).
1.9% of residents speak other Indo-European language at home (73% speak English very well, 13% speak English well, 14% speak English not well).
0.5% of residents speak Asian or Pacific Island language at home (84% speak English very well, 16% speak English well).
0.2% of residents speak other language at home (100% speak English very well).
Foreign born population: 262 (2.2%)
(57.6% of them are naturalized citizens)
| Here: | 6.4 |
| State: | 6.2 |
| Here: | 4.2 |
| State: | 4.4 |

- Bedrooms in owner-occupied houses and condos in Covington, Louisiana
- 0no bedroom
- 601 bedroom
- 1962 bedrooms
- 1,6503 bedrooms
- 8414 bedrooms
- 1095+ bedrooms

- Bedrooms in renter-occupied apartments in Covington, Louisiana
- 52no bedroom
- 1551 bedroom
- 6772 bedrooms
- 6623 bedrooms
- 224 bedrooms
- 225+ bedrooms

- Cars and other vehicles available in Covington in owner-occupied houses/condos
- 170no vehicle
- 6871 vehicle
- 1,2312 vehicles
- 6453 vehicles
- 1244 vehicles
- 05+ vehicles

- Cars and other vehicles available in Covington in renter-occupied apartments
- 128no vehicle
- 8251 vehicle
- 5352 vehicles
- 1033 vehicles
- 04 vehicles
- 05+ vehicles

- Rooms in owner-occupied houses in Covington, Louisiana
- 01 room
- 02 rooms
- 493 rooms
- 604 rooms
- 5685 rooms
- 7316 rooms
- 6607 rooms
- 3378 rooms
- 4519+ rooms

- Rooms in renter-occupied apartments in Covington, Louisiana
- 521 room
- 92 rooms
- 2023 rooms
- 5584 rooms
- 3685 rooms
- 1566 rooms
- 1947 rooms
- 198 rooms
- 319+ rooms


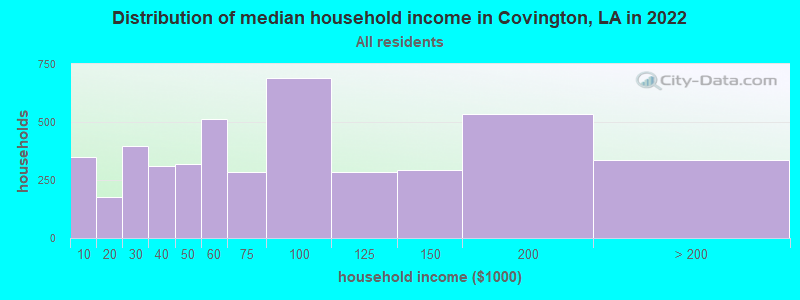
Covington, LA household income distribution

- 347Less than $10,000
- 176$10,000 to $19,999
- 396$20,000 to $29,999
- 309$30,000 to $39,999
- 321$40,000 to $49,999
- 512$50,000 to $59,999
- 285$60,000 to $74,999
- 689$75,000 to $99,999
- 283$100,000 to $124,999
- 293$125,000 to $149,999
- 535$150,000 to $199,999
- 338$200,000 or more
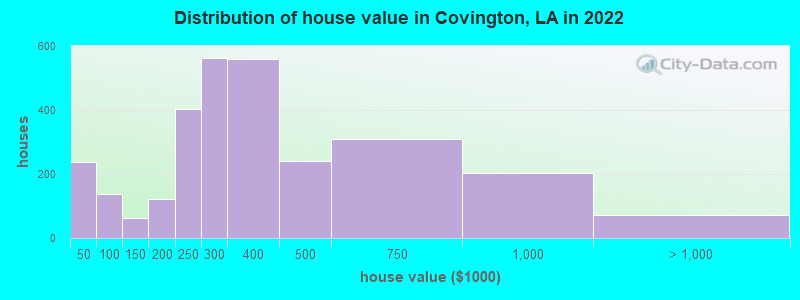
Home value of owner - occupied houses in 2022 in Covington, LA
-
- 141Less than $10,000
- 12$10,000 to $14,999
- 69$20,000 to $24,999
- 15$25,000 to $29,999
- 112$80,000 to $89,999
- 26$90,000 to $99,999
- 63$125,000 to $149,999
- 97$150,000 to $174,999
- 23$175,000 to $199,999
- 404$200,000 to $249,999
- 561$250,000 to $299,999
- 560$300,000 to $399,999
- 240$400,000 to $499,999
- 308$500,000 to $749,999
- 203$750,000 to $999,999
- 22$1,000,000 to $1,499,999
- 26$1,500,000 to $1,999,999
- 22$2,000,000 or more
Rent paid by renters in 2022 in Covington, LA
-
- 6$150 to $199
- 80$450 to $499
- 43$550 to $599
- 36$600 to $649
- 7$650 to $699
- 15$750 to $799
- 179$800 to $899
- 189$900 to $999
- 309$1,000 to $1,249
- 311$1,250 to $1,499
- 284$1,500 to $1,999
- 16$2,000 to $2,499
- 47No cash rent


Percentage of workers working in this county: 86.7%
Number of people working at home: 622 (13.2% of all workers)
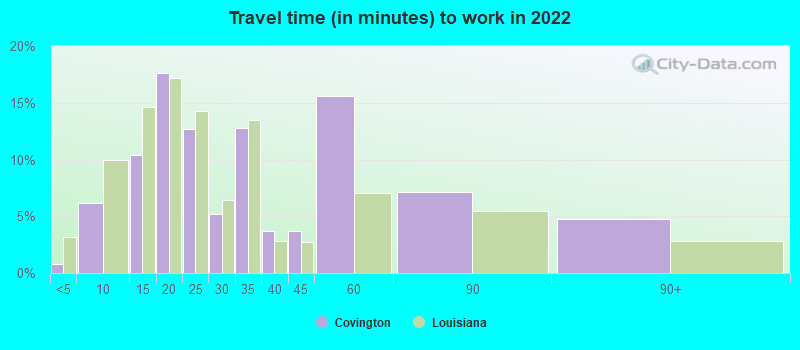
Travel time to work (commute)
- Less than 5 minutes: 71
- 5 to 9 minutes: 432
- 10 to 14 minutes: 630
- 15 to 19 minutes: 1,089
- 20 to 24 minutes: 426
- 25 to 29 minutes: 211
- 30 to 34 minutes: 322
- 35 to 39 minutes: 123
- 40 to 44 minutes: 76
- 45 to 59 minutes: 482
- 60 to 89 minutes: 252
- 90 or more minutes: 133
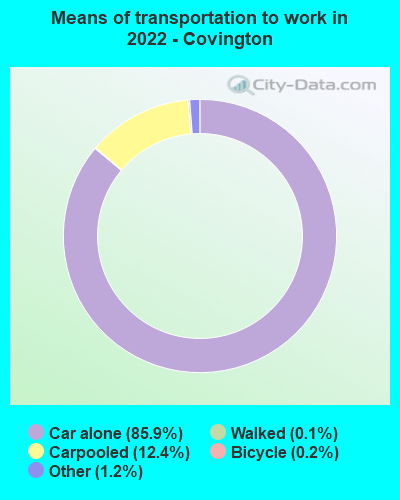
Means of transportation to work:
- Drove a car alone: 11,647 (81.3%)
- Carpooled: 1,676 (11.7%)
- Bus: 6 (0.0%)
- Taxi: 184 (1.3%)
- Bicycle: 24 (0.2%)
- Walked: 21 (0.1%)
- Worked at home: 622 (4.3%)

- Unemployment by race in 2022
- Unemployment rate for White non-Hispanic residents
- 7.7%Males
- 2.2%Females
- Unemployment rate for Black residents
- 17.2%Females
- Unemployment rate for other race residents
- 100.0%Females

- Year of entry for the foreign-born population in Covington, Louisiana
- 1112010 or later
- 432000 to 2009
- 521990 to 1999
- 141980 to 1989
- 251970 to 1979
- 34Before 1970

First ancestries reported:
- English: 406 (9.3%)
- French: 386 (8.8%)
- Irish: 382 (8.7%)
- American: 361 (8.2%)
- German: 318 (7.3%)
- Italian: 318 (7.3%)
- European: 144 (3.3%)
- Dutch: 101 (2.3%)
- French Canadian: 74 (1.7%)
- Norwegian: 65 (1.5%)
- Scotch-Irish: 65 (1.5%)
- Swedish: 58 (1.3%)
- Scottish: 51 (1.2%)
- Welsh: 39 (0.9%)
- Lebanese: 32 (0.7%)
- Northern European: 24 (0.5%)
- Cajun: 23 (0.5%)
- Romanian: 22 (0.5%)
- British: 12 (0.3%)
- Russian: 12 (0.3%)
- Canadian: 9 (0.2%)
Most common places of birth for foreign-born residents (%):
| Covington: | 34.8% (110) |
| Louisiana: | 18.9% (37,225) |
| Covington: | 18.7% (59) |
| Louisiana: | 1.5% (2,933) |
| Covington: | 10.1% (32) |
| Louisiana: | 0.4% (866) |
| Covington: | 6.6% (21) |
| Louisiana: | 0.4% (844) |
| Covington: | 5.1% (16) |
| Louisiana: | 0.3% (677) |
| Covington: | 4.7% (15) |
| Louisiana: | 1.5% (2,923) |
| Covington: | 4.4% (14) |
| Louisiana: | 0.8% (1,517) |
| Covington: | 3.2% (10) |
| Louisiana: | 3.4% (6,779) |
| Covington: | 3.2% (10) |
| Louisiana: | 0.7% (1,321) |
| Covington: | 2.8% (9) |
| Louisiana: | 0.7% (1,446) |
| Covington: | 2.5% (8) |
| Louisiana: | 0.7% (1,435) |
| Covington: | 2.5% (8) |
| Louisiana: | 1.6% (3,186) |
| Covington: | 2.2% (7) |
| Louisiana: | 2.8% (5,576) |
Place of birth for U.S.-born residents:
- This state: 9,538
- Other state: 2,014
- Northeast: 252
- Midwest: 222
- South: 1,193
- West: 373
81.7% of Covington residents lived in the same house 1 years ago.
Out of people who lived in different houses, 41.6% lived in this county.
Out of people who lived in different counties, 71.8% lived in Louisiana.
| Covington: | 81.7% |
| State average: | 88.3% |
Education attainment for males 25 years and older:
- No schooling: 31
- Nursery to 4th grade: 147
- 5th and 6th grade: 50
- 7th and 8th grade: 111
- 9th grade: 41
- 10th grade: 88
- 11th grade: 61
- 12th grade, no diploma: 58
- High school graduate (or equivalency): 910
- Less than 1 year of college: 284
- Some college more than 1 year, no degree: 604
- Associate degree: 221
- Bachelor's degree: 1,093
- Master's degree: 397
- Professional school degree: 61
- Doctorate degree: 41

Education attainment for females 25 years and older:
- No schooling: 7
- Nursery to 4th grade: 0
- 5th and 6th grade: 0
- 7th and 8th grade: 52
- 9th grade: 44
- 10th grade: 31
- 11th grade: 48
- 12th grade, no diploma: 93
- High school graduate (or equivalency): 715
- Less than 1 year of college: 210
- Some college more than 1 year, no degree: 626
- Associate degree: 486
- Bachelor's degree: 927
- Master's degree: 626
- Professional school degree: 67
- Doctorate degree: 0

Housing units in structures:
- One, detached: 3,758
- One, attached: 117
- Two: 141
- 3 or 4: 103
- 5 to 9: 38
- 10 to 19: 140
- 20 to 49: 243
- 50 or more: 96
- Mobile homes: 239
Median worth of mobile homes: $21,892
Housing units lacking complete kitchen facilities in 2022: 3.4%
House/condo owner moved in on average 10 years ago
Renter moved in on average 3 years ago

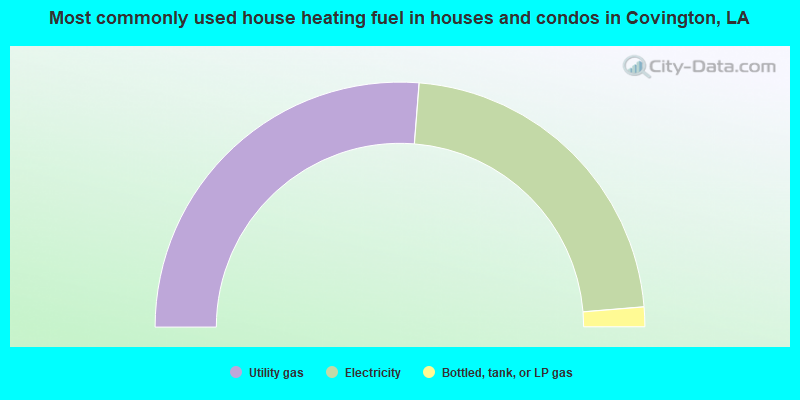
- 52.5%Utility gas
- 44.9%Electricity
- 2.6%Bottled, tank, or LP gas
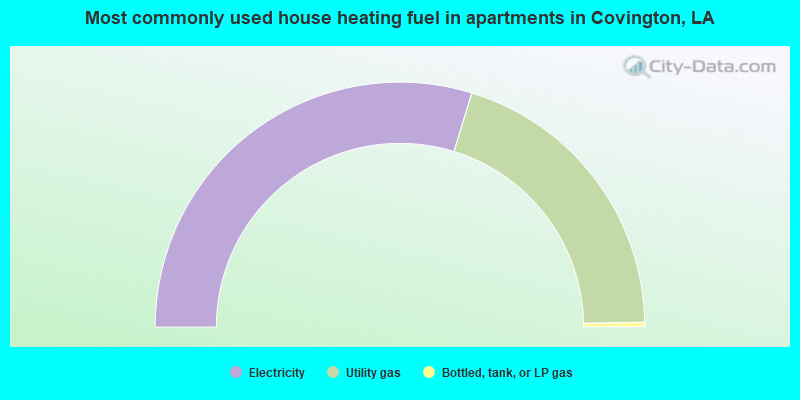
- 59.5%Electricity
- 39.9%Utility gas
- 0.6%Bottled, tank, or LP gas
Private vs. public school enrollment:
| Here: | 28.9% |
| Louisiana: | 19.6% |
| Here: | 45.4% |
| Louisiana: | 18.3% |
| Here: | 46.2% |
| Louisiana: | 17.4% |


