Cranston, RI (Rhode Island) Houses and Residents
| Cranston: | $364,800 |
| Rhode Island: | $383,900 |
Mean price in 2022:
Detached houses: $405,505
Here: $405,505 State: $445,354 Townhouses or other attached units: $339,290
Here: $339,290 State: $371,092 In 2-unit structures: $332,238
Here: $332,238 State: $317,098 In 3-to-4-unit structures: $352,027
Here: $352,027 State: $315,052 In 5-or-more-unit structures: $213,527
Here: $213,527 State: $291,252 Mobile homes: $155,635
Here: $155,635 State: $105,454
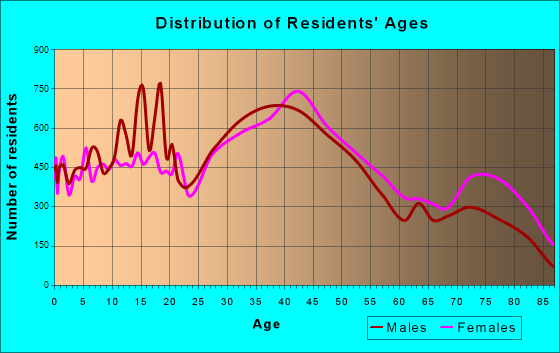
Total population: 81,037 (Urban population: 77,688, Rural population: 1,581 (65 farm, 1,516 nonfarm))
Houses: 33,977 (32,863 occupied: 20,553 owner occupied, 12,310 renter occupied)
| % of renters here: | 37% |
| State: | 37% |
Housing density: 1,189 houses/condos per square mile
Median price asked for vacant for-sale houses and condos in 2022: $258,467.
Median contract rent in 2022: $993 (lower quartile is $815, upper quartile is $1,342)
Median rent asked for vacant for-rent units in 2022: $583
Median gross rent in Cranston, RI in 2022: $1,270
Housing units in Cranston with a mortgage: 13,279 (1,903 second mortgage, 0 home equity loan, 1,704 both second mortgage and home equity loan)
Houses without a mortgage: 1,074
Median household income for houses/condos with a mortgage: $119,246
Median household income for apartments without a mortgage: $83,275
Median monthly housing costs: $1,414
Compare current foreclosures in Cranston, RI:
| Photo | Address | Area | Beds / Baths | Price | Details |
|---|---|---|---|---|---|

|
#1
Woburn St
Cranston, RI 02910
|
1,212 sq. feet
|
1 baths 4 beds |
show details | |

|
#2
Bracken St
Cranston, RI 02920
|
1,248 sq. feet
|
1 baths 4 beds |
show details | |

|
#3
Chestnut Ave
Cranston, RI 02910
|
1,040 sq. feet
|
1 baths 2 beds |
show details | |

|
#4
Lowell St
Cranston, RI 02910
|
1,389 sq. feet
|
1 baths 2 beds |
show details | |

|
#5
Lexington Ave
Cranston, RI 02910
|
1,728 sq. feet
|
2 baths 4 beds |
show details | |

|
#6
Roslyn Ave
Cranston, RI 02910
|
1,352 sq. feet
|
1 baths 3 beds |
show details | |

|
#7
Pheasant Dr
Cranston, RI 02920
|
1,264 sq. feet
|
1 baths 3 beds |
show details | |

|
#8
Kimberly Ln N
Cranston, RI 02921
|
1,470 sq. feet
|
2 baths 3 beds |
show details | |

|
#9
Midland Dr
Cranston, RI 02920
|
1,200 sq. feet
|
2 baths 3 beds |
show details | |

|
#10
Whipple Ave
Cranston, RI 02920
|
2,233 sq. feet
|
2 baths 6 beds |
show details |
| Photo | Address | Area | Beds / Baths | Price | Details |
|---|---|---|---|---|---|

|
#11
Scituate Ave # 2
Cranston, RI 02921
|
2,422 sq. feet
|
2 baths 8 beds |
show details | |

|
#12
Lippitt Ave
Cranston, RI 02921
|
999 sq. feet
|
2 baths 3 beds |
show details | |

|
#13
Chestnut Ave
Cranston, RI 02910
|
1,326 sq. feet
|
1 baths 3 beds |
show details | |

|
#14
Weston Ave
Cranston, RI 02920
|
2,378 sq. feet
|
2 baths 4 beds |
show details | |

|
#15
Fox Ridge Dr
Cranston, RI 02921
|
3,063 sq. feet
|
2 baths 3 beds |
show details | |

|
#16
N View Ave
Cranston, RI 02920
|
1,160 sq. feet
|
2 baths 3 beds |
show details | |

|
#17
Westcott Ave
Cranston, RI 02910
|
1,340 sq. feet
|
1 baths 3 beds |
show details | |

|
#18
Fletcher Ave
Cranston, RI 02920
|
1,125 sq. feet
|
2 baths 3 beds |
show details | |

|
#19
Phenix Ave
Cranston, RI 02921
|
2,570 sq. feet
|
2 baths 3 beds |
show details | |

|
#20
Oak St
Cranston, RI 02910
|
1,782 sq. feet
|
2 baths 4 beds |
show details |
| Photo | Address | Area | Beds / Baths | Price | Details |
|---|---|---|---|---|---|

|
#21
Harwood St
Cranston, RI 02910
|
1,456 sq. feet
|
1 baths 3 beds |
show details | |

|
#22
Eagle Rd
Cranston, RI 02920
|
1,392 sq. feet
|
1 baths 3 beds |
show details | |

|
#23
Paine Ave
Cranston, RI 02910
|
1,440 sq. feet
|
1 baths 3 beds |
show details | |

|
#24
North St
Cranston, RI 02920
|
3,658 sq. feet
|
3 baths 8 beds |
show details | |

|
#25
Baneberry Dr
Cranston, RI 02921
|
1,644 sq. feet
|
2 baths 3 beds |
show details | |

|
#26
Park View Blvd
Cranston, RI 02910
|
1,267 sq. feet
|
2 baths 4 beds |
show details | |

|
#27
Raven Cir
Cranston, RI 02921
|
3,660 sq. feet
|
2 baths 3 beds |
show details | |

|
#28
Hawthorne Ave # 2
Cranston, RI 02910
|
2,123 sq. feet
|
2 baths 4 beds |
show details | |

|
#29
Elena St Apt 209
Cranston, RI 02920
|
- sq. feet
|
- baths - beds |
show details | |

|
#30
Curry Rd
Cranston, RI 02920
|
- sq. feet
|
- baths - beds |
show details |
| Photo | Address | Area | Beds / Baths | Price | Details |
|---|---|---|---|---|---|

|
#31
Independence Way Apt 30212
Cranston, RI 02921
|
- sq. feet
|
- baths - beds |
show details | |

|
#32
Crescent Ave
Cranston, RI 02910
|
- sq. feet
|
- baths - beds |
show details | |

|
#33
Fairway Dr
Cranston, RI 02920
|
- sq. feet
|
- baths - beds |
show details | |

|
#34
Pleasant St # 2
Cranston, RI 02910
|
- sq. feet
|
- baths - beds |
show details | |

|
#35
Oaklawn Ave Apt 106
Cranston, RI 02920
|
- sq. feet
|
- baths - beds |
show details | |

|
#36
High School Ave
Cranston, RI 02910
|
- sq. feet
|
- baths - beds |
show details | |

|
#37
Hoffman Ave Apt 2
Cranston, RI 02920
|
- sq. feet
|
- baths - beds |
show details | |

|
#38
Plainfield Pike
Cranston, RI 02921
|
- sq. feet
|
- baths - beds |
show details | |

|
#39
Fenner St Apt 3
Cranston, RI 02910
|
- sq. feet
|
- baths - beds |
show details | |

|
#40
Auburn St
Cranston, RI 02910
|
- sq. feet
|
- baths - beds |
show details |
| Photo | Address | Area | Beds / Baths | Price | Details |
|---|---|---|---|---|---|

|
#41
Hillwood St
Cranston, RI 02920
|
- sq. feet
|
- baths - beds |
show details | |

|
#42
Belmont Rd
Cranston, RI 02910
|
- sq. feet
|
- baths - beds |
show details | |

|
Check over 1 million property listings on Foreclosure.com!
|
browse all offers | |||

Latest news about housing in Cranston, RI collected exclusively by city-data.com from local newspapers, TV, and radio stations

 | How are Pascoag, Lincoln, Warwick, Cranston, Pawtucket in terms or safety / quality of life for a renter? (46 replies) |
| RI Real Estate in huge demand (147 replies) |
| Rhode Island Housing Crisis? (51 replies) |
| Apartments for Rent that allow large dogs (2 replies) |
| Buying a house in RI vs CT? (177 replies) |
| Median RI house prices UP 17% over last year (72 replies) |
Median year apartment built: 1958
Household type by relationship:
Households: 82,432- Male householders: 15,607 (3,694 living alone), Female householders: 17,256 (7,333 living alone)
13,543 spouses (13,323 opposite-sex spouses), 2,777 unmarried partners, (2,681 opposite-sex unmarried partners), 21,803 children (19,947 natural, 747 adopted, 1,109 stepchildren), 1,098 grandchildren, 462 brothers or sisters, 2,283 parents, 0 foster children, 1,212 other relatives, 1,862 non-relatives
- In group quarters: 4,529
Size of family households: 9,240 2-persons, 3,870 3-persons, 3,993 4-persons, 1,203 5-persons, 646 6-persons, 553 7-or-more-persons.
Size of nonfamily households: 11,027 1-person, 2,191 2-persons, 46 3-persons, 45 4-persons, 49 5-persons.
10,533 married couples with children.
4,381 single-parent households (3,034 men, 1,347 women).
75.8% of residents of Cranston speak English at home.
13.1% of residents speak Spanish at home (55% speak English very well, 20% speak English well, 21% speak English not well, 5% don't speak English at all).
5.9% of residents speak other Indo-European language at home (73% speak English very well, 17% speak English well, 5% speak English not well, 5% don't speak English at all).
4.2% of residents speak Asian or Pacific Island language at home (54% speak English very well, 22% speak English well, 18% speak English not well, 6% don't speak English at all).
1.0% of residents speak other language at home (70% speak English very well, 27% speak English well, 3% speak English not well).
Foreign born population: 13,296 (16.1%)
(62.0% of them are naturalized citizens)
| Here: | 6.3 |
| State: | 6.2 |
| Here: | 4.5 |
| State: | 4.1 |

- Bedrooms in owner-occupied houses and condos in Cranston, Rhode Island
- 0no bedroom
- 1,2691 bedroom
- 4,2342 bedrooms
- 11,4563 bedrooms
- 3,1894 bedrooms
- 4055+ bedrooms

- Bedrooms in renter-occupied apartments in Cranston, Rhode Island
- 223no bedroom
- 4,7691 bedroom
- 5,2532 bedrooms
- 1,1733 bedrooms
- 4824 bedrooms
- 4105+ bedrooms

- Cars and other vehicles available in Cranston in owner-occupied houses/condos
- 567no vehicle
- 6,1281 vehicle
- 10,9062 vehicles
- 1,7233 vehicles
- 1,0894 vehicles
- 1405+ vehicles

- Cars and other vehicles available in Cranston in renter-occupied apartments
- 1,956no vehicle
- 5,3741 vehicle
- 3,9452 vehicles
- 9553 vehicles
- 04 vehicles
- 805+ vehicles

- Rooms in owner-occupied houses in Cranston, Rhode Island
- 01 room
- 02 rooms
- 5673 rooms
- 1,9264 rooms
- 4,0105 rooms
- 4,8616 rooms
- 3,5697 rooms
- 2,7378 rooms
- 2,8839+ rooms

- Rooms in renter-occupied apartments in Cranston, Rhode Island
- 2231 room
- 2,2942 rooms
- 2,0643 rooms
- 1,5144 rooms
- 3,3595 rooms
- 1,5116 rooms
- 7397 rooms
- 2138 rooms
- 3939+ rooms


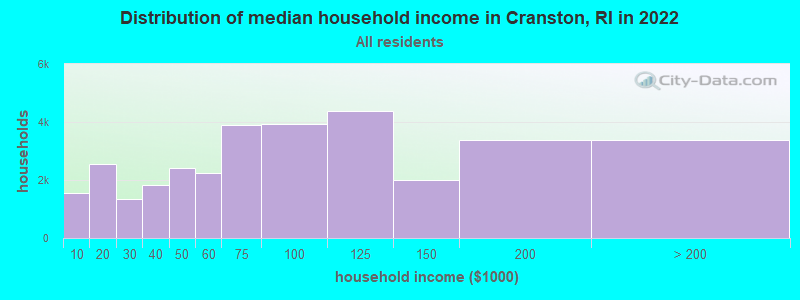
Cranston, RI household income distribution

- 1,535Less than $10,000
- 2,560$10,000 to $19,999
- 1,334$20,000 to $29,999
- 1,821$30,000 to $39,999
- 2,431$40,000 to $49,999
- 2,234$50,000 to $59,999
- 3,889$60,000 to $74,999
- 3,917$75,000 to $99,999
- 4,393$100,000 to $124,999
- 1,991$125,000 to $149,999
- 3,387$150,000 to $199,999
- 3,371$200,000 or more
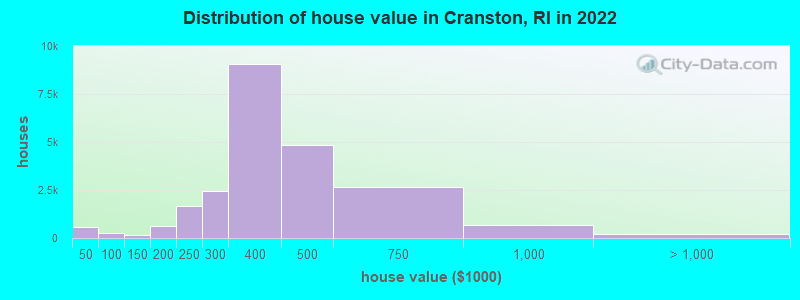
Home value of owner - occupied houses in 2022 in Cranston, RI
-
- 156Less than $10,000
- 3$10,000 to $14,999
- 47$20,000 to $24,999
- 32$25,000 to $29,999
- 101$30,000 to $34,999
- 44$35,000 to $39,999
- 170$40,000 to $49,999
- 7$50,000 to $59,999
- 30$70,000 to $79,999
- 32$80,000 to $89,999
- 7$90,000 to $99,999
- 60$100,000 to $124,999
- 86$125,000 to $149,999
- 190$150,000 to $174,999
- 435$175,000 to $199,999
- 1,668$200,000 to $249,999
- 2,459$250,000 to $299,999
- 9,082$300,000 to $399,999
- 4,862$400,000 to $499,999
- 2,675$500,000 to $749,999
- 682$750,000 to $999,999
- 179$1,000,000 to $1,499,999
- 24$2,000,000 or more
Rent paid by renters in 2022 in Cranston, RI
-
- 14Less than $100
- 16$150 to $199
- 206$200 to $249
- 461$250 to $299
- 189$300 to $349
- 143$350 to $399
- 124$400 to $449
- 179$450 to $499
- 278$500 to $549
- 130$550 to $599
- 107$600 to $649
- 125$650 to $699
- 173$700 to $749
- 240$750 to $799
- 588$800 to $899
- 599$900 to $999
- 2,486$1,000 to $1,249
- 2,191$1,250 to $1,499
- 2,238$1,500 to $1,999
- 806$2,000 to $2,499
- 19$2,500 to $2,999
- 8$3,000 to $3,499
- 31$3,500 or more
- 508No cash rent


Percentage of workers working in this county: 71.0%
Number of people working at home: 4,903 (11.8% of all workers)
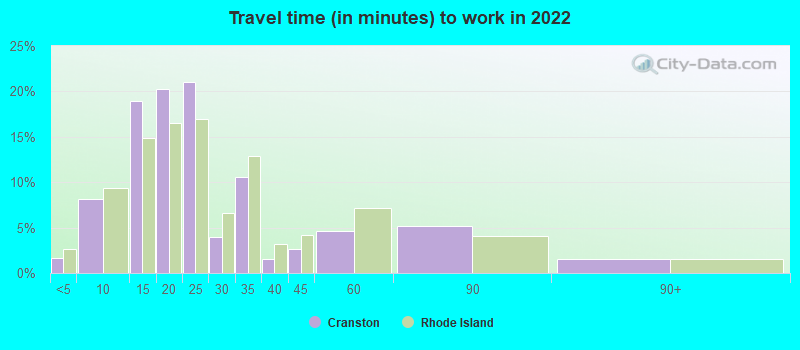
Travel time to work (commute)
- Less than 5 minutes: 340
- 5 to 9 minutes: 2,650
- 10 to 14 minutes: 3,630
- 15 to 19 minutes: 9,019
- 20 to 24 minutes: 7,542
- 25 to 29 minutes: 1,432
- 30 to 34 minutes: 4,607
- 35 to 39 minutes: 1,764
- 40 to 44 minutes: 910
- 45 to 59 minutes: 1,934
- 60 to 89 minutes: 2,019
- 90 or more minutes: 309
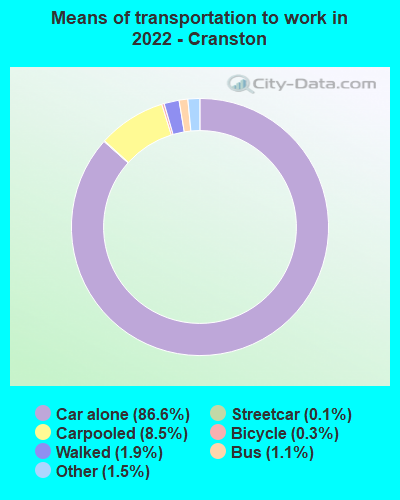
Means of transportation to work:
- Drove a car alone: 24,425 (72.8%)
- Carpooled: 2,652 (7.9%)
- Bus: 244 (0.7%)
- Subway or elevated rail: 52 (0.2%)
- Long-distance train or commuter rail: 7 (0.0%)
- Taxi: 713 (2.1%)
- Bicycle: 127 (0.4%)
- Walked: 603 (1.8%)
- Worked at home: 4,903 (14.6%)

- Unemployment by race in 2022
- Unemployment rate for White non-Hispanic residents
- 2.2%Males
- 2.8%Females
- Unemployment rate for Black residents
- 6.7%Males
- 11.9%Females
- Unemployment rate for American Indian and Alaska Native residents
- 11.6%Males
- 1.6%Females
- Unemployment rate for Asian residents
- 6.9%Males
- 4.2%Females
- Unemployment rate for other race residents
- 8.1%Males
- 6.5%Females
- Unemployment rate for two or more race residents
- 12.5%Males
- 10.3%Females
- Unemployment rate for Hispanic or Latino residents
- 6.4%Males
- 2.9%Females

- Year of entry for the foreign-born population in Cranston, Rhode Island
- 4,2962010 or later
- 2,1802000 to 2009
- 2,7161990 to 1999
- 1,9011980 to 1989
- 1,4831970 to 1979
- 2,030Before 1970

First ancestries reported:
- Italian: 11,639 (25.8%)
- Irish: 3,378 (7.5%)
- American: 2,370 (5.3%)
- Portuguese: 2,292 (5.1%)
- English: 2,065 (4.6%)
- French: 898 (2.0%)
- French Canadian: 894 (2.0%)
- Nigerian: 819 (1.8%)
- German: 803 (1.8%)
- Greek: 676 (1.5%)
- Cape Verdean: 567 (1.3%)
- Polish: 535 (1.2%)
- Haitian: 504 (1.1%)
- Armenian: 341 (0.8%)
- Egyptian: 225 (0.5%)
- European: 202 (0.4%)
- Scottish: 188 (0.4%)
- Russian: 159 (0.4%)
- Lebanese: 149 (0.3%)
- Trinidadian and Tobagonian: 126 (0.3%)
- Swedish: 103 (0.2%)
- British: 101 (0.2%)
- Hungarian: 86 (0.2%)
- Ukrainian: 73 (0.2%)
- Eastern European: 72 (0.2%)
- Liberian: 59 (0.1%)
- Moroccan: 58 (0.1%)
- Jamaican: 49 (0.1%)
- Northern European: 46 (0.1%)
- Brazilian: 46 (0.1%)
- Norwegian: 43 (0.10%)
- Guyanese: 41 (0.09%)
- Lithuanian: 39 (0.09%)
- British West Indian: 39 (0.09%)
- Croatian: 33 (0.07%)
- African: 26 (0.06%)
- Canadian: 25 (0.06%)
- Senegalese: 24 (0.05%)
- Iraqi: 23 (0.05%)
- Scotch-Irish: 21 (0.05%)
- Icelander: 19 (0.04%)
- Latvian: 18 (0.04%)
- Romanian: 17 (0.04%)
- Scandinavian: 17 (0.04%)
- South African: 16 (0.04%)
- Arab: 14 (0.03%)
- Israeli: 11 (0.02%)
- Austrian: 11 (0.02%)
- Swiss: 10 (0.02%)
- Turkish: 8 (0.02%)
- Dutch: 7 (0.02%)
- Bulgarian: 7 (0.02%)
- Belgian: 3 (0.01%)
Most common places of birth for foreign-born residents (%):
| Cranston: | 19.1% (2,486) |
| Rhode Island: | 21.0% (33,163) |
| Cranston: | 14.3% (1,860) |
| Rhode Island: | 10.4% (16,385) |
| Cranston: | 6.9% (896) |
| Rhode Island: | 1.7% (2,625) |
| Cranston: | 6.8% (892) |
| Rhode Island: | 3.0% (4,789) |
| Cranston: | 6.5% (850) |
| Rhode Island: | 10.0% (15,766) |
| Cranston: | 4.4% (571) |
| Rhode Island: | 4.1% (6,461) |
| Cranston: | 3.5% (453) |
| Rhode Island: | 1.9% (2,997) |
| Cranston: | 2.9% (376) |
| Rhode Island: | 1.2% (1,902) |
| Cranston: | 2.8% (365) |
| Rhode Island: | 1.4% (2,155) |
| Cranston: | 2.3% (300) |
| Rhode Island: | 1.9% (3,057) |
| Cranston: | 2.1% (268) |
| Rhode Island: | 1.3% (2,091) |
Place of birth for U.S.-born residents:
- This state: 51,165
- Other state: 16,092
- Northeast: 11,190
- Midwest: 1,166
- South: 2,690
- West: 1,046
89.9% of Cranston residents lived in the same house 1 years ago.
Out of people who lived in different houses, 39.7% lived in this county.
Out of people who lived in different counties, 33.0% lived in Rhode Island.
| Cranston: | 89.9% |
| State average: | 89.3% |
Education attainment for males 25 years and older:
- No schooling: 553
- Nursery to 4th grade: 217
- 5th and 6th grade: 351
- 7th and 8th grade: 886
- 9th grade: 604
- 10th grade: 181
- 11th grade: 218
- 12th grade, no diploma: 690
- High school graduate (or equivalency): 6,397
- Less than 1 year of college: 2,856
- Some college more than 1 year, no degree: 3,795
- Associate degree: 2,496
- Bachelor's degree: 6,543
- Master's degree: 2,523
- Professional school degree: 587
- Doctorate degree: 654

Education attainment for females 25 years and older:
- No schooling: 980
- Nursery to 4th grade: 0
- 5th and 6th grade: 191
- 7th and 8th grade: 1,033
- 9th grade: 559
- 10th grade: 118
- 11th grade: 36
- 12th grade, no diploma: 403
- High school graduate (or equivalency): 7,229
- Less than 1 year of college: 1,399
- Some college more than 1 year, no degree: 3,584
- Associate degree: 3,909
- Bachelor's degree: 5,872
- Master's degree: 4,068
- Professional school degree: 824
- Doctorate degree: 654

Housing units in structures:
- One, detached: 20,391
- One, attached: 980
- Two: 3,542
- 3 or 4: 3,110
- 5 to 9: 1,286
- 10 to 19: 1,068
- 20 to 49: 1,004
- 50 or more: 2,559
- Mobile homes: 37
Housing units lacking complete kitchen facilities in 2022: 0.8%
House/condo owner moved in on average 11 years ago
Renter moved in on average 5 years ago

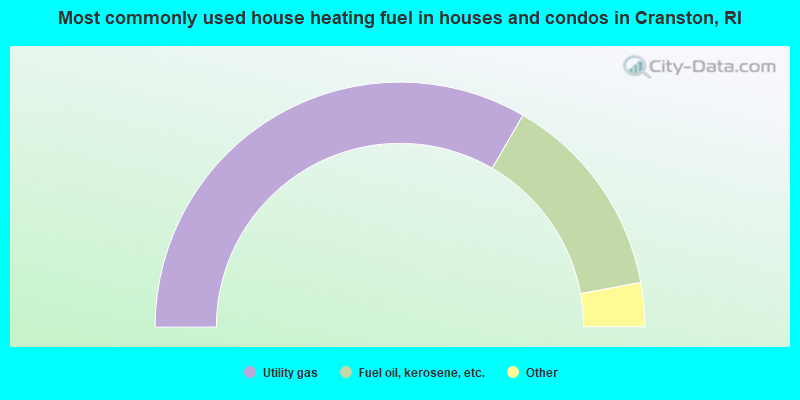
- 66.7%Utility gas
- 27.4%Fuel oil, kerosene, etc.
- 3.5%Electricity
- 1.5%Bottled, tank, or LP gas
- 0.5%Wood
- 0.1%Other fuel
- 0.1%Solar energy
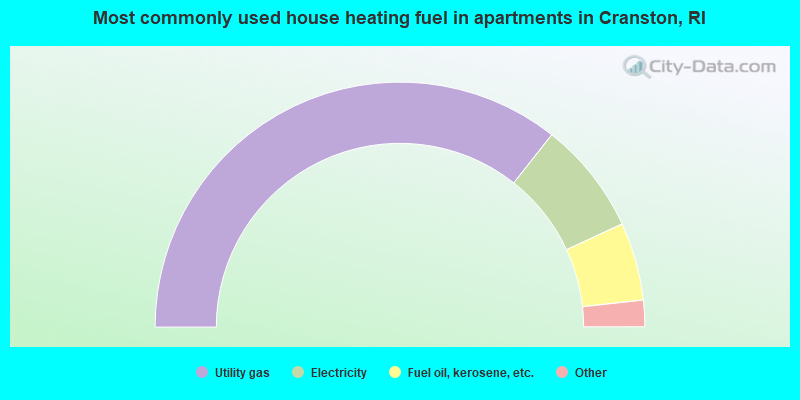
- 71.3%Utility gas
- 14.9%Electricity
- 10.3%Fuel oil, kerosene, etc.
- 2.1%Bottled, tank, or LP gas
- 0.9%No fuel used
- 0.5%Other fuel
Private vs. public school enrollment:
| Here: | 16.3% |
| Rhode Island: | 12.2% |
| Here: | 18.1% |
| Rhode Island: | 11.6% |
| Here: | 20.4% |
| Rhode Island: | 41.1% |


