Races in Cranston, Rhode Island (RI) Detailed Stats
Data:
Races - White alone (%)
Races - White alone (% change since 2000)
Races - Black alone (%)
Races - Black alone (% change since 2000)
Races - American Indian alone (%)
Races - American Indian alone (% change since 2000)
Races - Asian alone (%)
Races - Asian alone (% change since 2000)
Races - Hispanic (%)
Races - Hispanic (% change since 2000)
Races - Native Hawaiian and Other Pacific Islander alone (%)
Races - Native Hawaiian and Other Pacific Islander alone (% change since 2000)
Races - Two or more races(%)
Races - Two or more races(% change since 2000)
Races - Other race alone (%)
Races - Other race alone (% change since 2000)
Racial diversity
Place of birth - Born in state of residence (%)
Place of birth - Born in state of residence (%) - White
Place of birth - Born in state of residence (%) - Black or African American
Place of birth - Born in state of residence (%) - Asian
Place of birth - Born in state of residence (%) - Hispanic or Latino
Place of birth - Born in state of residence (%) - American Indian and Alaska Native
Place of birth - Born in state of residence (%) - Multirace
Place of birth - Born in state of residence (%) - Other Race
Place of birth - Born in other state (%)
Place of birth - Born in other state (%) - White
Place of birth - Born in other state (%) - Black or African American
Place of birth - Born in other state (%) - Asian
Place of birth - Born in other state (%) - Hispanic or Latino
Place of birth - Born in other state (%) - American Indian and Alaska Native
Place of birth - Born in other state (%) - Multirace
Place of birth - Born in other state (%) - Other Race
Place of birth - Native, outside of US (%)
Place of birth - Native, outside of US (%) - White
Place of birth - Native, outside of US (%) - Black or African American
Place of birth - Native, outside of US (%) - Asian
Place of birth - Native, outside of US (%) - Hispanic or Latino
Place of birth - Native, outside of US (%) - American Indian and Alaska Native
Place of birth - Native, outside of US (%) - Multirace
Place of birth - Native, outside of US (%) - Other Race
Place of birth - Foreign born (%)
Place of birth - Foreign born (%) - White
Place of birth - Foreign born (%) - Black or African American
Place of birth - Foreign born (%) - Asian
Place of birth - Foreign born (%) - Hispanic or Latino
Place of birth - Foreign born (%) - American Indian and Alaska Native
Place of birth - Foreign born (%) - Multirace
Place of birth - Foreign born (%) - Other Race
Residents speaking English at home (%)
Residents speaking English at home - Born in the United States (%)
Residents speaking English at home - Native, born elsewhere (%)
Residents speaking English at home - Foreign born (%)
Residents speaking Spanish at home (%)
Residents speaking Spanish at home - Born in the United States (%)
Residents speaking Spanish at home - Native, born elsewhere (%)
Residents speaking Spanish at home - Foreign born (%)
Residents speaking other language at home (%)
Residents speaking other language at home - Born in the United States (%)
Residents speaking other language at home - Native, born elsewhere (%)
Residents speaking other language at home - Foreign born (%)
Marital status - Never married (%)
Marital status - Now married (%)
Marital status - Separated (%)
Marital status - Widowed (%)
Marital status - Divorced (%)
Ancestries Reported - Arab (%)
Ancestries Reported - Czech (%)
Ancestries Reported - Danish (%)
Ancestries Reported - Dutch (%)
Ancestries Reported - English (%)
Ancestries Reported - French (%)
Ancestries Reported - French Canadian (%)
Ancestries Reported - German (%)
Ancestries Reported - Greek (%)
Ancestries Reported - Hungarian (%)
Ancestries Reported - Irish (%)
Ancestries Reported - Italian (%)
Ancestries Reported - Lithuanian (%)
Ancestries Reported - Norwegian (%)
Ancestries Reported - Polish (%)
Ancestries Reported - Portuguese (%)
Ancestries Reported - Russian (%)
Ancestries Reported - Scotch-Irish (%)
Ancestries Reported - Scottish (%)
Ancestries Reported - Slovak (%)
Ancestries Reported - Subsaharan African (%)
Ancestries Reported - Swedish (%)
Ancestries Reported - Swiss (%)
Ancestries Reported - Ukrainian (%)
Ancestries Reported - United States (%)
Ancestries Reported - Welsh (%)
Ancestries Reported - West Indian (%)
Ancestries Reported - Other (%)
Geographical mobility - Same house 1 year ago (%)
Geographical mobility - Same house 1 year ago (%) - White
Geographical mobility - Same house 1 year ago (%) - Black or African American
Geographical mobility - Same house 1 year ago (%) - Asian
Geographical mobility - Same house 1 year ago (%) - Hispanic or Latino
Geographical mobility - Same house 1 year ago (%) - American Indian and Alaska Native
Geographical mobility - Same house 1 year ago (%) - Multirace
Geographical mobility - Same house 1 year ago (%) - Other Race
Geographical mobility - Moved within same county (%)
Geographical mobility - Moved within same county (%) - White
Geographical mobility - Moved within same county (%) - Black or African American
Geographical mobility - Moved within same county (%) - Asian
Geographical mobility - Moved within same county (%) - Hispanic or Latino
Geographical mobility - Moved within same county (%) - American Indian and Alaska Native
Geographical mobility - Moved within same county (%) - Multirace
Geographical mobility - Moved within same county (%) - Other Race
Geographical mobility - Moved from different county within same state (%)
Geographical mobility - Moved from different county within same state (%) - White
Geographical mobility - Moved from different county within same state (%) - Black or African American
Geographical mobility - Moved from different county within same state (%) - Asian
Geographical mobility - Moved from different county within same state (%) - Hispanic or Latino
Geographical mobility - Moved from different county within same state (%) - American Indian and Alaska Native
Geographical mobility - Moved from different county within same state (%) - Multirace
Geographical mobility - Moved from different county within same state (%) - Other Race
Geographical mobility - Moved from different state (%)
Geographical mobility - Moved from different state (%) - White
Geographical mobility - Moved from different state (%) - Black or African American
Geographical mobility - Moved from different state (%) - Asian
Geographical mobility - Moved from different state (%) - Hispanic or Latino
Geographical mobility - Moved from different state (%) - American Indian and Alaska Native
Geographical mobility - Moved from different state (%) - Multirace
Geographical mobility - Moved from different state (%) - Other Race
Geographical mobility - Moved from abroad (%)
Geographical mobility - Moved from abroad (%) - White
Geographical mobility - Moved from abroad (%) - Black or African American
Geographical mobility - Moved from abroad (%) - Asian
Geographical mobility - Moved from abroad (%) - Hispanic or Latino
Geographical mobility - Moved from abroad (%) - American Indian and Alaska Native
Geographical mobility - Moved from abroad (%) - Multirace
Geographical mobility - Moved from abroad (%) - Other Race
Place of birth for the foreign-born population - Ireland (%)
Place of birth for the foreign-born population - Denmark (%)
Place of birth for the foreign-born population - Norway (%)
Place of birth for the foreign-born population - Sweden (%)
Place of birth for the foreign-born population - United Kingdom (%)
Place of birth for the foreign-born population - England (%)
Place of birth for the foreign-born population - Scotland (%)
Place of birth for the foreign-born population - Other Northern Europe (%)
Place of birth for the foreign-born population - Austria (%)
Place of birth for the foreign-born population - Belgium (%)
Place of birth for the foreign-born population - France (%)
Place of birth for the foreign-born population - Germany (%)
Place of birth for the foreign-born population - Netherlands (%)
Place of birth for the foreign-born population - Switzerland (%)
Place of birth for the foreign-born population - Other Western Europe (%)
Place of birth for the foreign-born population - Greece (%)
Place of birth for the foreign-born population - Italy (%)
Place of birth for the foreign-born population - Portugal (%)
Place of birth for the foreign-born population - Spain (%)
Place of birth for the foreign-born population - Other Southern Europe (%)
Place of birth for the foreign-born population - Albania (%)
Place of birth for the foreign-born population - Belarus (%)
Place of birth for the foreign-born population - Bosnia and Herzegovina (%)
Place of birth for the foreign-born population - Bulgaria (%)
Place of birth for the foreign-born population - Croatia (%)
Place of birth for the foreign-born population - Czechoslovakia (%)
Place of birth for the foreign-born population - Hungary (%)
Place of birth for the foreign-born population - Latvia (%)
Place of birth for the foreign-born population - Lithuania (%)
Place of birth for the foreign-born population - North Macedonia (Macedonia) (%)
Place of birth for the foreign-born population - Moldova (%)
Place of birth for the foreign-born population - Poland (%)
Place of birth for the foreign-born population - Romania (%)
Place of birth for the foreign-born population - Russia (%)
Place of birth for the foreign-born population - Serbia (%)
Place of birth for the foreign-born population - Ukraine (%)
Place of birth for the foreign-born population - Other Eastern Europe (%)
Place of birth for the foreign-born population - China (%)
Place of birth for the foreign-born population - Hong Kong (%)
Place of birth for the foreign-born population - Taiwan (%)
Place of birth for the foreign-born population - Japan (%)
Place of birth for the foreign-born population - Korea (%)
Place of birth for the foreign-born population - Other Eastern Asia (%)
Place of birth for the foreign-born population - Afghanistan (%)
Place of birth for the foreign-born population - Bangladesh (%)
Place of birth for the foreign-born population - India (%)
Place of birth for the foreign-born population - Iran (%)
Place of birth for the foreign-born population - Kazakhstan (%)
Place of birth for the foreign-born population - Nepal (%)
Place of birth for the foreign-born population - Pakistan (%)
Place of birth for the foreign-born population - Sri Lanka (%)
Place of birth for the foreign-born population - Uzbekistan (%)
Place of birth for the foreign-born population - Other South Central Asia (%)
Place of birth for the foreign-born population - Burma (%)
Place of birth for the foreign-born population - Cambodia (%)
Place of birth for the foreign-born population - Indonesia (%)
Place of birth for the foreign-born population - Laos (%)
Place of birth for the foreign-born population - Malaysia (%)
Place of birth for the foreign-born population - Philippines (%)
Place of birth for the foreign-born population - Singapore (%)
Place of birth for the foreign-born population - Thailand (%)
Place of birth for the foreign-born population - Vietnam (%)
Place of birth for the foreign-born population - Other South Eastern Asia (%)
Place of birth for the foreign-born population - Armenia (%)
Place of birth for the foreign-born population - Iraq (%)
Place of birth for the foreign-born population - Israel (%)
Place of birth for the foreign-born population - Jordan (%)
Place of birth for the foreign-born population - Kuwait (%)
Place of birth for the foreign-born population - Lebanon (%)
Place of birth for the foreign-born population - Saudi Arabia (%)
Place of birth for the foreign-born population - Syria (%)
Place of birth for the foreign-born population - Turkey (%)
Place of birth for the foreign-born population - Yemen (%)
Place of birth for the foreign-born population - Other Western Asia (%)
Place of birth for the foreign-born population - Eritrea (%)
Place of birth for the foreign-born population - Ethiopia (%)
Place of birth for the foreign-born population - Kenya (%)
Place of birth for the foreign-born population - Somalia (%)
Place of birth for the foreign-born population - Uganda (%)
Place of birth for the foreign-born population - Zimbabwe (%)
Place of birth for the foreign-born population - Other Eastern Africa (%)
Place of birth for the foreign-born population - Cameroon (%)
Place of birth for the foreign-born population - Congo (%)
Place of birth for the foreign-born population - Democratic Republic of Congo (Zaire) (%)
Place of birth for the foreign-born population - Other Middle Africa (%)
Place of birth for the foreign-born population - Egypt (%)
Place of birth for the foreign-born population - Morocco (%)
Place of birth for the foreign-born population - Sudan (%)
Place of birth for the foreign-born population - Other Northern Africa (%)
Place of birth for the foreign-born population - South Africa (%)
Place of birth for the foreign-born population - Other Southern Africa (%)
Place of birth for the foreign-born population - Cabo Verde (%)
Place of birth for the foreign-born population - Ghana (%)
Place of birth for the foreign-born population - Liberia (%)
Place of birth for the foreign-born population - Nigeria (%)
Place of birth for the foreign-born population - Senegal (%)
Place of birth for the foreign-born population - Sierra Leone (%)
Place of birth for the foreign-born population - Other Western Africa (%)
Place of birth for the foreign-born population - Australia (%)
Place of birth for the foreign-born population - New Zealand (%)
Place of birth for the foreign-born population - Fiji (%)
Place of birth for the foreign-born population - Micronesia (%)
Place of birth for the foreign-born population - Bahamas (%)
Place of birth for the foreign-born population - Barbados (%)
Place of birth for the foreign-born population - Cuba (%)
Place of birth for the foreign-born population - Dominica (%)
Place of birth for the foreign-born population - Dominican Republic (%)
Place of birth for the foreign-born population - Grenada (%)
Place of birth for the foreign-born population - Haiti (%)
Place of birth for the foreign-born population - Jamaica (%)
Place of birth for the foreign-born population - St. Vincent and the Grenadines (%)
Place of birth for the foreign-born population - Trinidad and Tobago (%)
Place of birth for the foreign-born population - West Indies (%)
Place of birth for the foreign-born population - Other Caribbean (%)
Place of birth for the foreign-born population - Belize (%)
Place of birth for the foreign-born population - Costa Rica (%)
Place of birth for the foreign-born population - El Salvador (%)
Place of birth for the foreign-born population - Guatemala (%)
Place of birth for the foreign-born population - Honduras (%)
Place of birth for the foreign-born population - Mexico (%)
Place of birth for the foreign-born population - Nicaragua (%)
Place of birth for the foreign-born population - Panama (%)
Place of birth for the foreign-born population - Other Central America (%)
Place of birth for the foreign-born population - Argentina (%)
Place of birth for the foreign-born population - Bolivia (%)
Place of birth for the foreign-born population - Brazil (%)
Place of birth for the foreign-born population - Chile (%)
Place of birth for the foreign-born population - Colombia (%)
Place of birth for the foreign-born population - Ecuador (%)
Place of birth for the foreign-born population - Guyana (%)
Place of birth for the foreign-born population - Peru (%)
Place of birth for the foreign-born population - Uruguay (%)
Place of birth for the foreign-born population - Venezuela (%)
Place of birth for the foreign-born population - Other South America (%)
Place of birth for the foreign-born population - Canada (%)
Place of birth for the foreign-born population - Other Northern America (%)
Place of birth for the foreign-born population - Other (%)
Latest news about races in Cranston, RI collected exclusively by city-data.com from local newspapers, TV, and radio stations
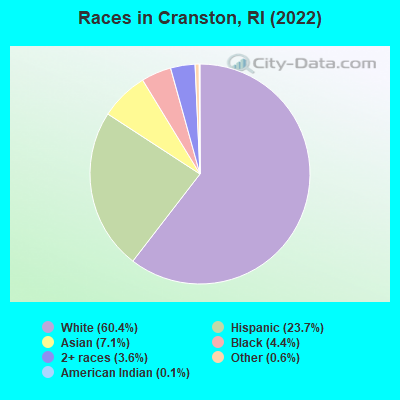
According to 2022 data, the most numerous races in Cranston, RI are White alone (49,823 residents), Hispanic (19,576 residents), and Two or more races (2,938 residents). 72.5% of Cranston residents speak English at home. 15.8% of Cranston, RI residents are foreign-born (6.6% born in Latin America, 4.9% born in Asia, 2.6% born in Europe), which is 11.3% greater than the foreign-born rate of 14.0% across the entire state of Rhode Island.
Race distribution in Cranston
2000 2022
858,433 81.9% White alone 90,820 8.7% Hispanic 41,922 4.0% Black alone 23,416 2.2% Asian alone 20,816 2.0% Two or more races 8,411 0.8% Other race alone 4,181 0.4% American Indian alone 320 0.03% Native Hawaiian and Other
745,825 68.2% White alone 191,979 17.6% Hispanic 56,738 5.2% Two or more races 51,326 4.7% Black alone 37,234 3.4% Asian alone 9,514 0.9% Other race alone 978 0.09% American Indian alone 140 0.01% Native Hawaiian and Other
Income and house value in Cranston Median household income in 2022 $80,256 White non-Hispanic householders$67,017 Black householders$123,034 Asian householders$69,705 Some other race householders$67,955 Two or more races householders$69,078 Hispanic or Latino race householdersMedian 2022 house value $366,882 White Non-Hispanic householders$316,298 Black or African American householders$343,971 American Indian or Alaska Native householders $349,922 Asian householders$349,922 Some other race householders$297,553 Two or more races householders$308,264 Hispanic or Latino householders
Median age by race in Cranston
47.8 Median age for White residents41.0 53.9 36.3 Median age for Black or African American residents36.1 41.7 37.6 Median age for American Indian / Alaska Native residents28.9 41.1 34.8 Median age for Asian residents37.6 30.7 -666,666,666.0 Median age for Native Hawaiian / Pacific Islander residents-666,666,666.0 -666,666,666.0 32.8 Median age for Other race residents32.4 40.0 28.9 Median age for Two or more races residents28.7 30.2 49.2 Median age for White alone residents40.8 54.6 29.7 Median age for Hispanic or Latino residents30.2 29.5
Owner/renter occupied households by race in Cranston
House owners and renters - White residents 16,818 67.0% Owner occupied8,266 33.0% Renter occupiedHouse owners and renters - Black or African American residents 362 35.3% Owner occupied663 64.7% Renter occupiedHouse owners and renters - American Indian / Alaska Native residents 52 47.9% Owner occupied57 52.1% Renter occupiedHouse owners and renters - Asian residents 842 58.6% Owner occupied594 41.4% Renter occupiedHouse owners and renters - Native Hawaiian / Pacific Islander residents 90 56.5% Owner occupied69 43.5% Renter occupiedHouse owners and renters - Other race residents 881 48.0% Owner occupied954 52.0% Renter occupiedHouse owners and renters - Two or more races residents 1,350 39.2% Owner occupied2,093 60.8% Renter occupiedHouse owners and renters - White alone residents 16,598 68.7% Owner occupied7,561 31.3% Renter occupiedHouse owners and renters - Hispanic or Latino residents 1,554 33.5% Owner occupied3,090 66.5% Renter occupied
Language usage in Cranston
English speakers - Total 72.5% of residents of Cranston speak English at home.
18.1% of residents speak Spanish at home 6,447 45.9% Speak English very well7,589 54.1% Speak English less than very well9.4% of residents speak other language at home 5,210 72.0% Speak English very well2,024 28.0% Speak English less than very well
English speakers - Born in the United States 83.2% of residents of Cranston speak English at home.
12.3% of residents speak Spanish at home 1,237 65.8% Speak English very well643 34.2% Speak English less than very well4.6% of residents speak other language at home 572 81.8% Speak English very well127 18.2% Speak English less than very well
English speakers - Native, born elsewhere 45.2% of residents of Cranston speak English at home.
52.5% of residents speak Spanish at home 531 53.9% Speak English very well455 46.1% Speak English less than very well2.3% of residents speak other language at home 43 100.0% Speak English very well
English speakers - Foreign-born 27.6% of residents of Cranston speak English at home.
41.1% of residents speak Spanish at home 822 15.2% Speak English very well4,601 84.8% Speak English less than very well31.3% of residents speak other language at home 2,719 65.9% Speak English very well1,409 34.1% Speak English less than very well
White (Caucasian) - Speak only English Native:
92.2% (43,910)Foreign-born:
23.7% (700)
White (Caucasian) - Speak another language Native:
7.8% (3,734)Foreign-born:
76.3% (2,258)
Black or African American - Speak only English Native:
86.3% (2,309)Foreign-born:
71.1% (654)
Black or African American - Speak another language Native:
13.7% (367)Foreign-born:
40.1% (369)
American Indian / Alaska Native - Speak only English Native:
67.4% (184)Foreign-born:
5.9% (12)
American Indian / Alaska Native - Speak another language Native:
32.8% (90)Foreign-born:
94.7% (184)
Asian - Speak only English Native:
55.6% (1,605)Foreign-born:
24.1% (689)
Asian - Speak another language Native:
44.4% (1,281)Foreign-born:
75.9% (2,170)
Other race - Speak only English Native:
31.4% (1,225)Foreign-born:
17.8% (298)
Other race - Speak another language Native:
68.6% (2,675)Foreign-born:
82.2% (1,378)
Two or more races - Speak only English Native:
51.1% (3,505)Foreign-born:
20.3% (943)
Two or more races - Speak another language Native:
48.9% (3,354)Foreign-born:
79.7% (3,698)
White alone - Speak only English Native:
96.0% (43,761)Foreign-born:
30.3% (700)
White alone - Speak another language Native:
4.0% (1,836)Foreign-born:
69.7% (1,610)
Hispanic or Latino - Speak only English Native:
26.8% (3,139)Foreign-born:
8.7% (538)
Hispanic or Latino - Speak another language Native:
73.2% (8,552)Foreign-born:
91.3% (5,645)
Foreign-born residents in Cranston 13,045 residents are foreign born (6.6% Latin America , 4.9% Asia , 2.6% Europe ).
This city:
15.8%Rhode Island:
14.4%
Marital status for residents in Cranston Marital status - White (Caucasian) population 15 years and over
Males 36.2% Never married48.3% Now married0.0% Separated2.2% Widowed13.3% DivorcedFemales 26.9% Never married42.7% Now married3.9% Separated10.1% Widowed16.3% DivorcedWomen who gave birth in the past 12 months Now married:
38.9% (169)Unmarried:
61.1% (266)
Women who did not give birth in the past 12 months Now married:
49.3% (4,440)Unmarried:
50.7% (4,558)
Marital status - Black or African American population 15 years and over
Males 52.8% Never married38.1% Now married1.3% Separated2.0% Widowed5.8% DivorcedFemales 48.5% Never married32.8% Now married2.8% Separated10.3% Widowed5.5% DivorcedWomen who gave birth in the past 12 months Now married:
100.0% (20)Unmarried:
0.0% (0)
Women who did not give birth in the past 12 months Now married:
35.9% (368)Unmarried:
64.1% (658)
Marital status - American Indian / Alaska Native population 15 years and over
Males 67.7% Never married32.3% Now married0.0% Separated0.0% Widowed0.0% DivorcedFemales 52.7% Never married18.6% Now married0.0% Separated0.0% Widowed28.7% DivorcedWomen who did not give birth in the past 12 months Now married:
6.8% (12)Unmarried:
93.2% (160)
Marital status - Asian population 15 years and over
Males 32.9% Never married51.7% Now married0.9% Separated10.7% Widowed3.8% DivorcedFemales 27.2% Never married62.6% Now married1.1% Separated5.9% Widowed3.2% DivorcedWomen who gave birth in the past 12 months Now married:
83.8% (89)Unmarried:
16.2% (17)
Women who did not give birth in the past 12 months Now married:
56.5% (905)Unmarried:
43.5% (696)
Marital status - Native Hawaiian / Pacific Islander population 15 years and over
Males 54.4% Never married37.7% Now married0.0% Separated7.9% Widowed0.0% DivorcedFemales 40.7% Never married17.3% Now married0.0% Separated0.0% Widowed42.0% DivorcedWomen who did not give birth in the past 12 months Now married:
29.8% (15)Unmarried:
70.2% (35)
Marital status - Other race population 15 years and over
Males 51.8% Never married33.8% Now married2.9% Separated0.0% Widowed11.5% DivorcedFemales 43.8% Never married37.6% Now married8.4% Separated3.9% Widowed6.3% DivorcedWomen who gave birth in the past 12 months Now married:
100.0% (22)Unmarried:
0.0% (0)
Women who did not give birth in the past 12 months Now married:
36.1% (421)Unmarried:
63.9% (745)
Marital status - Two or more races population 15 years and over
Males 56.4% Never married29.7% Now married7.0% Separated1.7% Widowed5.2% DivorcedFemales 51.8% Never married35.6% Now married4.5% Separated2.4% Widowed5.7% DivorcedWomen who gave birth in the past 12 months Now married:
20.0% (8)Unmarried:
80.0% (34)
Women who did not give birth in the past 12 months Now married:
28.3% (830)Unmarried:
71.7% (2,100)
Marital status - White alone, not Hispanic / Latino population 15 years and over
Males 36.3% Never married49.8% Now married0.0% Separated2.4% Widowed11.5% DivorcedFemales 26.2% Never married43.1% Now married4.0% Separated10.4% Widowed16.2% DivorcedWomen who gave birth in the past 12 months Now married:
38.9% (169)Unmarried:
61.1% (266)
Women who did not give birth in the past 12 months Now married:
49.4% (4,263)Unmarried:
50.6% (4,367)
Marital status - Hispanic or Latino population 15 years and over
Males 47.0% Never married31.9% Now married8.6% Separated2.1% Widowed10.4% DivorcedFemales 45.7% Never married38.4% Now married3.3% Separated5.1% Widowed7.5% DivorcedWomen who gave birth in the past 12 months Now married:
40.4% (20)Unmarried:
59.6% (29)
Women who did not give birth in the past 12 months Now married:
32.1% (1,271)Unmarried:
67.9% (2,693)
Ancestries in Cranston
11,639 25.8% Italian3,378 7.5% Irish2,370 5.3% American2,292 5.1% Portuguese2,065 4.6% English898 2.0% French894 2.0% French Canadian819 1.8% Nigerian803 1.8% German676 1.5% Greek567 1.3% Cape Verdean535 1.2% Polish504 1.1% Haitian341 0.8% Armenian225 0.5% Egyptian202 0.4% European188 0.4% Scottish159 0.4% Russian149 0.3% Lebanese126 0.3% Trinidadian and Tobagonian103 0.2% Swedish101 0.2% British86 0.2% Hungarian73 0.2% Ukrainian72 0.2% Eastern European59 0.1% Liberian58 0.1% Moroccan49 0.1% Jamaican46 0.1% Northern European46 0.1% Brazilian43 0.10% Norwegian41 0.09% Guyanese39 0.09% Lithuanian39 0.09% British West Indian33 0.07% Croatian26 0.06% African25 0.06% Canadian24 0.05% Senegalese23 0.05% Iraqi21 0.05% Scotch-Irish19 0.04% Icelander18 0.04% Latvian17 0.04% Romanian17 0.04% Scandinavian16 0.04% South African14 0.03% Arab11 0.02% Israeli11 0.02% Austrian10 0.02% Swiss8 0.02% Turkish7 0.02% Dutch7 0.02% Bulgarian3 0.01% Belgian
Geographical mobility in Cranston Same house 1 year ago 48,980 93.5% White (Caucasian)3,213 85.8% Black or African American369 86.0% American Indian / Alaska Native4,405 75.7% Asian185 89.1% Native Hawaiian / Pacific Islander5,181 89.9% Other race8,473 84.2% Two or more races46,001 93.3% White alone, not Hispanic / Latino13,811 89.4% Hispanic or LatinoMoved within same county 2,315 4.4% White / Caucasian213 5.7% Black or African American25 5.9% American Indian / Alaska Native382 6.6% Asian372 6.5% Other race1,217 12.1% Two or more races2,235 4.5% White alone, not Hispanic / Latino1,199 7.8% Hispanic or LatinoMoved within same state 541 1.0% White / Caucasian37 1.0% Black or African American26 5.9% American Indian / Alaska Native63 1.1% Asian10 4.8% Native Hawaiian / Pacific Islander12 0.2% Other race167 1.7% Two or more races485 1.0% White alone, not Hispanic / Latino267 1.7% Hispanic or LatinoMoved from different state 346 0.7% White / Caucasian212 5.7% Black or African American852 14.7% Asian15 7.1% Native Hawaiian / Pacific Islander143 2.5% Other race95 0.9% Two or more races346 0.7% White alone, not Hispanic / Latino188 1.2% Hispanic or LatinoMoved from abroad 229 0.4% White27 0.7% Black or African American12 2.7% American Indian / Alaska Native62 1.1% Asian7 0.1% Other race64 0.6% Two or more races229 0.5% White alone, not Hispanic / Latino9 0.1% Hispanic or Latino
Children Nativity (place of birth) in Cranston
Children under 6 years - Living with two parents Both parents native 2,046 99.9% Native2 0.1% Foreign-bornBoth parents foreign-born 473 93.2% Native34 6.8% Foreign-bornOne native, one foreign-born parent 981 100.0% NativeChildren under 6 years - Living with one parent Native parent 765 94.7% Native43 5.3% Foreign-bornForeign-born parent 666 100.0% NativeChildren 6 to 17 years - Living with two parents Both parents native 4,527 100.0% Native2 0.0% Foreign-bornBoth parents foreign-born 783 64.5% Native431 35.5% Foreign-bornOne native, one foreign-born parent 1,182 100.0% NativeChildren 6 to 17 years - Living with one parent Native parent 1,870 100.0% NativeForeign-born parent 1,219 62.5% Native731 37.5% Foreign-born
Place of birth for residents in Cranston 5,748 Americas5,554 Latin America4,115 Asia2,922 Caribbean2,219 Europe1,942 Central America1,894 South Eastern Asia1,440 Southern Europe1,166 Eastern Asia1,091 China856 Africa689 South America687 Western Africa620 South Central Asia485 Eastern Europe433 Western Asia193 Northern America168 Northern Europe126 Northern Africa112 Western Europe106 Oceania17 Middle Africa13 Australia and New Zealand Subregion11 Eastern Africa11 Southern Africa2,424 Dominican Republic1,737 Guatemala918 Portugal915 Philippines908 China560 India429 Nigeria395 Italy361 Cambodia291 Haiti284 Laos193 Canada180 Azores Islands159 Syria155 Hong Kong142 Trinidad and Tobago135 Thailand134 Vietnam133 Ecuador128 Peru126 El Salvador125 Greece120 Egypt109 Bolivia107 Iraq98 Cabo Verde97 Colombia95 Brazil87 Russia86 Armenia82 Liberia79 Belarus77 Germany77 Hungary73 Fiji67 Poland64 Argentina63 Korea63 United Kingdom50 Ivory Coast49 Guyana48 Lebanon45 England43 Ukraine41 Lithuania37 Cuba34 Mexico33 Scotland32 Malaysia31 France30 Indonesia27 Taiwan27 Honduras25 Senegal25 Sweden23 Israel23 Bangladesh21 Bulgaria21 Jamaica21 Latvia18 Uzbekistan17 Sri Lanka17 Romania14 Nicaragua13 Australia12 Japan11 South Africa10 Venezuela8 Turkey6 Morocco6 Zimbabwe5 Kenya4 Barbados3 Belgium2 Costa Rica
Grandparents responsible for own grandchildren in Cranston
Grandparents (30 to 59 years) White / Caucasian 68 47.4% Responsible for grandchildren75 52.6% Not responsible for grandchildrenBlack or African American 17 100.0% Responsible for grandchildrenAsian 22 28.2% Responsible for grandchildren57 71.8% Not responsible for grandchildrenTwo or more races 224 100.0% Not responsible for grandchildrenWhite alone, not Hispanic / Latino 69 43.8% Responsible for grandchildren89 56.2% Not responsible for grandchildrenHispanic or Latino 36 20.0% Responsible for grandchildren145 80.0% Not responsible for grandchildrenGrandparents (60 years and over) White / Caucasian 50 23.5% Responsible for grandchildren163 76.5% Not responsible for grandchildrenBlack or African American 96 77.5% Responsible for grandchildren28 22.5% Not responsible for grandchildrenAsian 12 15.8% Responsible for grandchildren63 84.2% Not responsible for grandchildrenTwo or more races 81 100.0% Not responsible for grandchildrenWhite alone, not Hispanic / Latino 50 22.6% Responsible for grandchildren172 77.4% Not responsible for grandchildrenHispanic or Latino 13 13.7% Responsible for grandchildren83 86.3% Not responsible for grandchildren