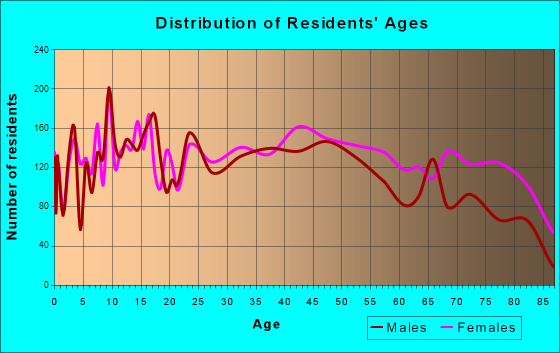
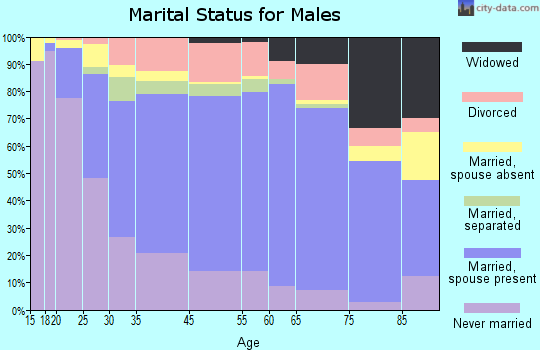
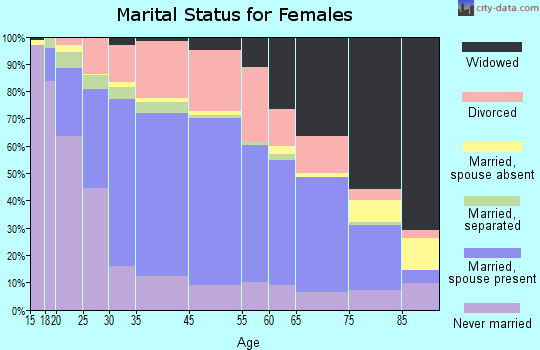
Cumberland, MD (Maryland) Houses and Residents
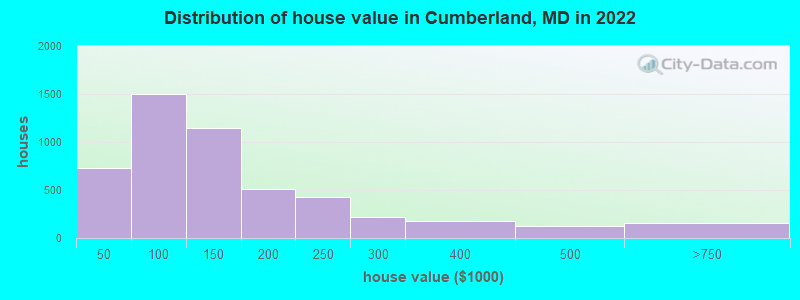
Estimated median house or condo value in 2022: $117,832 (it was $60,500 in 2000 )
Cumberland:
$117,832Maryland:
$398,100
Lower value quartile - upper value quartile: $79,112 - $205,318Total population: 20,235 (All urban)
Houses: 10,282 (8,304 occupied: 4,715 owner occupied, 3,258 renter occupied )
% of renters here:
41%State:
32%
Housing density: 1,134 houses/condos per square mile
Median price asked for vacant for-sale houses and condos in 2022: $453,462.
Median contract rent in 2022: $522 (lower quartile is $284, upper quartile is $670)
Median rent asked for vacant for-rent units in 2022: $1,590
Median gross rent in Cumberland, MD in 2022: $697
Housing units in Cumberland with a mortgage: 2,138 (253 second mortgage, 0 home equity loan, 198 both second mortgage and home equity loan )Houses without a mortgage: 145
Median household income for houses/condos with a mortgage: $90,857
Median household income for apartments without a mortgage: $44,420
Median monthly housing costs: $713
Data:
Median house or condo value ($)
Median house or condo value ($ change since 2000)
Median house or condo value ($) - White
Median house or condo value ($) - Black or African American
Median house or condo value ($) - Asian
Median house or condo value ($) - Hispanic or Latino
Median house or condo value ($) - American Indian and Alaska Native
Median house or condo value ($) - Multirace
Median house or condo value ($) - Other Race
Median price asked for mobile homes ($)
Household density (households per square mile)
Mean house or condo value by units in structure - 1, detached ($)
Mean house or condo value by units in structure - 1, attached ($)
Mean house or condo value by units in structure - 2 ($)
Mean house or condo value by units in structure by units in structure - 3 or 4 ($)
Mean house or condo value by units in structure - 5 or more ($)
Mean house or condo value by units in structure - Boat, RV, van, etc. ($)
Mean house or condo value by units in structure - Mobile home ($)
Median contract rent ($)
Median contract rent - Lower quartile ($)
Median contract rent - Upper quartile ($)
Median gross rent ($)
Urban houses (%)
Rural houses (%)
Houses occupied (%)
Houses occupied (% change since 2000)
Houses owner occupied (%)
Houses owner occupied (% change since 2000)
Houses renter occupied (%)
Houses renter occupied (% change since 2000)
Vacant housing units - For rent (%)
Vacant housing units - For rent (% change since 2000)
Vacant housing units - For sale only (%)
Vacant housing units - For sale only (% change since 2000)
Vacant housing units - Rented or sold, not occupied (%)
Vacant housing units - Rented or sold, not occupied (% change since 2000)
Vacant housing units - For seasonal, recreational, or occasional use (%)
Vacant housing units - For seasonal, recreational, or occasional use (% change since 2000)
Vacant housing units - For migrant workers (%)
Vacant housing units - For migrant workers (% change since 2000)
Vacant housing units - Other vacant (%)
Vacant housing units - Other vacant (% change since 2000)
Median monthly housing costs ($)
Median household income for houses/condos with a mortgage ($)
Median household income for houses/condos without a mortgage ($)
Median household income ($)
Median household income ($) - White
Median household income ($) - Black or African American
Median household income ($) - Asian
Median household income ($) - Hispanic or Latino
Median household income ($) - American Indian and Alaska Native
Median household income ($) - Multirace
Median household income ($) - Other Race
Mortgage status - with mortgage (%)
Mortgage status - with second mortgage (%)
Mortgage status - with home equity loan (%)
Mortgage status - with both second mortgage and home equity loan (%)
Mortgage status - without a mortgage (%)
Median year house/condo built
Median year apartment built
Household type by relationship - Male householder living alone (%)
Household type by relationship - Male householder not living alone (%)
Household type by relationship - Female householder living alone (%)
Household type by relationship - Female householder not living alone (%)
Household type by relationship - Opposite-Sex spouse (%)
Household type by relationship - Same-Sex spouse (%)
Household type by relationship - Opposite-Sex unmarried partner (%)
Household type by relationship - Same-Sex unmarried partner (%)
Household type by relationship - In group quarters (%)
Size of family households - 2-person household (%)
Size of family households - 3-person household (%)
Size of family households - 4-person household (%)
Size of family households - 5-person household (%)
Size of family households - 6-person household (%)
Size of family households - 7-or-more-person household (%)
Size of nonfamily households - 1-person household (%)
Size of nonfamily households - 2-person household (%)
Size of nonfamily households - 3-person household (%)
Size of nonfamily households - 4-person household (%)
Size of nonfamily households - 5-person household (%)
Size of nonfamily households - 6-person household (%)
Size of nonfamily households - 7-or-moreperson household (%)
Year house built - Built 2010 or later (%)
Year house built - Built 2000 to 2009 (%)
Year house built - Built 1990 to 1999 (%)
Year house built - Built 1980 to 1989 (%)
Year house built - Built 1970 to 1979 (%)
Year house built - Built 1960 to 1969 (%)
Year house built - Built 1950 to 1959 (%)
Year house built - Built 1940 to 1949 (%)
Year house built - Built 1939 or earlier (%)
Median number of rooms in houses and condos
Median number of rooms in apartments
Median number of bedrooms in owner occupied houses
Mean number of bedrooms in owner occupied houses
Median number of bedrooms in renter occupied houses
Mean number of bedrooms in renter occupied houses
Median number of vehichles in owner occupied houses
Mean number of vehichles in owner occupied houses
Median number of vehichles in renter occupied houses
Mean number of vehichles in renter occupied houses
Rooms in owner-occupied houses - 1 room (%)
Rooms in owner-occupied houses - 2 rooms (%)
Rooms in owner-occupied houses - 3 rooms (%)
Rooms in owner-occupied houses - 4 rooms (%)
Rooms in owner-occupied houses - 5 rooms (%)
Rooms in owner-occupied houses - 6 rooms (%)
Rooms in owner-occupied houses - 7 rooms (%)
Rooms in owner-occupied houses - 8 rooms (%)
Rooms in owner-occupied houses - 9+ rooms (%)
Rooms in renter-occupied houses - 1 room (%)
Rooms in renter-occupied houses - 2 rooms (%)
Rooms in renter-occupied houses - 3 rooms (%)
Rooms in renter-occupied houses - 4 rooms (%)
Rooms in renter-occupied houses - 5 rooms (%)
Rooms in renter-occupied houses - 6 rooms (%)
Rooms in renter-occupied houses - 7 rooms (%)
Rooms in renter-occupied houses - 8 rooms (%)
Rooms in renter-occupied houses - 9+ rooms (%)
Bedrooms in owner-occupied houses - no bedrooms (%)
Bedrooms in owner-occupied houses - 1 bedroom (%)
Bedrooms in owner-occupied houses - 2 bedrooms (%)
Bedrooms in owner-occupied houses - 3 bedrooms (%)
Bedrooms in owner-occupied houses - 4 bedrooms (%)
Bedrooms in owner-occupied houses - 5+ bedrooms (%)
Bedrooms in renter-occupied houses - no bedrooms (%)
Bedrooms in renter-occupied houses - 1 bedroom (%)
Bedrooms in renter-occupied houses - 2 bedrooms (%)
Bedrooms in renter-occupied houses - 3 bedrooms (%)
Bedrooms in renter-occupied houses - 4 bedrooms (%)
Bedrooms in renter-occupied houses - 5+ bedrooms (%)
Vehicles available in owner-occupied houses - no vehicle available (%)
Vehicles available in owner-occupied houses - 1 vehicle available(%)
Vehicles available in owner-occupied houses - 2 Vehicles available (%)
Vehicles available in owner-occupied houses - 3 Vehicles available (%)
Vehicles available in owner-occupied houses - 4 Vehicles available (%)
Vehicles available in owner-occupied houses - 5+ Vehicles available (%)
Vehicles available in renter-occupied houses - no vehicle available (%)
Vehicles available in renter-occupied houses - 1 vehicle available (%)
Vehicles available in renter-occupied houses - 2 Vehicles available (%)
Vehicles available in renter-occupied houses - 3 Vehicles available (%)
Vehicles available in renter-occupied houses - 4 Vehicles available (%)
Vehicles available in renter-occupied houses - 5+ Vehicles available (%)
Housing units in structures - 1, detached (%)
Housing units in structures - 1, attached (%)
Housing units in structures - 2 (%)
Housing units in structures - 3 or 4 (%)
Housing units in structures - 5 to 9 (%)
Housing units in structures - 10 to 19 (%)
Housing units in structures - 20 to 49 (%)
Housing units in structures - 50 or more (%)
Housing units in structures - Mobile home (%)
Housing units in structures - Boat, RV, van, etc. (%)
Housing units in structures - Owners - 1, detached (%)
Housing units in structures - Owners - 1, attached (%)
Housing units in structures - Owners - 2 (%)
Housing units in structures - Owners - 3 or 4 (%)
Housing units in structures - Owners - 5 to 9 (%)
Housing units in structures - Owners - 10 to 19 (%)
Housing units in structures - Owners - 20 to 49 (%)
Housing units in structures - Owners - 50 or more (%)
Housing units in structures - Owners - Mobile home (%)
Housing units in structures - Owners - Boat, RV, van, etc. (%)
Housing units in structures - Renters - 1, detached (%)
Housing units in structures - Renters - 1, attached (%)
Housing units in structures - Renters - 2 (%)
Housing units in structures - Renters - 3 or 4 (%)
Housing units in structures - Renters - 5 to 9 (%)
Housing units in structures - Renters - 10 to 19 (%)
Housing units in structures - Renters - 20 to 49 (%)
Housing units in structures - Renters - 50 or more (%)
Housing units in structures - Renters - Mobile home (%)
Housing units in structures - Renters - Boat, RV, van, etc. (%)
House/condo owner moved in on average (years ago)
Renter moved in on average (years ago)
Year householder moved into unit - Moved in 1999 to March 2000 (%)
Year householder moved into unit - Moved in 1999 to March 2000 (%) - White
Year householder moved into unit - Moved in 1999 to March 2000 (%) - Black or African American
Year householder moved into unit - Moved in 1999 to March 2000 (%) - Asian
Year householder moved into unit - Moved in 1999 to March 2000 (%) - Hispanic or Latino
Year householder moved into unit - Moved in 1999 to March 2000 (%) - American Indian and Alaska Native
Year householder moved into unit - Moved in 1999 to March 2000 (%) - Multirace
Year householder moved into unit - Moved in 1999 to March 2000 (%) - Other Race
Year householder moved into unit - Moved in 1995 to 1998 (%)
Year householder moved into unit - Moved in 1995 to 1998 (%) - White
Year householder moved into unit - Moved in 1995 to 1998 (%) - Black or African American
Year householder moved into unit - Moved in 1995 to 1998 (%) - Asian
Year householder moved into unit - Moved in 1995 to 1998 (%) - Hispanic or Latino
Year householder moved into unit - Moved in 1995 to 1998 (%) - American Indian and Alaska Native
Year householder moved into unit - Moved in 1995 to 1998 (%) - Multirace
Year householder moved into unit - Moved in 1995 to 1998 (%) - Other Race
Year householder moved into unit - Moved in 1990 to 1994 (%)
Year householder moved into unit - Moved in 1990 to 1994 (%) - White
Year householder moved into unit - Moved in 1990 to 1994 (%) - Black or African American
Year householder moved into unit - Moved in 1990 to 1994 (%) - Asian
Year householder moved into unit - Moved in 1990 to 1994 (%) - Hispanic or Latino
Year householder moved into unit - Moved in 1990 to 1994 (%) - American Indian and Alaska Native
Year householder moved into unit - Moved in 1990 to 1994 (%) - Multirace
Year householder moved into unit - Moved in 1990 to 1994 (%) - Other Race
Year householder moved into unit - Moved in 1980 to 1989 (%)
Year householder moved into unit - Moved in 1980 to 1989 (%) - White
Year householder moved into unit - Moved in 1980 to 1989 (%) - Black or African American
Year householder moved into unit - Moved in 1980 to 1989 (%) - Asian
Year householder moved into unit - Moved in 1980 to 1989 (%) - Hispanic or Latino
Year householder moved into unit - Moved in 1980 to 1989 (%) - American Indian and Alaska Native
Year householder moved into unit - Moved in 1980 to 1989 (%) - Multirace
Year householder moved into unit - Moved in 1980 to 1989 (%) - Other Race
Year householder moved into unit - Moved in 1970 to 1979 (%)
Year householder moved into unit - Moved in 1970 to 1979 (%) - White
Year householder moved into unit - Moved in 1970 to 1979 (%) - Black or African American
Year householder moved into unit - Moved in 1970 to 1979 (%) - Asian
Year householder moved into unit - Moved in 1970 to 1979 (%) - Hispanic or Latino
Year householder moved into unit - Moved in 1970 to 1979 (%) - American Indian and Alaska Native
Year householder moved into unit - Moved in 1970 to 1979 (%) - Multirace
Year householder moved into unit - Moved in 1970 to 1979 (%) - Other Race
Year householder moved into unit - Moved in 1969 or earlier (%)
Year householder moved into unit - Moved in 1969 or earlier (%) - White
Year householder moved into unit - Moved in 1969 or earlier (%) - Black or African American
Year householder moved into unit - Moved in 1969 or earlier (%) - Asian
Year householder moved into unit - Moved in 1969 or earlier (%) - Hispanic or Latino
Year householder moved into unit - Moved in 1969 or earlier (%) - American Indian and Alaska Native
Year householder moved into unit - Moved in 1969 or earlier (%) - Multirace
Year householder moved into unit - Moved in 1969 or earlier (%) - Other Race
Housing units lacking complete plumbing facilities (%)
Housing units lacking complete kitchen facilities (%)
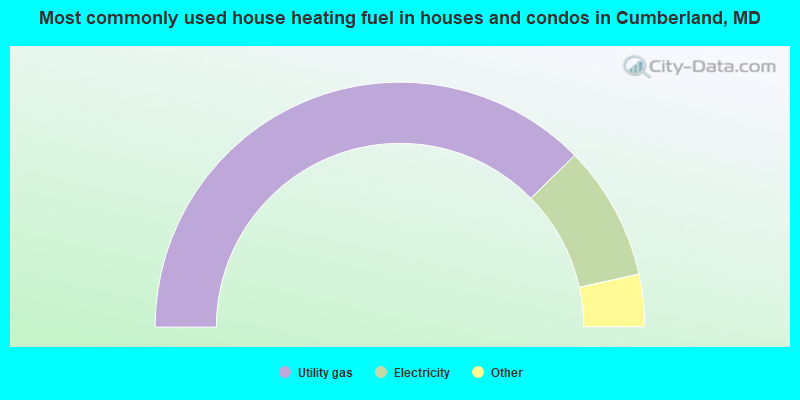
House heating fuel used in houses and condos - Utility gas (%)
House heating fuel used in houses and condos - Bottled, tank, or LP gas (%)
House heating fuel used in houses and condos - Electricity (%)
House heating fuel used in houses and condos - Fuel oil, kerosene, etc. (%)
House heating fuel used in houses and condos - Coal or coke (%)
House heating fuel used in houses and condos - Wood (%)
House heating fuel used in houses and condos - Solar energy (%)
House heating fuel used in houses and condos - Other fuel (%)
House heating fuel used in houses and condos - No fuel used (%)
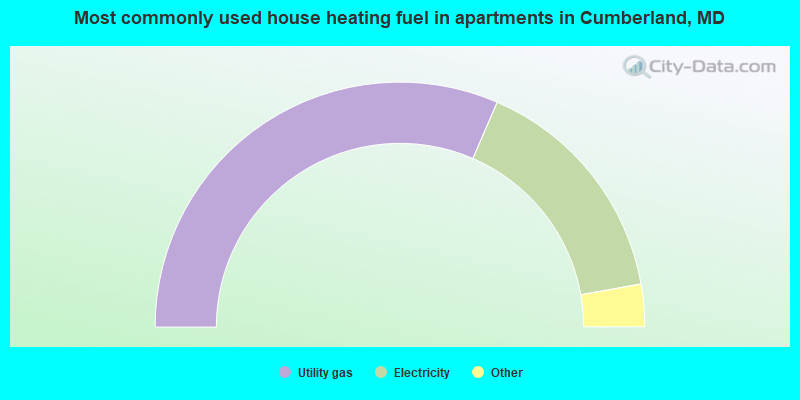
House heating fuel used in apartments - Utility gas (%)
House heating fuel used in apartments - Bottled, tank, or LP gas (%)
House heating fuel used in apartments - Electricity (%)
House heating fuel used in apartments - Fuel oil, kerosene, etc. (%)
House heating fuel used in apartments - Coal or coke (%)
House heating fuel used in apartments - Wood (%)
House heating fuel used in apartments - Solar energy (%)
House heating fuel used in apartments - Other fuel (%)
House heating fuel used in apartments - No fuel used (%)
Latest news about housing in Cumberland, MD collected exclusively by city-data.com from local newspapers, TV, and radio stations
Median year house/condo built: 1944Median year apartment built: 1949Household type by relationship:
Households: 18,791
Male householders: 3,833 (1,626 living alone ), Female householders: 4,400 (1,824 living alone )2,744 spouses (2,714 opposite-sex spouses ), 653 unmarried partners , (627 opposite-sex unmarried partners ), 5,079 children (4,711 natural , 97 adopted , 270 stepchildren ), 184 grandchildren , 48 brothers or sisters , 92 parents , 0 foster children , 124 other relatives , 498 non-relatives In group quarters: 1,131
Size of family households: 1,839 2-persons , 742 3-persons , 904 4-persons , 294 5-persons , 142 6-persons , 40 7-or-more-persons .
Size of nonfamily households: 3,663 1-person , 307 2-persons , 101 3-persons , 4 4-persons , 6 5-persons , 3 7-or-more-persons .
1,890 married couples with children. single-parent households (520 men , 908 women ).
95.4% of residents of Cumberland speak English at home. of residents speak Spanish at home (78% speak English very well , 10% speak English well , 11% don't speak English at all ).of residents speak other Indo-European language at home (86% speak English very well , 5% speak English well , 4% speak English not well , 5% don't speak English at all ).of residents speak Asian or Pacific Island language at home (100% speak English very well ).of residents speak other language at home (60% speak English very well , 40% speak English well ).
Foreign born population: 386 (2.1%)of them are naturalized citizens )
Median number of rooms in houses and condos:
Median number of rooms in apartments
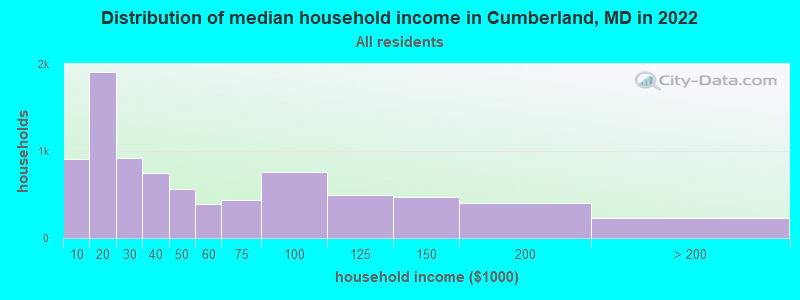
Cumberland, MD household income distribution 910 Less than $10,0001,904 $10,000 to $19,999923 $20,000 to $29,999742 $30,000 to $39,999558 $40,000 to $49,999396 $50,000 to $59,999441 $60,000 to $74,999761 $75,000 to $99,999491 $100,000 to $124,999469 $125,000 to $149,999404 $150,000 to $199,999234 $200,000 or more
Home value of owner - occupied houses in 2022 in Cumberland, MD 107 Less than $10,00091 $10,000 to $14,99988 $15,000 to $19,99952 $20,000 to $24,999123 $25,000 to $29,99988 $30,000 to $34,99928 $35,000 to $39,999146 $40,000 to $49,999245 $50,000 to $59,999105 $60,000 to $69,999135 $70,000 to $79,999549 $80,000 to $89,999321 $90,000 to $99,999781 $100,000 to $124,999363 $125,000 to $149,999232 $150,000 to $174,999277 $175,000 to $199,999426 $200,000 to $249,999218 $250,000 to $299,999175 $300,000 to $399,999128 $400,000 to $499,999142 $500,000 to $749,99910 $750,000 to $999,999Rent paid by renters in 2022 in Cumberland, MD 296 Less than $1006 $100 to $14963 $150 to $199214 $200 to $249168 $250 to $299209 $300 to $349135 $350 to $399210 $400 to $449107 $450 to $499201 $500 to $549364 $550 to $599161 $600 to $649260 $650 to $699100 $700 to $749151 $750 to $799196 $800 to $899250 $900 to $99963 $1,000 to $1,24968 $1,250 to $1,49941 $1,500 to $1,9993 $3,000 to $3,499339 No cash rent
Percentage of workers working in this county: 93.7%Number of people working at home: 671 (9.3% of all workers )
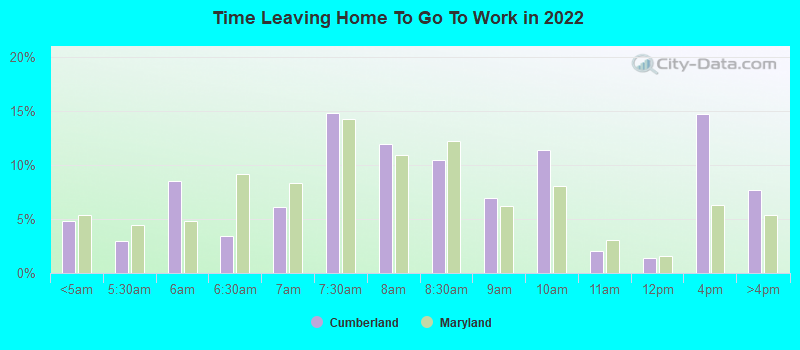
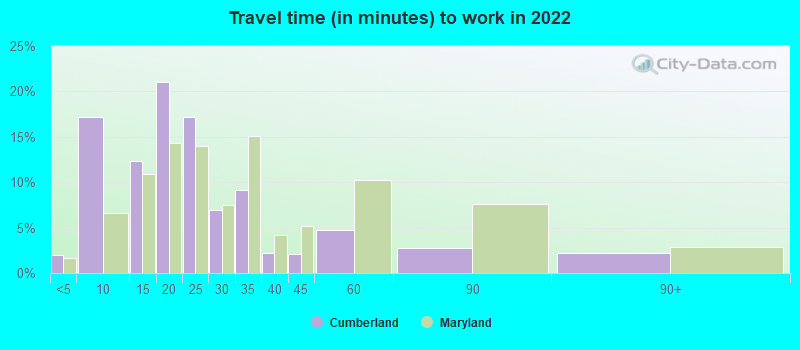
Travel time to work (commute)
Less than 5 minutes: 1755 to 9 minutes: 2,16810 to 14 minutes: 1,17415 to 19 minutes: 1,38420 to 24 minutes: 48425 to 29 minutes: 20030 to 34 minutes: 18435 to 39 minutes: 1340 to 44 minutes: 11145 to 59 minutes: 19060 to 89 minutes: 15790 or more minutes: 135
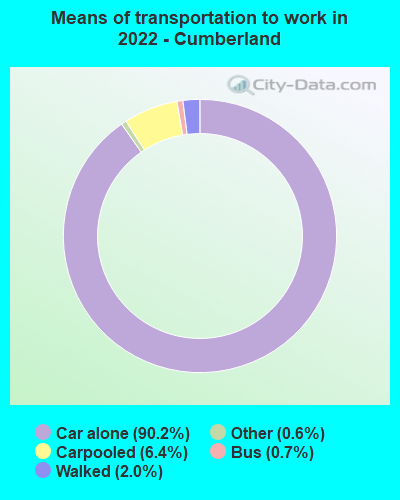
Means of transportation to work:
Drove a car alone: 9,543 (81.6%)Carpooled: 718 (6.1%)Bus : 60 (0.5%)Long-distance train or commuter rail : 1 (0.0%)Taxi: 76 (0.6%)Walked: 202 (1.7%)Worked at home: 671 (5.7%)
Unemployment by race in 2022
Unemployment rate for White non-Hispanic residents 12.3% Males5.0% FemalesUnemployment rate for Black residents 10.2% Males11.0% FemalesUnemployment rate for Asian residents 16.5% FemalesUnemployment rate for two or more race residents 10.1% Males23.5% Females
Year of entry for the foreign-born population in Cumberland, Maryland
4 2010 or later 144 2000 to 2009 80 1990 to 1999 61 1980 to 1989 50 1970 to 1979 95 Before 1970
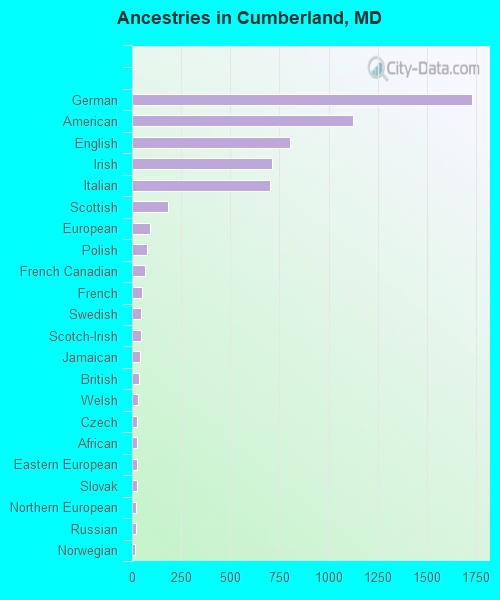
First ancestries reported:
German: 1,730 (22.5%)
American: 1,124 (14.6%)
English: 803 (10.4%)
Irish: 710 (9.2%)
Italian: 702 (9.1%)
Scottish: 184 (2.4%)
European: 93 (1.2%)
Polish: 77 (1.0%)
French Canadian: 68 (0.9%)
French: 49 (0.6%)
Swedish: 47 (0.6%)
Scotch-Irish: 45 (0.6%)
Jamaican: 39 (0.5%)
British: 34 (0.4%)
Welsh: 31 (0.4%)
Czech: 27 (0.4%)
African: 24 (0.3%)
Eastern European: 23 (0.3%)
Slovak: 23 (0.3%)
Northern European: 20 (0.3%)
Russian: 18 (0.2%)
Norwegian: 16 (0.2%)
Yugoslavian: 13 (0.2%)
Danish: 12 (0.2%)
Greek: 11 (0.1%)
West Indian: 9 (0.1%)
Canadian: 7 (0.09%)
Croatian: 7 (0.09%)
Iranian: 6 (0.08%)
Trinidadian and Tobagonian: 6 (0.08%)
Austrian: 5 (0.06%)
Scandinavian: 5 (0.06%)
Dutch: 3 (0.04%)
Belizean: 1 (0.01%) Most common places of birth for foreign-born residents (%): Germany Cumberland:
16.9% (68)Maryland:
1.2% (11,265)
Pakistan Cumberland:
15.1% (61)Maryland:
1.8% (17,037)
China, excluding Hong Kong and Taiwan Cumberland:
9.7% (39)Maryland:
4.6% (44,742)
Venezuela Cumberland:
7.9% (32)Maryland:
0.5% (4,901)
Bosnia and Herzegovina Cumberland:
6.5% (26)Maryland:
0.1% (590)
Brazil Cumberland:
5.2% (21)Maryland:
1.2% (11,980)
Belize Cumberland:
4.5% (18)Maryland:
0.0% (476)
Jamaica Cumberland:
4.2% (17)Maryland:
2.8% (27,444)
Trinidad and Tobago Cumberland:
3.5% (14)Maryland:
1.2% (11,481)
Portugal Cumberland:
2.7% (11)Maryland:
0.1% (1,431)
India Cumberland:
2.7% (11)Maryland:
6.4% (61,725)
France Cumberland:
2.7% (11)Maryland:
0.4% (4,217)
Russia Cumberland:
2.7% (11)Maryland:
1.0% (9,481)
Scotland Cumberland:
2.0% (8)Maryland:
0.1% (738)
Place of birth for U.S.-born residents:
This state: 14,181Other state: 4,157Northeast: 1,436Midwest: 568South: 1,929West: 205 87.7% of Cumberland residents lived in the same house 1 years ago.
Out of people who lived in different houses, 33.6% lived in this county.
Out of people who lived in different counties, 48.9% lived in Maryland.
Cumberland:
87.7%State average:
88.5%
Education attainment for males 25 years and older:
No schooling: 52Nursery to 4th grade: 05th and 6th grade: 867th and 8th grade: 639th grade: 4710th grade: 11111th grade: 11112th grade, no diploma: 71High school graduate (or equivalency): 2,143Less than 1 year of college: 524Some college more than 1 year, no degree: 766Associate degree: 506Bachelor's degree: 974Master's degree: 224Professional school degree: 217Doctorate degree: 161
Education attainment for females 25 years and older:
No schooling: 80Nursery to 4th grade: 05th and 6th grade: 217th and 8th grade: 1209th grade: 5410th grade: 10311th grade: 17612th grade, no diploma: 54High school graduate (or equivalency): 2,442Less than 1 year of college: 528Some college more than 1 year, no degree: 1,030Associate degree: 665Bachelor's degree: 601Master's degree: 863Professional school degree: 30Doctorate degree: 72
Housing units in structures:
One, detached: 5,959One, attached: 1,287Two: 8343 or 4: 4615 to 9: 64110 to 19: 13520 to 49: 18250 or more: 749Mobile homes: 31Housing units lacking complete plumbing facilities in 2022: 7.0%Housing units lacking complete kitchen facilities in 2022: 8.2%House/condo owner moved in on average 15 years ago
Renter moved in on average 7 years ago
Private vs. public school enrollment:
Students in private schools in grades 1 to 8 (elementary and middle school): 377 Students in private schools in grades 9 to 12 (high school): 132 Students in private undergraduate colleges: 4