Delta, CA (California) Houses and Residents
| Delta: | $480,316 |
| California: | $715,900 |
Total population: 5,393 (Urban population: 0, Rural population: 4,830 (483 farm, 4,347 nonfarm))
Houses: 2,307 (1,887 occupied: 1,209 owner occupied, 678 renter occupied)
| % of renters here: | 36% |
| State: | 44% |
Housing density: 21 houses/condos per square mile
Median price asked for vacant for-sale houses and condos in 2022 in this county: $283,040.
Median contract rent in 2022: $1,200 (lower quartile is $935, upper quartile is $1,685)
Median rent asked for vacant for-rent units in 2022: $1,081
Median gross rent in Delta, CA in 2022: $1,436
Housing units in Delta with a mortgage: 343 (17 second mortgage, 45 home equity loan, 0 both second mortgage and home equity loan)
Houses without a mortgage: 322
Compare current foreclosures near Delta, CA:
| Photo | Address | Area | Beds / Baths | Price | Details |
|---|---|---|---|---|---|

|
#1
Doyle Rd
Oakley, CA 94561
|
2,067 sq. feet
|
2 baths 4 beds |
show details | |

|
#2
Riverwood Ln
Rio Vista, CA 94571
|
1,391 sq. feet
|
2 baths 2 beds |
show details | |

|
#3
Rutledge Dr
Lodi, CA 95242
|
1,104 sq. feet
|
2 baths 3 beds |
show details | |

|
#4
Creek Trail Cir
Stockton, CA 95209
|
2,135 sq. feet
|
3 baths 5 beds |
show details | |

|
#5
Sonora Ct
Oakley, CA 94561
|
3,852 sq. feet
|
3 baths 5 beds |
show details | |

|
#6
Mcfarland St
Galt, CA 95632
|
1,452 sq. feet
|
2 baths 3 beds |
show details | |

|
#7
Raycroft Way
Elk Grove, CA 95757
|
3,565 sq. feet
|
4 baths 5 beds |
show details | |

|
#8
W Brannan Island Rd
Isleton, CA 95641
|
- sq. feet
|
2 baths 3 beds |
show details | |

|
#9
Macabee Ln
Elk Grove, CA 95757
|
1,578 sq. feet
|
3 baths 3 beds |
show details | |

|
#10
Filbert St
Antioch, CA 94509
|
1,137 sq. feet
|
2 baths 3 beds |
show details |
| Photo | Address | Area | Beds / Baths | Price | Details |
|---|---|---|---|---|---|

|
#11
N Ham Ln
Lodi, CA 95242
|
1,767 sq. feet
|
3 baths 3 beds |
show details | |

|
#12
Pendleton Ct
Oakley, CA 94561
|
3,075 sq. feet
|
3 baths 5 beds |
show details | |

|
#13
Poplar Dr
Oakley, CA 94561
|
3,341 sq. feet
|
3 baths 4 beds |
show details | |

|
#14
N 4th St
Rio Vista, CA 94571
|
1,271 sq. feet
|
1 baths 2 beds |
show details | |

|
#15
De Flores Cir
Rio Vista, CA 94571
|
1,617 sq. feet
|
2 baths 4 beds |
show details | |

|
#16
Brockton Pl
Rio Vista, CA 94571
|
1,767 sq. feet
|
2 baths 2 beds |
show details | |

|
#17
Drake Ct
Oakley, CA 94561
|
1,164 sq. feet
|
2 baths 3 beds |
show details | |

|
#18
E Forest Lake Rd
Acampo, CA 95220
|
1,666 sq. feet
|
2 baths 3 beds |
show details | |

|
#19
Chablis Way
Oakley, CA 94561
|
1,370 sq. feet
|
2 baths 4 beds |
show details | |

|
#20
Mariners Dr Apt 53
Stockton, CA 95219
|
815 sq. feet
|
1 baths 2 beds |
show details |
| Photo | Address | Area | Beds / Baths | Price | Details |
|---|---|---|---|---|---|

|
#21
Iris Meadow Way
Elk Grove, CA 95757
|
2,600 sq. feet
|
3 baths 5 beds |
show details | |

|
#22
Birdview Way
Elk Grove, CA 95757
|
1,189 sq. feet
|
2 baths 3 beds |
show details | |

|
#23
Teton Ct
Stockton, CA 95209
|
2,707 sq. feet
|
3 baths 4 beds |
show details | |

|
#24
Joshua Tree Cir
Stockton, CA 95209
|
2,590 sq. feet
|
3 baths 7 beds |
show details | |

|
#25
Mystic Ct
Stockton, CA 95209
|
1,711 sq. feet
|
2 baths 3 beds |
show details | |

|
#26
Bright Star Pl
Stockton, CA 95209
|
2,503 sq. feet
|
3 baths 5 beds |
show details | |

|
#27
Morning Glory Ct
Oakley, CA 94561
|
3,340 sq. feet
|
3 baths 5 beds |
show details | |

|
#28
Mehaffey Way
Oakley, CA 94561
|
1,180 sq. feet
|
2 baths 3 beds |
show details | |

|
#29
Holly Dr
Oakley, CA 94561
|
1,767 sq. feet
|
2 baths 4 beds |
show details | |

|
#30
Edgewood Dr
Lodi, CA 95240
|
2,901 sq. feet
|
3 baths 5 beds |
show details |
| Photo | Address | Area | Beds / Baths | Price | Details |
|---|---|---|---|---|---|

|
#31
Autumn Oak Pl
Stockton, CA 95209
|
2,687 sq. feet
|
3 baths 4 beds |
show details | |

|
#32
Cloverbrook Ave
Oakley, CA 94561
|
1,485 sq. feet
|
2 baths 4 beds |
show details | |

|
#33
Douglas Rd
Oakley, CA 94561
|
2,190 sq. feet
|
2 baths 3 beds |
show details | |

|
#34
Sherry Cir
Oakley, CA 94561
|
1,189 sq. feet
|
2 baths 3 beds |
show details | |

|
#35
Leonardo Way
Elk Grove, CA 95757
|
1,878 sq. feet
|
2 baths 4 beds |
show details | |

|
#36
E Barron Rd
Acampo, CA 95220
|
1,817 sq. feet
|
2 baths 3 beds |
show details | |

|
#37
N Extension Rd
Lodi, CA 95242
|
1,419 sq. feet
|
1 baths 3 beds |
show details | |

|
#38
Mildred Ave
Galt, CA 95632
|
2,051 sq. feet
|
2 baths 4 beds |
show details | |

|
#39
Lassen Way
Oakley, CA 94561
|
2,561 sq. feet
|
3 baths 4 beds |
show details | |

|
#40
Brian Kelly Way
Elk Grove, CA 95757
|
2,592 sq. feet
|
3 baths 5 beds |
show details |
| Photo | Address | Area | Beds / Baths | Price | Details |
|---|---|---|---|---|---|

|
#41
Ocean Ln
Elk Grove, CA 95757
|
1,711 sq. feet
|
2 baths 3 beds |
show details | |

|
#42
Macabee Ln
Elk Grove, CA 95757
|
2,403 sq. feet
|
3 baths 4 beds |
show details | |

|
#43
Spindrift Way
Stockton, CA 95209
|
2,161 sq. feet
|
2 baths 4 beds |
show details | |

|
#44
G St
Galt, CA 95632
|
1,478 sq. feet
|
2 baths 3 beds |
show details | |

|
#45
Serta Ct
Elk Grove, CA 95757
|
3,743 sq. feet
|
3 baths 4 beds |
show details | |

|
#46
Jefjen Way
Elk Grove, CA 95757
|
3,199 sq. feet
|
3 baths 5 beds |
show details | |

|
#47
Jefjen Way
Elk Grove, CA 95757
|
3,199 sq. feet
|
3 baths 5 beds |
show details | |

|
#48
Autumn Sage Way
Elk Grove, CA 95757
|
2,300 sq. feet
|
3 baths 5 beds |
show details | |

|
#49
Monique Ct
Oakley, CA 94561
|
1,431 sq. feet
|
2 baths 4 beds |
show details | |

|
Check over 1 million property listings on Foreclosure.com!
|
browse all offers | |||

Household type by relationship:
Households: 1,395,001- In family households: 1,165,433 (218,864 male householders, 120,118 female householders)
231,820 spouses, 433,388 children (406,526 natural, 9,048 adopted, 17,814 stepchildren), 33,153 grandchildren, 22,452 brothers or sisters, 21,191 parents, foster children, 28,399 other relatives, 42,872 non-relatives
- In nonfamily households: 229,568 (79,565 male householders (57,076 living alone)), 95,398 female householders (76,350 living alone)), 54,605 nonrelatives
- In group quarters: 23,787 (15,337 institutionalized population)
206,827 married couples with children.
90,931 single-parent households (20,302 men, 70,629 women).
66.5% of residents of Delta speak English at home.
26.1% of residents speak Spanish at home (42% speak English very well, 15% speak English well, 22% speak English not well, 22% don't speak English at all).
2.6% of residents speak other Indo-European language at home (68% speak English very well, 19% speak English well, 13% speak English not well).
4.8% of residents speak Asian or Pacific Island language at home (53% speak English very well, 24% speak English well, 13% speak English not well, 11% don't speak English at all).
Foreign born population: 1,687 (27.0%)
(39.5% of them are naturalized citizens)
| Here: | 5.1 |
| State: | 6.0 |
| Here: | 4.1 |
| State: | 3.9 |
- Bedrooms in owner-occupied houses and condos in Delta, California
- 29no bedroom
- 2211 bedroom
- 3612 bedrooms
- 4203 bedrooms
- 1414 bedrooms
- 375+ bedrooms
- Bedrooms in renter-occupied apartments in Delta, California
- 57no bedroom
- 1941 bedroom
- 2602 bedrooms
- 1483 bedrooms
- 194 bedrooms
- 05+ bedrooms
- Cars and other vehicles available in Delta in owner-occupied houses/condos
- 62no vehicle
- 4201 vehicle
- 4732 vehicles
- 1563 vehicles
- 394 vehicles
- 595+ vehicles
- Cars and other vehicles available in Delta in renter-occupied apartments
- 48no vehicle
- 2551 vehicle
- 2792 vehicles
- 803 vehicles
- 34 vehicles
- 135+ vehicles
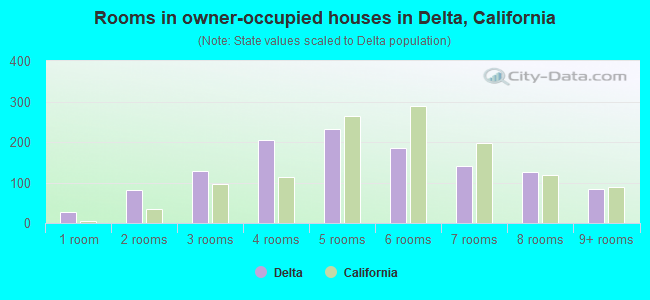
- Rooms in owner-occupied houses in Delta, California
- 271 room
- 812 rooms
- 1293 rooms
- 2054 rooms
- 2335 rooms
- 1856 rooms
- 1417 rooms
- 1258 rooms
- 839+ rooms
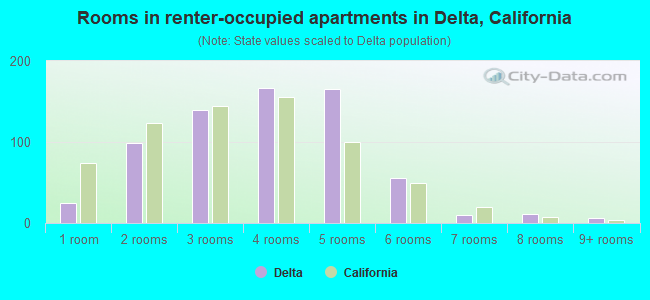
- Rooms in renter-occupied apartments in Delta, California
- 251 room
- 992 rooms
- 1403 rooms
- 1674 rooms
- 1655 rooms
- 556 rooms
- 107 rooms
- 118 rooms
- 69+ rooms
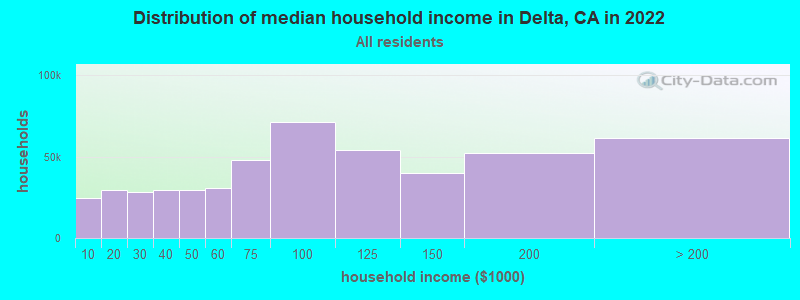
Delta, CA household income distribution

- 24,497Less than $10,000
- 29,626$10,000 to $19,999
- 28,365$20,000 to $29,999
- 29,198$30,000 to $39,999
- 29,214$40,000 to $49,999
- 30,752$50,000 to $59,999
- 47,719$60,000 to $74,999
- 71,201$75,000 to $99,999
- 54,176$100,000 to $124,999
- 39,645$125,000 to $149,999
- 52,287$150,000 to $199,999
- 61,676$200,000 or more
Percentage of workers working in this county: 59.3%
Number of people working at home: 566 (19.4% of all workers)
Travel time to work (commute)
- Less than 5 minutes: 203
- 5 to 9 minutes: 199
- 10 to 14 minutes: 292
- 15 to 19 minutes: 274
- 20 to 24 minutes: 146
- 25 to 29 minutes: 81
- 30 to 34 minutes: 165
- 35 to 39 minutes: 76
- 40 to 44 minutes: 56
- 45 to 59 minutes: 257
- 60 to 89 minutes: 144
- 90 or more minutes: 94
Means of transportation to work:
- Drove a car alone: 1,455 (69.3%)
- Carpooled: 341 (16.2%)
- Bicycle: 7 (0.3%)
- Walked: 145 (6.9%)
- Other means: 39 (1.9%)
- Worked at home: 113 (5.4%)
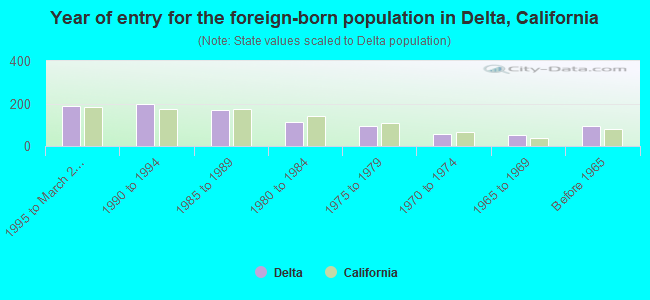
- Year of entry for the foreign-born population in Delta, California
- 1891995 to March 2000
- 1971990 to 1994
- 1701985 to 1989
- 1141980 to 1984
- 921975 to 1979
- 551970 to 1974
- 541965 to 1969
- 95Before 1965
Most common places of birth for foreign-born residents (%):
| Delta: | 81.8% (790) |
| California: | 44.3% (3,928,701) |
| Delta: | 9.7% (94) |
| California: | 7.5% (664,935) |
| Delta: | 3.3% (32) |
| California: | 3.7% (327,611) |
Place of birth for U.S.-born residents:
- This state: 2,708
- Other state: 1,124
- Northeast: 138
- Midwest: 394
- South: 303
- West: 289
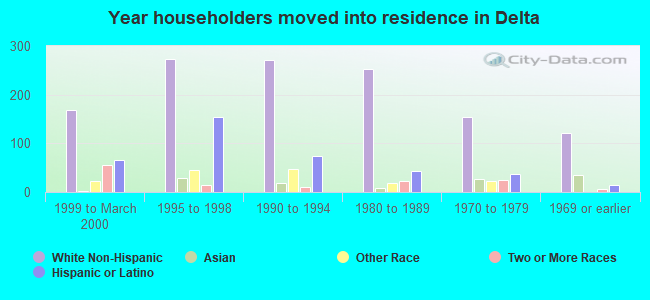
64% of Delta residents lived in the same house 5 years ago.
Out of people who lived in different houses, 50% lived in this county.
Out of people who lived in different counties, 91% lived in California.
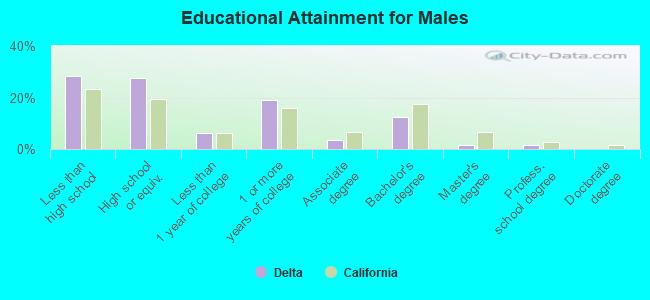
Education attainment for males 25 years and older:
- No schooling: 53
- Nursery to 4th grade: 63
- 5th and 6th grade: 114
- 7th and 8th grade: 55
- 9th grade: 48
- 10th grade: 58
- 11th grade: 20
- 12th grade, no diploma: 80
- High school graduate (or equivalency): 473
- Less than 1 year of college: 109
- Some college more than 1 year, no degree: 331
- Associate degree: 58
- Bachelor's degree: 212
- Master's degree: 26
- Professional school degree: 26
- Doctorate degree: 0
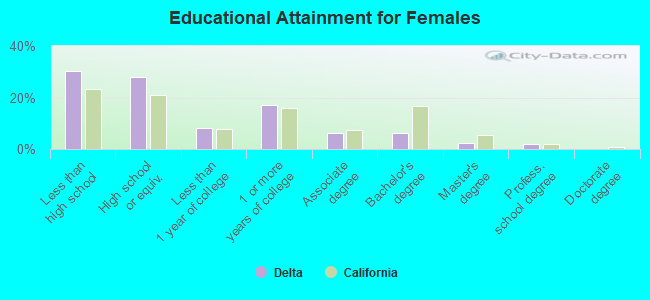
Education attainment for females 25 years and older:
- No schooling: 45
- Nursery to 4th grade: 65
- 5th and 6th grade: 80
- 7th and 8th grade: 43
- 9th grade: 47
- 10th grade: 33
- 11th grade: 47
- 12th grade, no diploma: 115
- High school graduate (or equivalency): 444
- Less than 1 year of college: 126
- Some college more than 1 year, no degree: 270
- Associate degree: 97
- Bachelor's degree: 95
- Master's degree: 39
- Professional school degree: 32
- Doctorate degree: 0


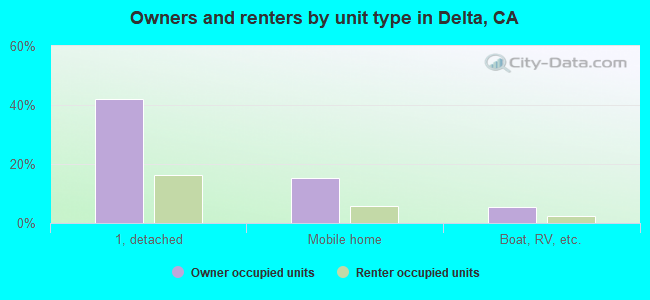
Housing units in structures:
- One, detached: 1,244
- One, attached: 57
- Two: 102
- 3 or 4: 61
- 5 to 9: 50
- 10 to 19: 34
- 50 or more: 8
- Mobile homes: 547
- Boats, RVs, vans, etc.: 204
Median worth of mobile homes: $115,806
Housing units lacking complete kitchen facilities: 1.6%
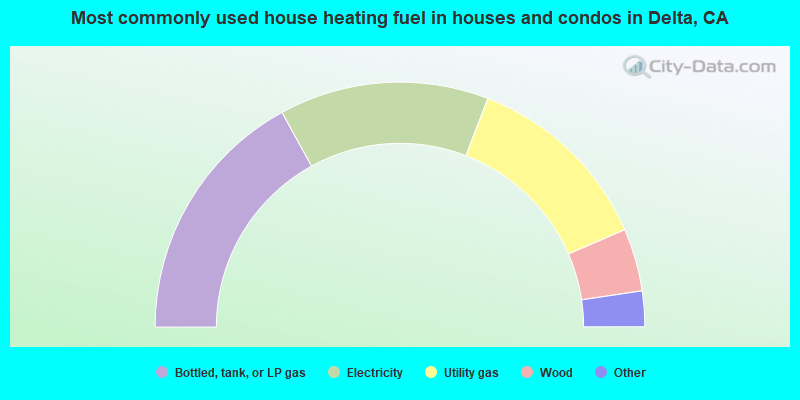
- 34.0%Bottled, tank, or LP gas
- 27.7%Electricity
- 25.3%Utility gas
- 8.3%Wood
- 3.1%Other fuel
- 1.3%Fuel oil, kerosene, etc.
- 0.3%No fuel used
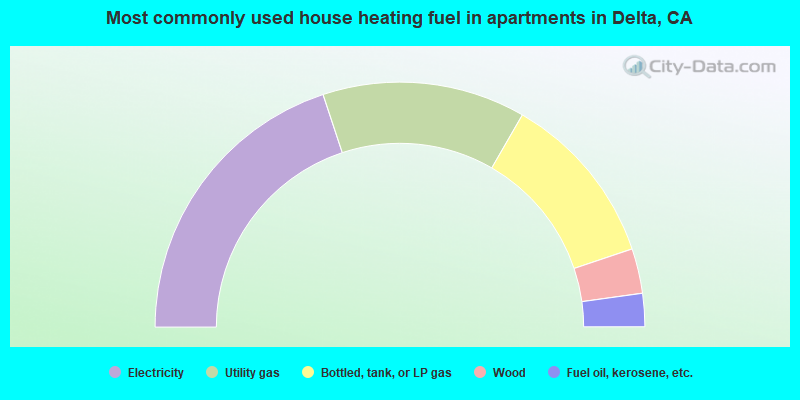
- 39.8%Electricity
- 26.8%Utility gas
- 23.0%Bottled, tank, or LP gas
- 5.9%Wood
- 4.4%Fuel oil, kerosene, etc.
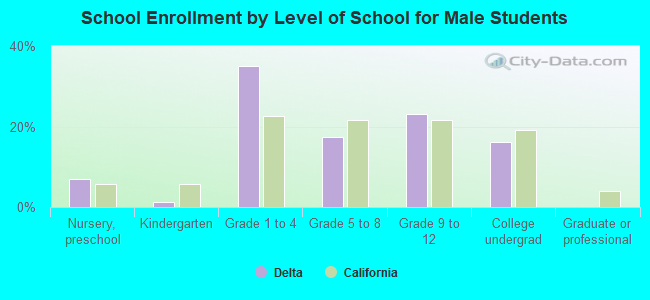
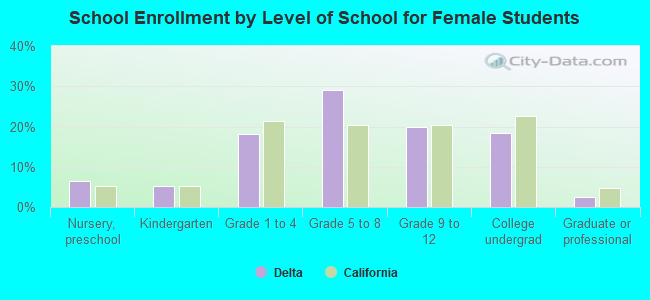
Private vs. public school enrollment:
| Here: | 3.3% |
| California: | 9.9% |
| Here: | 3.6% |
| California: | 7.8% |
| Here: | 12.5% |
| California: | 15.4% |