East Lewis, TN (Tennessee) Houses and Residents
| East Lewis: | $205,375 |
| Tennessee: | $284,800 |
Total population: 4,189 (Urban population: 0, Rural population: 4,133 (181 farm, 3,952 nonfarm))
Houses: 1,696 (1,550 occupied: 1,330 owner occupied, 220 renter occupied)
| % of renters here: | 14% |
| State: | 33% |
Housing density: 9 houses/condos per square mile
Median price asked for vacant for-sale houses and condos in 2022 in this county: $89,556.
Median contract rent in 2022: $665 (lower quartile is $795, upper quartile is $873)
Median rent asked for vacant for-rent units in 2022: $762
Median gross rent in East Lewis, TN in 2022: $938
Housing units in East Lewis with a mortgage: 323 (27 second mortgage, 19 home equity loan, 0 both second mortgage and home equity loan)
Houses without a mortgage: 236


Household type by relationship:
Households: 11,944- In family households: 10,283 (2,384 male householders, 972 female householders)
2,527 spouses, 3,329 children (2,985 natural, 86 adopted, 258 stepchildren), 385 grandchildren, 83 brothers or sisters, 114 parents, foster children, 132 other relatives, 287 non-relatives
- In nonfamily households: 1,661 (640 male householders (524 living alone)), 785 female householders (698 living alone)), 236 nonrelatives
- In group quarters: 217 (184 institutionalized population)
1,994 married couples with children.
577 single-parent households (139 men, 438 women).
96.0% of residents of East Lewis speak English at home.
2.4% of residents speak Spanish at home (66% speak English very well, 34% speak English well).
1.3% of residents speak other Indo-European language at home (73% speak English very well, 18% speak English well, 8% speak English not well).
0.2% of residents speak Asian or Pacific Island language at home (100% speak English very well).
0.1% of residents speak other language at home (100% speak English very well).
Foreign born population: 108 (2.3%)
(27.8% of them are naturalized citizens)
| Here: | 6.3 |
| State: | 6.5 |
| Here: | 4.9 |
| State: | 4.4 |

- Bedrooms in owner-occupied houses and condos in East Lewis, Tennessee
- 0no bedroom
- 541 bedroom
- 3942 bedrooms
- 6933 bedrooms
- 1614 bedrooms
- 285+ bedrooms

- Bedrooms in renter-occupied apartments in East Lewis, Tennessee
- 0no bedroom
- 191 bedroom
- 1122 bedrooms
- 663 bedrooms
- 234 bedrooms
- 05+ bedrooms

- Cars and other vehicles available in East Lewis in owner-occupied houses/condos
- 49no vehicle
- 2491 vehicle
- 5432 vehicles
- 3423 vehicles
- 964 vehicles
- 515+ vehicles

- Cars and other vehicles available in East Lewis in renter-occupied apartments
- 25no vehicle
- 961 vehicle
- 642 vehicles
- 353 vehicles
- 04 vehicles
- 05+ vehicles

- Rooms in owner-occupied houses in East Lewis, Tennessee
- 01 room
- 192 rooms
- 513 rooms
- 1714 rooms
- 3965 rooms
- 3116 rooms
- 2087 rooms
- 928 rooms
- 829+ rooms

- Rooms in renter-occupied apartments in East Lewis, Tennessee
- 01 room
- 52 rooms
- 283 rooms
- 704 rooms
- 545 rooms
- 356 rooms
- 197 rooms
- 58 rooms
- 49+ rooms


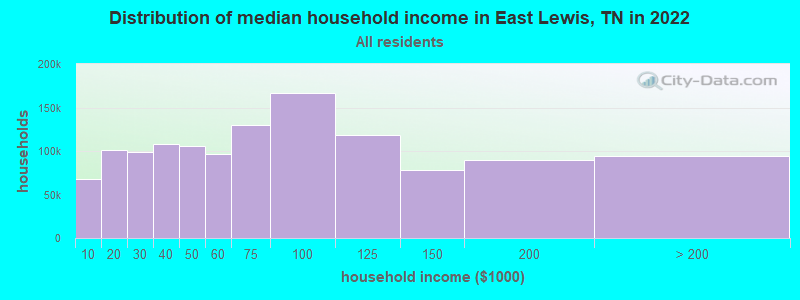
East Lewis, TN household income distribution

- 45,216Less than $10,000
- 75,841$10,000 to $19,999
- 71,925$20,000 to $29,999
- 73,540$30,000 to $39,999
- 71,104$40,000 to $49,999
- 65,813$50,000 to $59,999
- 89,729$60,000 to $74,999
- 114,370$75,000 to $99,999
- 85,536$100,000 to $124,999
- 50,949$125,000 to $149,999
- 55,921$150,000 to $199,999
- 47,273$200,000 or more
Percentage of workers working in this county: 47.4%
Number of people working at home: 210 (9.8% of all workers)
Travel time to work (commute)
- Less than 5 minutes: 71
- 5 to 9 minutes: 136
- 10 to 14 minutes: 211
- 15 to 19 minutes: 238
- 20 to 24 minutes: 183
- 25 to 29 minutes: 95
- 30 to 34 minutes: 294
- 35 to 39 minutes: 27
- 40 to 44 minutes: 71
- 45 to 59 minutes: 319
- 60 to 89 minutes: 123
- 90 or more minutes: 101
Means of transportation to work:
- Drove a car alone: 1,368 (71.4%)
- Carpooled: 425 (22.2%)
- Bicycle: 10 (0.5%)
- Walked: 47 (2.5%)
- Other means: 19 (1.0%)
- Worked at home: 47 (2.5%)

- Year of entry for the foreign-born population in East Lewis, Tennessee
- 141995 to March 2000
- 61990 to 1994
- 271985 to 1989
- 01980 to 1984
- 01975 to 1979
- 01970 to 1974
- 61965 to 1969
- 0Before 1965
Most common places of birth for foreign-born residents (%):
| East Lewis: | 50.9% (27) |
| Tennessee: | 28.1% (44,682) |
| East Lewis: | 26.4% (14) |
| Tennessee: | 2.6% (4,078) |
| East Lewis: | 11.3% (6) |
| Tennessee: | 0.3% (465) |
| East Lewis: | 11.3% (6) |
| Tennessee: | 0.6% (937) |
Place of birth for U.S.-born residents:
- This state: 2,605
- Other state: 1,475
- Northeast: 224
- Midwest: 516
- South: 588
- West: 147
62% of East Lewis residents lived in the same house 5 years ago.
Out of people who lived in different houses, 47% lived in this county.
Out of people who lived in different counties, 63% lived in Tennessee.
Education attainment for males 25 years and older:
- No schooling: 11
- Nursery to 4th grade: 17
- 5th and 6th grade: 40
- 7th and 8th grade: 112
- 9th grade: 79
- 10th grade: 44
- 11th grade: 26
- 12th grade, no diploma: 68
- High school graduate (or equivalency): 476
- Less than 1 year of college: 73
- Some college more than 1 year, no degree: 192
- Associate degree: 30
- Bachelor's degree: 86
- Master's degree: 37
- Professional school degree: 33
- Doctorate degree: 6

Education attainment for females 25 years and older:
- No schooling: 16
- Nursery to 4th grade: 8
- 5th and 6th grade: 25
- 7th and 8th grade: 145
- 9th grade: 50
- 10th grade: 56
- 11th grade: 14
- 12th grade, no diploma: 40
- High school graduate (or equivalency): 590
- Less than 1 year of college: 98
- Some college more than 1 year, no degree: 132
- Associate degree: 82
- Bachelor's degree: 39
- Master's degree: 49
- Professional school degree: 17
- Doctorate degree: 11


Housing units in structures:
- One, detached: 1,153
- One, attached: 6
- Two: 6
- Mobile homes: 531
Median worth of mobile homes: $84,156
Housing units lacking complete kitchen facilities: 4.1%


- 40.4%Electricity
- 32.3%Bottled, tank, or LP gas
- 15.1%Wood
- 11.4%Utility gas
- 0.5%No fuel used
- 0.3%Fuel oil, kerosene, etc.

- 30.0%Bottled, tank, or LP gas
- 28.2%Electricity
- 25.5%Wood
- 9.1%Utility gas
- 5.0%Fuel oil, kerosene, etc.
- 2.3%No fuel used
Private vs. public school enrollment:
| Here: | 9.8% |
| Tennessee: | 9.5% |
| Here: | 10.0% |
| Tennessee: | 10.4% |
| Here: | 23.6% |
| Tennessee: | 22.8% |


