Enfield, NC (North Carolina) Houses and Residents
| Enfield: | $98,550 |
| North Carolina: | $280,600 |
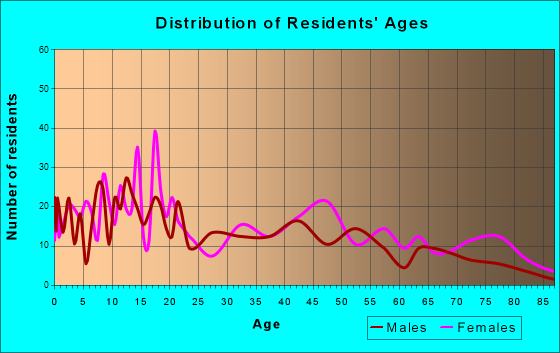
Total population: 2,448 (Urban population: 0, Rural population: 2,280 (5 farm, 2,275 nonfarm))
Houses: 1,040 (821 occupied: 315 owner occupied, 518 renter occupied)
| % of renters here: | 62% |
| State: | 33% |
Housing density: 869 houses/condos per square mile
Median price asked for vacant for-sale houses and condos in 2022 in this county: $123,085.
Median contract rent in 2022: $338 (lower quartile is $229, upper quartile is $495)
Median rent asked for vacant for-rent units in 2022: $289
Median gross rent in Enfield, NC in 2022: $586
Housing units in Enfield with a mortgage: 170 (9 second mortgage, 0 home equity loan, 3 both second mortgage and home equity loan)
Houses without a mortgage: 0
Median household income for houses/condos with a mortgage: $39,322
Median household income for apartments without a mortgage: $36,071
Median monthly housing costs: $580
Compare current foreclosures near Enfield, NC:
| Photo | Address | Area | Beds / Baths | Price | Details |
|---|---|---|---|---|---|

|
#1
Medoc Mountain Rd
Enfield, NC 27823
|
1,152 sq. feet
|
2 baths - beds |
show details | |

|
#2
Drapers Rd
Enfield, NC 27823
|
1,288 sq. feet
|
2 baths - beds |
show details | |

|
#3
Will Richardson Rd
Enfield, NC 27823
|
1,130 sq. feet
|
2 baths - beds |
show details | |

|
#4
Heathsville Rd
Enfield, NC 27823
|
816 sq. feet
|
1 baths - beds |
show details | |

|
#5
Medoc Mountain Rd
Enfield, NC 27823
|
1,803 sq. feet
|
1 baths - beds |
show details | |

|
#6
Heathsville Rd
Enfield, NC 27823
|
3,939 sq. feet
|
3 baths - beds |
show details | |

|
#7
Meyer St
Enfield, NC 27823
|
2,052 sq. feet
|
2 baths - beds |
show details | |

|
#8
Hedgepeth Rd
Enfield, NC 27823
|
1,134 sq. feet
|
2 baths - beds |
show details | |

|
#9
Richardson Rd
Enfield, NC 27823
|
1,488 sq. feet
|
2 baths - beds |
show details | |

|
#10
Ita Rd
Enfield, NC 27823
|
2,232 sq. feet
|
2 baths - beds |
show details |
| Photo | Address | Area | Beds / Baths | Price | Details |
|---|---|---|---|---|---|

|
#11
Whitaker St
Enfield, NC 27823
|
2,282 sq. feet
|
2 baths - beds |
show details | |

|
#12
Richardson Rd
Enfield, NC 27823
|
1,792 sq. feet
|
2 baths - beds |
show details | |

|
#13
Ringwood Rd
Enfield, NC 27823
|
1,430 sq. feet
|
1 baths - beds |
show details | |

|
#14
White Oak Rd
Enfield, NC 27823
|
- sq. feet
|
- baths - beds |
show details | |

|
#15
Us Highway 301
Enfield, NC 27823
|
- sq. feet
|
- baths - beds |
show details | |

|
#16
S Martin Luther King Ave
Enfield, NC 27823
|
- sq. feet
|
- baths - beds |
show details | |

|
#17
Clayton Drive
Enfield, NC 27823
|
- sq. feet
|
- baths - beds |
show details | |

|
#18
November Ln
Enfield, NC 27823
|
- sq. feet
|
- baths - beds |
show details | |

|
#19
Bobbitt Rd
Enfield, NC 27823
|
- sq. feet
|
- baths - beds |
show details | |

|
#20
Nc Highway 561
Scotland Neck, NC 27874
|
1,331 sq. feet
|
1 baths - beds |
$17,900
|
show details |
| Photo | Address | Area | Beds / Baths | Price | Details |
|---|---|---|---|---|---|

|
#21
Mashie Ct
Rocky Mount, NC 27804
|
2,199 sq. feet
|
3 baths 4 beds |
show details | |

|
#22
Mcduffers Rd
Rocky Mount, NC 27804
|
2,044 sq. feet
|
3 baths 4 beds |
show details | |

|
#23
Wimberly Ave
Rocky Mount, NC 27804
|
1,918 sq. feet
|
2 baths 4 beds |
show details | |

|
#24
Drivers Cir
Rocky Mount, NC 27804
|
2,291 sq. feet
|
2 baths 4 beds |
show details | |

|
#25
Waterloo Dr
Rocky Mount, NC 27804
|
2,212 sq. feet
|
2 baths 4 beds |
show details | |

|
#26
Drivers Cir
Rocky Mount, NC 27804
|
2,502 sq. feet
|
2 baths 4 beds |
show details | |

|
#27
Nc Highway 97 E
Tarboro, NC 27886
|
1,067 sq. feet
|
1 baths 3 beds |
show details | |

|
#28
Castaways Trl
Rocky Mount, NC 27804
|
1,720 sq. feet
|
2 baths 3 beds |
show details | |

|
#29
Oakwood Dr
Battleboro, NC 27809
|
1,568 sq. feet
|
2 baths 3 beds |
show details | |

|
#30
Gay Rd
Rocky Mount, NC 27801
|
1,239 sq. feet
|
2 baths 3 beds |
show details |
| Photo | Address | Area | Beds / Baths | Price | Details |
|---|---|---|---|---|---|

|
#31
Waterloo Dr
Rocky Mount, NC 27804
|
1,918 sq. feet
|
2 baths 3 beds |
show details | |

|
#32
Brentwood Dr
Rocky Mount, NC 27804
|
1,480 sq. feet
|
2 baths 3 beds |
show details | |

|
#33
Eagles Ter
Rocky Mount, NC 27804
|
2,332 sq. feet
|
1 baths 4 beds |
show details | |

|
#34
Nc Highway 97 E
Tarboro, NC 27886
|
1,325 sq. feet
|
1 baths 3 beds |
show details | |

|
#35
Eagles Ter
Rocky Mount, NC 27804
|
1,747 sq. feet
|
2 baths 3 beds |
show details | |

|
#36
Blue Rug Rd
Rocky Mount, NC 27801
|
1,535 sq. feet
|
2 baths 3 beds |
show details | |

|
#37
Crabapple Ln
Rocky Mount, NC 27804
|
1,330 sq. feet
|
2 baths 3 beds |
show details | |

|
#38
Red Oak Battleboro Rd
Battleboro, NC 27809
|
1,691 sq. feet
|
2 baths 3 beds |
show details | |

|
#39
Red Oak Battleboro Rd
Battleboro, NC 27809
|
2,759 sq. feet
|
2 baths 3 beds |
show details | |

|
#40
Greyson Rd
Rocky Mount, NC 27804
|
1,812 sq. feet
|
2 baths 3 beds |
show details |
| Photo | Address | Area | Beds / Baths | Price | Details |
|---|---|---|---|---|---|

|
#41
Leggett Rd
Rocky Mount, NC 27801
|
1,025 sq. feet
|
1 baths 3 beds |
show details | |

|
#42
Bridgewood Rd
Rocky Mount, NC 27804
|
1,488 sq. feet
|
2 baths 3 beds |
show details | |

|
#43
Old Sparta Rd
Rocky Mount, NC 27804
|
1,297 sq. feet
|
2 baths 3 beds |
show details | |

|
#44
Rabbits Trce
Rocky Mount, NC 27804
|
1,620 sq. feet
|
2 baths 3 beds |
show details | |

|
#45
Hunter Hill Rd
Rocky Mount, NC 27804
|
784 sq. feet
|
1 baths 2 beds |
show details | |

|
#46
S New St
Whitakers, NC 27891
|
1,528 sq. feet
|
2 baths 2 beds |
show details | |

|
#47
Crooked Swamp Rd
Whitakers, NC 27891
|
1,620 sq. feet
|
2 baths 3 beds |
show details | |

|
#48
Lucas Cir
Rocky Mount, NC 27801
|
1,568 sq. feet
|
2 baths 3 beds |
show details | |

|
#49
River Run Rd
Rocky Mount, NC 27801
|
1,782 sq. feet
|
2 baths 3 beds |
show details | |

|
Check over 1 million property listings on Foreclosure.com!
|
browse all offers | |||

Latest news about housing in Enfield, NC collected exclusively by city-data.com from local newspapers, TV, and radio stations

 | I love old homes! (23 replies) |
| Charlotte vs. Raleigh? (8515 replies) |
| Coastal North Carolina (3 replies) |
| Where can I buy NC gifts for Christmas?? (13 replies) |
| Trying to find perfect house in the near future, please help (15 replies) |
| Halifax or Enfield (3 replies) |
Median year apartment built: 1966
Household type by relationship:
Households: 2,009- Male householders: 289 (167 living alone), Female householders: 524 (237 living alone)
86 spouses (86 opposite-sex spouses), 62 unmarried partners, (62 opposite-sex unmarried partners), 661 children (661 natural, 0 adopted, 0 stepchildren), 230 grandchildren, 15 brothers or sisters, 0 parents, 0 foster children, 33 other relatives, 49 non-relatives
- In group quarters: 57
Size of family households: 152 2-persons, 71 3-persons, 55 4-persons, 87 5-persons, 6 6-persons, 15 7-or-more-persons.
Size of nonfamily households: 411 1-person, 16 2-persons, 14 3-persons.
29 married couples with children.
288 single-parent households (71 men, 217 women).
98.4% of residents of Enfield speak English at home.
0.8% of residents speak other Indo-European language at home (100% speak English very well).
0.6% of residents speak other language at home (100% speak English very well).
| Here: | 6.5 |
| State: | 6.4 |
| Here: | 4.2 |
| State: | 4.4 |

- Bedrooms in owner-occupied houses and condos in Enfield, North Carolina
- 0no bedroom
- 01 bedroom
- 592 bedrooms
- 1983 bedrooms
- 494 bedrooms
- 95+ bedrooms

- Bedrooms in renter-occupied apartments in Enfield, North Carolina
- 9no bedroom
- 1611 bedroom
- 2222 bedrooms
- 1263 bedrooms
- 04 bedrooms
- 05+ bedrooms

- Cars and other vehicles available in Enfield in owner-occupied houses/condos
- 14no vehicle
- 931 vehicle
- 1272 vehicles
- 543 vehicles
- 274 vehicles
- 05+ vehicles

- Cars and other vehicles available in Enfield in renter-occupied apartments
- 234no vehicle
- 1681 vehicle
- 882 vehicles
- 03 vehicles
- 294 vehicles
- 05+ vehicles

- Rooms in owner-occupied houses in Enfield, North Carolina
- 01 room
- 02 rooms
- 03 rooms
- 34 rooms
- 805 rooms
- 736 rooms
- 1027 rooms
- 308 rooms
- 279+ rooms

- Rooms in renter-occupied apartments in Enfield, North Carolina
- 91 room
- 192 rooms
- 1133 rooms
- 1654 rooms
- 1655 rooms
- 466 rooms
- 07 rooms
- 08 rooms
- 09+ rooms


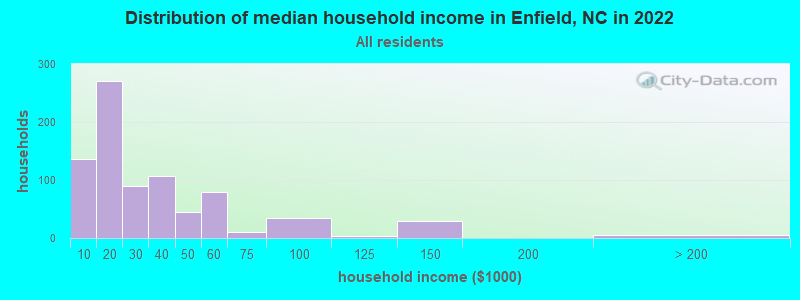
Enfield, NC household income distribution

- 136Less than $10,000
- 271$10,000 to $19,999
- 90$20,000 to $29,999
- 107$30,000 to $39,999
- 45$40,000 to $49,999
- 79$50,000 to $59,999
- 11$60,000 to $74,999
- 34$75,000 to $99,999
- 4$100,000 to $124,999
- 30$125,000 to $149,999
- 5$200,000 or more
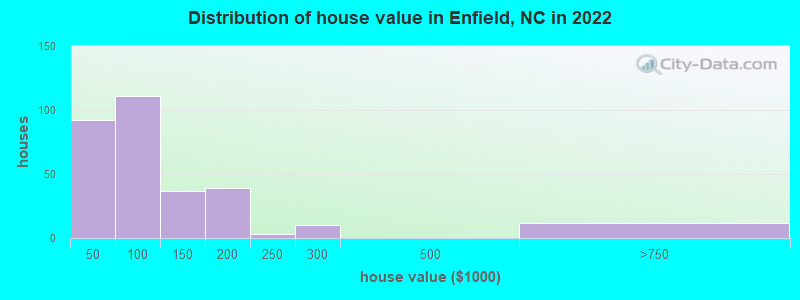
Home value of owner - occupied houses in 2022 in Enfield, NC
-
- 15$15,000 to $19,999
- 9$20,000 to $24,999
- 5$25,000 to $29,999
- 26$35,000 to $39,999
- 36$40,000 to $49,999
- 25$50,000 to $59,999
- 10$60,000 to $69,999
- 2$70,000 to $79,999
- 29$80,000 to $89,999
- 6$90,000 to $99,999
- 35$100,000 to $124,999
- 2$125,000 to $149,999
- 7$150,000 to $174,999
- 31$175,000 to $199,999
- 2$200,000 to $249,999
- 9$250,000 to $299,999
- 12$500,000 to $749,999
Rent paid by renters in 2022 in Enfield, NC
-
- 13Less than $100
- 39$100 to $149
- 19$150 to $199
- 45$200 to $249
- 36$250 to $299
- 66$300 to $349
- 28$350 to $399
- 26$400 to $449
- 12$450 to $499
- 4$500 to $549
- 7$550 to $599
- 6$600 to $649
- 23$650 to $699
- 28$700 to $749
- 6$1,000 to $1,249
- 126No cash rent


Percentage of workers working in this county: 35.9%
Number of people working at home: 1 (0.2% of all workers)
Travel time to work (commute)
- Less than 5 minutes: 9
- 5 to 9 minutes: 12
- 10 to 14 minutes: 79
- 15 to 19 minutes: 29
- 20 to 24 minutes: 64
- 25 to 29 minutes: 15
- 30 to 34 minutes: 159
- 35 to 39 minutes: 7
- 40 to 44 minutes: 16
- 45 to 59 minutes: 57
- 60 to 89 minutes: 10
- 90 or more minutes: 4
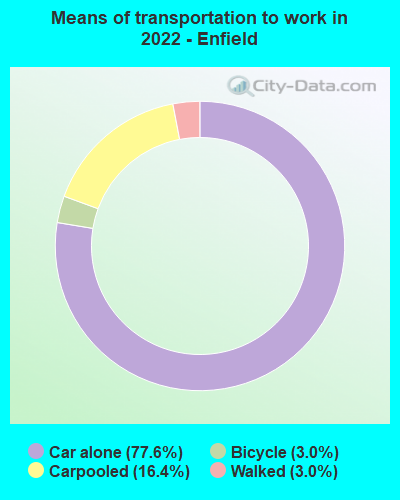
Means of transportation to work:
- Drove a car alone: 511 (70.2%)
- Carpooled: 94 (12.9%)
- Bicycle: 13 (1.8%)
- Walked: 19 (2.6%)
- Worked at home: 55 (7.6%)

- Unemployment by race in 2022
- Unemployment rate for Black residents
- 7.1%Males
- 18.8%Females

- Year of entry for the foreign-born population in Enfield, North Carolina
- 111995 to March 2000
- 181990 to 1994
- 01985 to 1989
- 21980 to 1984
- 21975 to 1979
- 01970 to 1974
- 61965 to 1969
- 0Before 1965
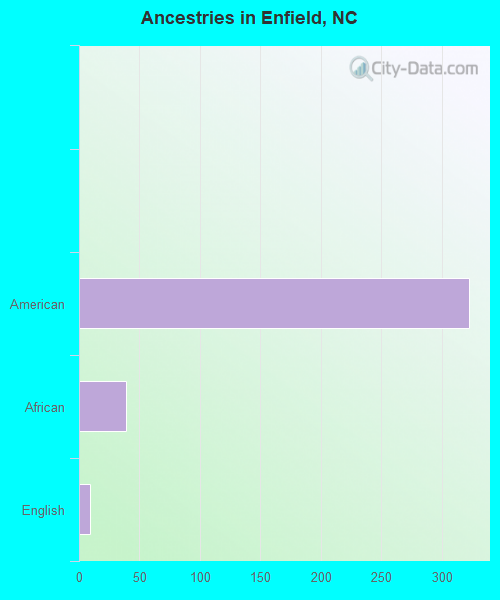
First ancestries reported:
- American: 323 (20.8%)
- African: 39 (2.5%)
- English: 9 (0.6%)
Most common places of birth for foreign-born residents (%):
| Enfield: | 46.2% (18) |
| North Carolina: | 2.1% (8,816) |
| Enfield: | 20.5% (8) |
| North Carolina: | 0.5% (2,246) |
| Enfield: | 15.4% (6) |
| North Carolina: | 0.4% (1,593) |
| Enfield: | 10.3% (4) |
| North Carolina: | 40.0% (172,065) |
| Enfield: | 5.1% (2) |
| North Carolina: | 0.7% (3,123) |
Place of birth for U.S.-born residents:
- This state: 1,756
- Other state: 217
- Northeast: 50
- Midwest: 10
- South: 156
- West: 0
84.5% of Enfield residents lived in the same house 1 years ago.
Out of people who lived in different houses, 41.2% lived in this county.
Out of people who lived in different counties, 68.2% lived in North Carolina.
| Enfield: | 84.5% |
| State average: | 87.3% |
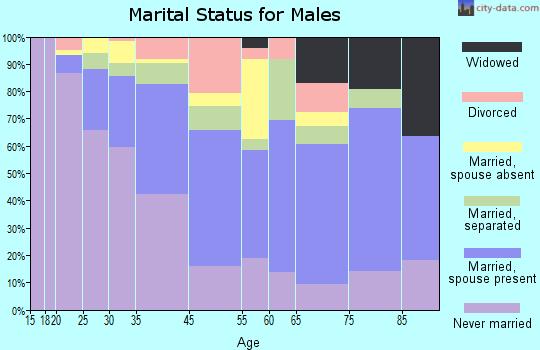
Education attainment for males 25 years and older:
- No schooling: 55
- Nursery to 4th grade: 0
- 5th and 6th grade: 2
- 7th and 8th grade: 10
- 9th grade: 28
- 10th grade: 7
- 11th grade: 43
- 12th grade, no diploma: 8
- High school graduate (or equivalency): 255
- Less than 1 year of college: 25
- Some college more than 1 year, no degree: 28
- Associate degree: 21
- Bachelor's degree: 15
- Master's degree: 0
- Professional school degree: 0
- Doctorate degree: 0

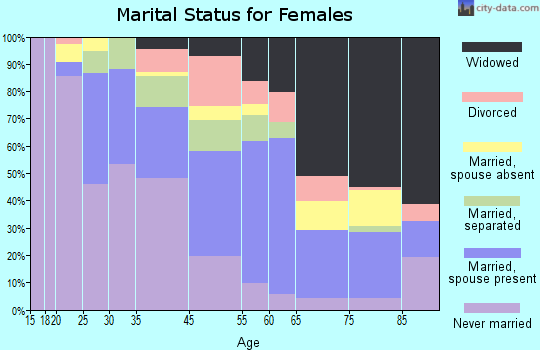
Education attainment for females 25 years and older:
- No schooling: 0
- Nursery to 4th grade: 8
- 5th and 6th grade: 2
- 7th and 8th grade: 23
- 9th grade: 34
- 10th grade: 27
- 11th grade: 56
- 12th grade, no diploma: 31
- High school graduate (or equivalency): 332
- Less than 1 year of college: 58
- Some college more than 1 year, no degree: 68
- Associate degree: 99
- Bachelor's degree: 18
- Master's degree: 42
- Professional school degree: 0
- Doctorate degree: 0

Housing units in structures:
- One, detached: 777
- One, attached: 23
- Two: 51
- 3 or 4: 54
- 5 to 9: 27
- 10 to 19: 6
- 20 to 49: 45
- 50 or more: 24
- Mobile homes: 28
Housing units lacking complete kitchen facilities in 2022: 11.6%
House/condo owner moved in on average 23 years ago
Renter moved in on average 4 years ago

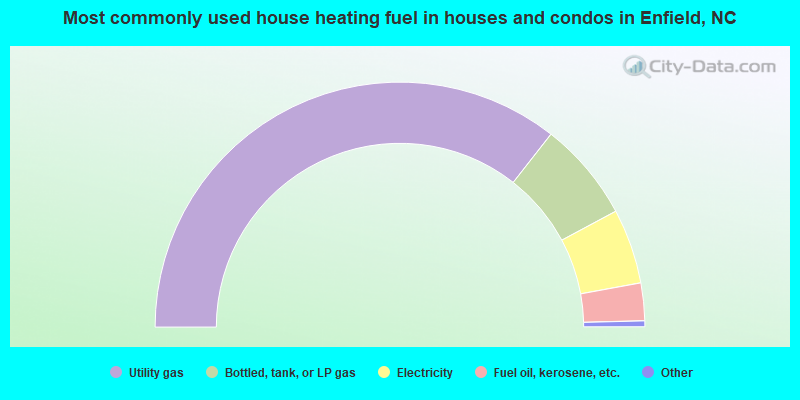
- 71.8%Utility gas
- 13.3%Bottled, tank, or LP gas
- 10.0%Electricity
- 5.0%Fuel oil, kerosene, etc.
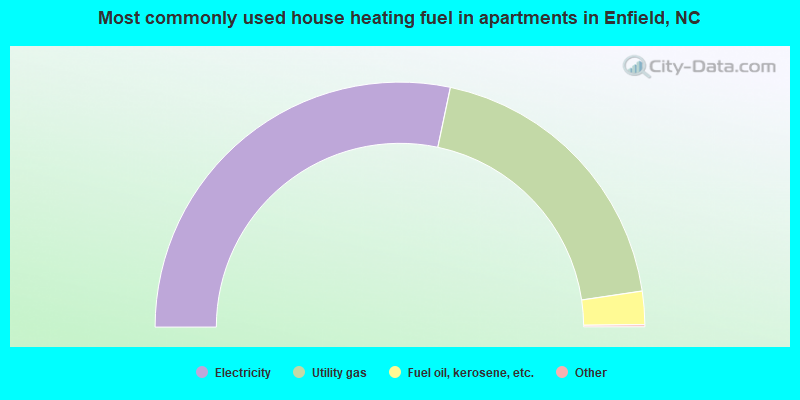
- 56.8%Electricity
- 38.8%Utility gas
- 4.4%Fuel oil, kerosene, etc.
Private vs. public school enrollment:
| Here: | 2.0% |
| North Carolina: | 13.8% |
| Here: | 2.2% |
| North Carolina: | 11.9% |
| Here: | 0.0% |
| North Carolina: | 19.3% |


