Eugene, OR (Oregon) Houses and Residents
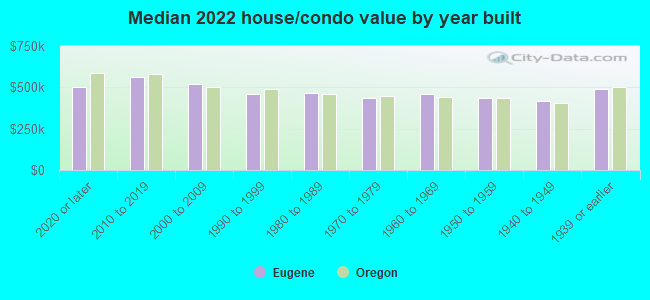
Estimated median house or condo value in 2022: $465,300 (it was $145,000 in 2000 )
Eugene:
$465,300Oregon:
$475,600
Lower value quartile - upper value quartile: $362,300 - $621,300Mean price in 2022: Detached houses: $502,879 Here:
$502,879State:
$562,872
Townhouses or other attached units: $423,709 Here:
$423,709State:
$463,029
In 2-unit structures: $483,431 Here:
$483,431State:
$505,105
In 3-to-4-unit structures: $361,858 Here:
$361,858State:
$419,673
In 5-or-more-unit structures: $346,223 Here:
$346,223State:
$420,389
Mobile homes: $144,892 Here:
$144,892State:
$214,044
Total population: 160,561 (Urban population: 137,433, Rural population: 366 (15 farm, 351 nonfarm ))
Houses: 79,852 (76,874 occupied: 36,902 owner occupied, 39,972 renter occupied )
% of renters here:
52%State:
37%
Housing density: 1,971 houses/condos per square mile
Median price asked for vacant for-sale houses and condos in 2022: $359,227.
Median contract rent in 2022: $1,142 (lower quartile is $828, upper quartile is $1,463)
Median rent asked for vacant for-rent units in 2022: $1,793
Median gross rent in Eugene, OR in 2022: $1,287
Housing units in Eugene with a mortgage: 23,655 (3,139 second mortgage, 86 home equity loan, 2,884 both second mortgage and home equity loan )Houses without a mortgage: 731
Median household income for houses/condos with a mortgage: $108,559
Median household income for apartments without a mortgage: $67,837
Median monthly housing costs: $1,337
Data:
Median house or condo value ($)
Median house or condo value ($ change since 2000)
Median house or condo value ($) - White
Median house or condo value ($) - Black or African American
Median house or condo value ($) - Asian
Median house or condo value ($) - Hispanic or Latino
Median house or condo value ($) - American Indian and Alaska Native
Median house or condo value ($) - Multirace
Median house or condo value ($) - Other Race
Median price asked for mobile homes ($)
Household density (households per square mile)
Mean house or condo value by units in structure - 1, detached ($)
Mean house or condo value by units in structure - 1, attached ($)
Mean house or condo value by units in structure - 2 ($)
Mean house or condo value by units in structure by units in structure - 3 or 4 ($)
Mean house or condo value by units in structure - 5 or more ($)
Mean house or condo value by units in structure - Boat, RV, van, etc. ($)
Mean house or condo value by units in structure - Mobile home ($)
Median contract rent ($)
Median contract rent - Lower quartile ($)
Median contract rent - Upper quartile ($)
Median gross rent ($)
Urban houses (%)
Rural houses (%)
Houses occupied (%)
Houses occupied (% change since 2000)
Houses owner occupied (%)
Houses owner occupied (% change since 2000)
Houses renter occupied (%)
Houses renter occupied (% change since 2000)
Vacant housing units - For rent (%)
Vacant housing units - For rent (% change since 2000)
Vacant housing units - For sale only (%)
Vacant housing units - For sale only (% change since 2000)
Vacant housing units - Rented or sold, not occupied (%)
Vacant housing units - Rented or sold, not occupied (% change since 2000)
Vacant housing units - For seasonal, recreational, or occasional use (%)
Vacant housing units - For seasonal, recreational, or occasional use (% change since 2000)
Vacant housing units - For migrant workers (%)
Vacant housing units - For migrant workers (% change since 2000)
Vacant housing units - Other vacant (%)
Vacant housing units - Other vacant (% change since 2000)
Median monthly housing costs ($)
Median household income for houses/condos with a mortgage ($)
Median household income for houses/condos without a mortgage ($)
Median household income ($)
Median household income ($) - White
Median household income ($) - Black or African American
Median household income ($) - Asian
Median household income ($) - Hispanic or Latino
Median household income ($) - American Indian and Alaska Native
Median household income ($) - Multirace
Median household income ($) - Other Race
Mortgage status - with mortgage (%)
Mortgage status - with second mortgage (%)
Mortgage status - with home equity loan (%)
Mortgage status - with both second mortgage and home equity loan (%)
Mortgage status - without a mortgage (%)
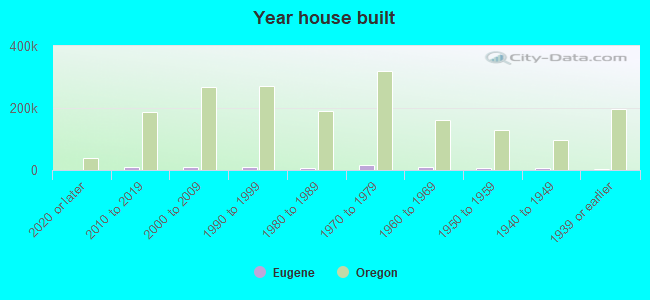
Median year house/condo built
Median year apartment built
Household type by relationship - Male householder living alone (%)
Household type by relationship - Male householder not living alone (%)
Household type by relationship - Female householder living alone (%)
Household type by relationship - Female householder not living alone (%)
Household type by relationship - Opposite-Sex spouse (%)
Household type by relationship - Same-Sex spouse (%)
Household type by relationship - Opposite-Sex unmarried partner (%)
Household type by relationship - Same-Sex unmarried partner (%)
Household type by relationship - In group quarters (%)
Size of family households - 2-person household (%)
Size of family households - 3-person household (%)
Size of family households - 4-person household (%)
Size of family households - 5-person household (%)
Size of family households - 6-person household (%)
Size of family households - 7-or-more-person household (%)
Size of nonfamily households - 1-person household (%)
Size of nonfamily households - 2-person household (%)
Size of nonfamily households - 3-person household (%)
Size of nonfamily households - 4-person household (%)
Size of nonfamily households - 5-person household (%)
Size of nonfamily households - 6-person household (%)
Size of nonfamily households - 7-or-moreperson household (%)
Year house built - Built 2010 or later (%)
Year house built - Built 2000 to 2009 (%)
Year house built - Built 1990 to 1999 (%)
Year house built - Built 1980 to 1989 (%)
Year house built - Built 1970 to 1979 (%)
Year house built - Built 1960 to 1969 (%)
Year house built - Built 1950 to 1959 (%)
Year house built - Built 1940 to 1949 (%)
Year house built - Built 1939 or earlier (%)
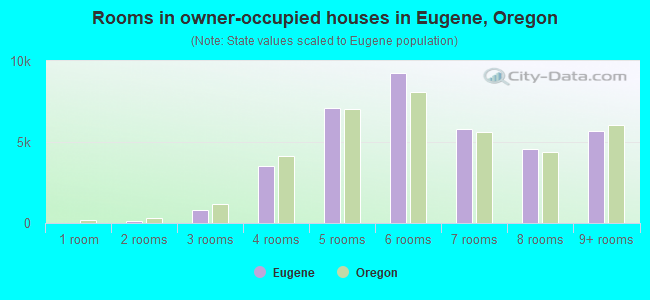
Median number of rooms in houses and condos
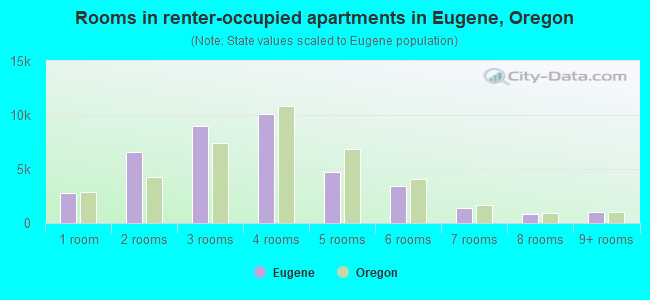
Median number of rooms in apartments
Median number of bedrooms in owner occupied houses
Mean number of bedrooms in owner occupied houses
Median number of bedrooms in renter occupied houses
Mean number of bedrooms in renter occupied houses
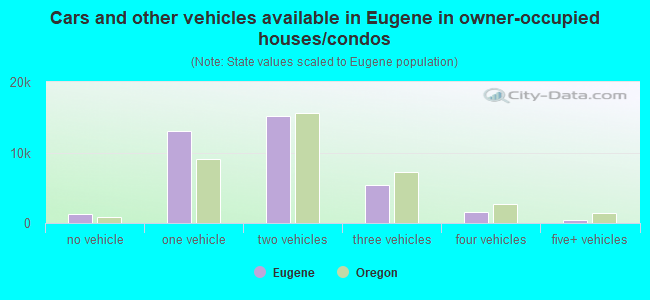
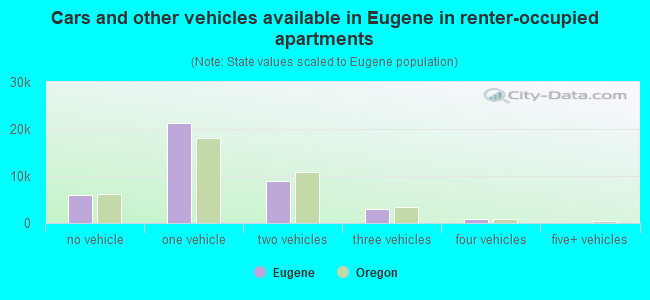
Median number of vehichles in owner occupied houses
Mean number of vehichles in owner occupied houses
Median number of vehichles in renter occupied houses
Mean number of vehichles in renter occupied houses
Rooms in owner-occupied houses - 1 room (%)
Rooms in owner-occupied houses - 2 rooms (%)
Rooms in owner-occupied houses - 3 rooms (%)
Rooms in owner-occupied houses - 4 rooms (%)
Rooms in owner-occupied houses - 5 rooms (%)
Rooms in owner-occupied houses - 6 rooms (%)
Rooms in owner-occupied houses - 7 rooms (%)
Rooms in owner-occupied houses - 8 rooms (%)
Rooms in owner-occupied houses - 9+ rooms (%)
Rooms in renter-occupied houses - 1 room (%)
Rooms in renter-occupied houses - 2 rooms (%)
Rooms in renter-occupied houses - 3 rooms (%)
Rooms in renter-occupied houses - 4 rooms (%)
Rooms in renter-occupied houses - 5 rooms (%)
Rooms in renter-occupied houses - 6 rooms (%)
Rooms in renter-occupied houses - 7 rooms (%)
Rooms in renter-occupied houses - 8 rooms (%)
Rooms in renter-occupied houses - 9+ rooms (%)
Bedrooms in owner-occupied houses - no bedrooms (%)
Bedrooms in owner-occupied houses - 1 bedroom (%)
Bedrooms in owner-occupied houses - 2 bedrooms (%)
Bedrooms in owner-occupied houses - 3 bedrooms (%)
Bedrooms in owner-occupied houses - 4 bedrooms (%)
Bedrooms in owner-occupied houses - 5+ bedrooms (%)
Bedrooms in renter-occupied houses - no bedrooms (%)
Bedrooms in renter-occupied houses - 1 bedroom (%)
Bedrooms in renter-occupied houses - 2 bedrooms (%)
Bedrooms in renter-occupied houses - 3 bedrooms (%)
Bedrooms in renter-occupied houses - 4 bedrooms (%)
Bedrooms in renter-occupied houses - 5+ bedrooms (%)
Vehicles available in owner-occupied houses - no vehicle available (%)
Vehicles available in owner-occupied houses - 1 vehicle available(%)
Vehicles available in owner-occupied houses - 2 Vehicles available (%)
Vehicles available in owner-occupied houses - 3 Vehicles available (%)
Vehicles available in owner-occupied houses - 4 Vehicles available (%)
Vehicles available in owner-occupied houses - 5+ Vehicles available (%)
Vehicles available in renter-occupied houses - no vehicle available (%)
Vehicles available in renter-occupied houses - 1 vehicle available (%)
Vehicles available in renter-occupied houses - 2 Vehicles available (%)
Vehicles available in renter-occupied houses - 3 Vehicles available (%)
Vehicles available in renter-occupied houses - 4 Vehicles available (%)
Vehicles available in renter-occupied houses - 5+ Vehicles available (%)
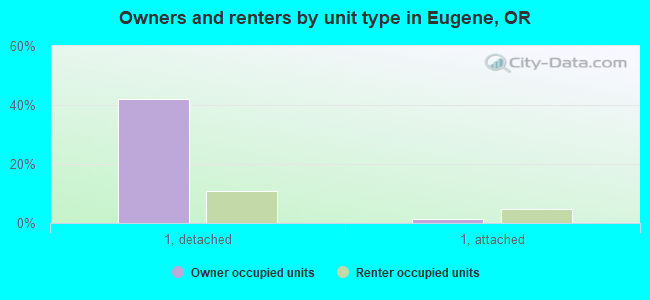
Housing units in structures - 1, detached (%)
Housing units in structures - 1, attached (%)
Housing units in structures - 2 (%)
Housing units in structures - 3 or 4 (%)
Housing units in structures - 5 to 9 (%)
Housing units in structures - 10 to 19 (%)
Housing units in structures - 20 to 49 (%)
Housing units in structures - 50 or more (%)
Housing units in structures - Mobile home (%)
Housing units in structures - Boat, RV, van, etc. (%)
Housing units in structures - Owners - 1, detached (%)
Housing units in structures - Owners - 1, attached (%)
Housing units in structures - Owners - 2 (%)
Housing units in structures - Owners - 3 or 4 (%)
Housing units in structures - Owners - 5 to 9 (%)
Housing units in structures - Owners - 10 to 19 (%)
Housing units in structures - Owners - 20 to 49 (%)
Housing units in structures - Owners - 50 or more (%)
Housing units in structures - Owners - Mobile home (%)
Housing units in structures - Owners - Boat, RV, van, etc. (%)
Housing units in structures - Renters - 1, detached (%)
Housing units in structures - Renters - 1, attached (%)
Housing units in structures - Renters - 2 (%)
Housing units in structures - Renters - 3 or 4 (%)
Housing units in structures - Renters - 5 to 9 (%)
Housing units in structures - Renters - 10 to 19 (%)
Housing units in structures - Renters - 20 to 49 (%)
Housing units in structures - Renters - 50 or more (%)
Housing units in structures - Renters - Mobile home (%)
Housing units in structures - Renters - Boat, RV, van, etc. (%)
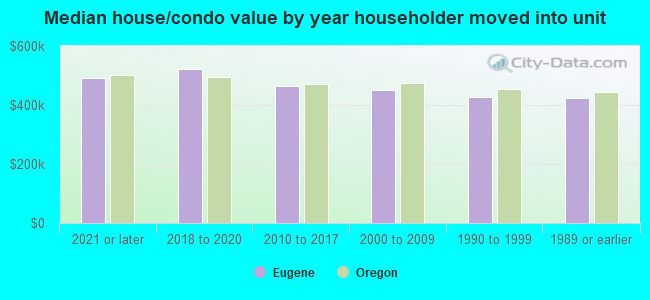
House/condo owner moved in on average (years ago)
Renter moved in on average (years ago)
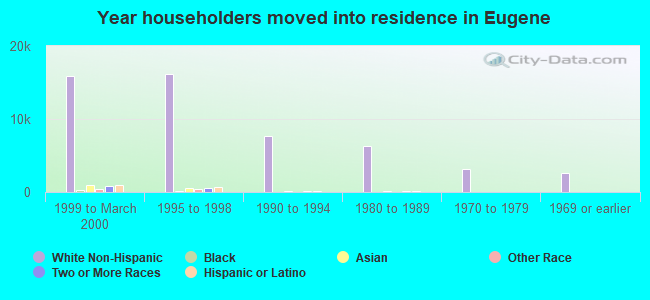
Year householder moved into unit - Moved in 1999 to March 2000 (%)
Year householder moved into unit - Moved in 1999 to March 2000 (%) - White
Year householder moved into unit - Moved in 1999 to March 2000 (%) - Black or African American
Year householder moved into unit - Moved in 1999 to March 2000 (%) - Asian
Year householder moved into unit - Moved in 1999 to March 2000 (%) - Hispanic or Latino
Year householder moved into unit - Moved in 1999 to March 2000 (%) - American Indian and Alaska Native
Year householder moved into unit - Moved in 1999 to March 2000 (%) - Multirace
Year householder moved into unit - Moved in 1999 to March 2000 (%) - Other Race
Year householder moved into unit - Moved in 1995 to 1998 (%)
Year householder moved into unit - Moved in 1995 to 1998 (%) - White
Year householder moved into unit - Moved in 1995 to 1998 (%) - Black or African American
Year householder moved into unit - Moved in 1995 to 1998 (%) - Asian
Year householder moved into unit - Moved in 1995 to 1998 (%) - Hispanic or Latino
Year householder moved into unit - Moved in 1995 to 1998 (%) - American Indian and Alaska Native
Year householder moved into unit - Moved in 1995 to 1998 (%) - Multirace
Year householder moved into unit - Moved in 1995 to 1998 (%) - Other Race
Year householder moved into unit - Moved in 1990 to 1994 (%)
Year householder moved into unit - Moved in 1990 to 1994 (%) - White
Year householder moved into unit - Moved in 1990 to 1994 (%) - Black or African American
Year householder moved into unit - Moved in 1990 to 1994 (%) - Asian
Year householder moved into unit - Moved in 1990 to 1994 (%) - Hispanic or Latino
Year householder moved into unit - Moved in 1990 to 1994 (%) - American Indian and Alaska Native
Year householder moved into unit - Moved in 1990 to 1994 (%) - Multirace
Year householder moved into unit - Moved in 1990 to 1994 (%) - Other Race
Year householder moved into unit - Moved in 1980 to 1989 (%)
Year householder moved into unit - Moved in 1980 to 1989 (%) - White
Year householder moved into unit - Moved in 1980 to 1989 (%) - Black or African American
Year householder moved into unit - Moved in 1980 to 1989 (%) - Asian
Year householder moved into unit - Moved in 1980 to 1989 (%) - Hispanic or Latino
Year householder moved into unit - Moved in 1980 to 1989 (%) - American Indian and Alaska Native
Year householder moved into unit - Moved in 1980 to 1989 (%) - Multirace
Year householder moved into unit - Moved in 1980 to 1989 (%) - Other Race
Year householder moved into unit - Moved in 1970 to 1979 (%)
Year householder moved into unit - Moved in 1970 to 1979 (%) - White
Year householder moved into unit - Moved in 1970 to 1979 (%) - Black or African American
Year householder moved into unit - Moved in 1970 to 1979 (%) - Asian
Year householder moved into unit - Moved in 1970 to 1979 (%) - Hispanic or Latino
Year householder moved into unit - Moved in 1970 to 1979 (%) - American Indian and Alaska Native
Year householder moved into unit - Moved in 1970 to 1979 (%) - Multirace
Year householder moved into unit - Moved in 1970 to 1979 (%) - Other Race
Year householder moved into unit - Moved in 1969 or earlier (%)
Year householder moved into unit - Moved in 1969 or earlier (%) - White
Year householder moved into unit - Moved in 1969 or earlier (%) - Black or African American
Year householder moved into unit - Moved in 1969 or earlier (%) - Asian
Year householder moved into unit - Moved in 1969 or earlier (%) - Hispanic or Latino
Year householder moved into unit - Moved in 1969 or earlier (%) - American Indian and Alaska Native
Year householder moved into unit - Moved in 1969 or earlier (%) - Multirace
Year householder moved into unit - Moved in 1969 or earlier (%) - Other Race
Housing units lacking complete plumbing facilities (%)
Housing units lacking complete kitchen facilities (%)
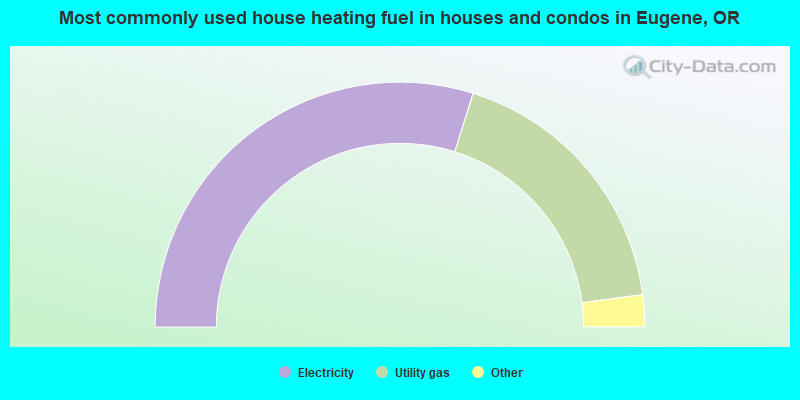
House heating fuel used in houses and condos - Utility gas (%)
House heating fuel used in houses and condos - Bottled, tank, or LP gas (%)
House heating fuel used in houses and condos - Electricity (%)
House heating fuel used in houses and condos - Fuel oil, kerosene, etc. (%)
House heating fuel used in houses and condos - Coal or coke (%)
House heating fuel used in houses and condos - Wood (%)
House heating fuel used in houses and condos - Solar energy (%)
House heating fuel used in houses and condos - Other fuel (%)
House heating fuel used in houses and condos - No fuel used (%)
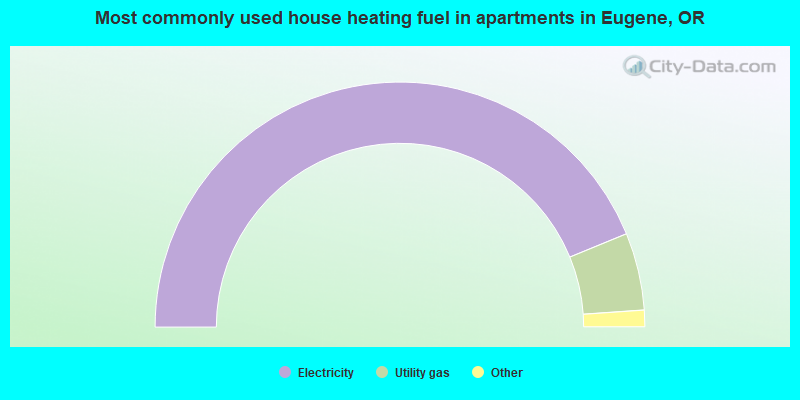
House heating fuel used in apartments - Utility gas (%)
House heating fuel used in apartments - Bottled, tank, or LP gas (%)
House heating fuel used in apartments - Electricity (%)
House heating fuel used in apartments - Fuel oil, kerosene, etc. (%)
House heating fuel used in apartments - Coal or coke (%)
House heating fuel used in apartments - Wood (%)
House heating fuel used in apartments - Solar energy (%)
House heating fuel used in apartments - Other fuel (%)
House heating fuel used in apartments - No fuel used (%)
Latest news about housing in Eugene, OR collected exclusively by city-data.com from local newspapers, TV, and radio stations
Median year house/condo built: 1977Median year apartment built: 1980Household type by relationship:
Households: 177,930
Male householders: 34,510 (13,342 living alone ), Female householders: 42,364 (17,313 living alone )25,700 spouses (25,335 opposite-sex spouses ), 9,075 unmarried partners , (8,049 opposite-sex unmarried partners ), 36,414 children (33,658 natural , 1,222 adopted , 1,534 stepchildren ), 871 grandchildren , 990 brothers or sisters , 2,101 parents , 120 foster children , 851 other relatives , 16,845 non-relatives In group quarters: 8,089
Size of family households: 18,126 2-persons , 7,585 3-persons , 5,886 4-persons , 2,032 5-persons , 281 6-persons , 171 7-or-more-persons .
Size of nonfamily households: 30,655 1-person , 8,299 2-persons , 2,414 3-persons , 1,145 4-persons , 280 5-persons .
18,116 married couples with children. single-parent households (2,029 men , 4,734 women ).
89.0% of residents of Eugene speak English at home. of residents speak Spanish at home (74% speak English very well , 12% speak English well , 12% speak English not well , 1% don't speak English at all ).of residents speak other Indo-European language at home (80% speak English very well , 16% speak English well , 4% speak English not well , 1% don't speak English at all ).of residents speak Asian or Pacific Island language at home (62% speak English very well , 23% speak English well , 14% speak English not well ).of residents speak other language at home (85% speak English very well , 15% speak English well ).
Foreign born population: 11,214 (6.3%)of them are naturalized citizens )
Median number of rooms in houses and condos:
Median number of rooms in apartments
Owner-occupied Renter-occupied
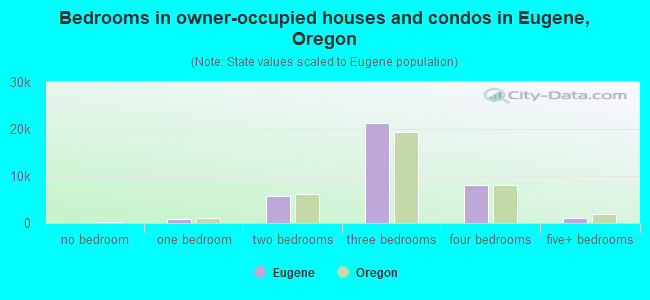
Bedrooms in owner-occupied houses and condos in Eugene, Oregon
0 no bedroom 767 1 bedroom 5,666 2 bedrooms 21,256 3 bedrooms 8,149 4 bedrooms 1,064 5+ bedrooms
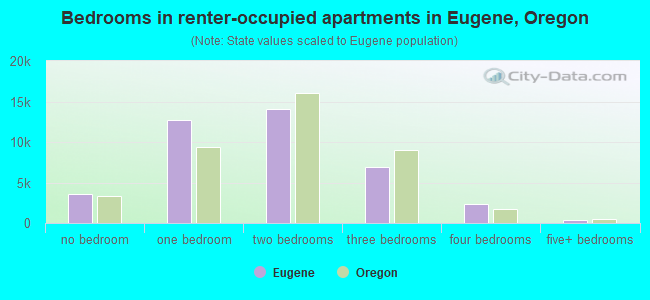
Bedrooms in renter-occupied apartments in Eugene, Oregon
3,567 no bedroom 12,677 1 bedroom 14,130 2 bedrooms 6,860 3 bedrooms 2,342 4 bedrooms 396 5+ bedrooms
Owner-occupied Renter-occupied
Rooms in owner-occupied houses in Eugene, Oregon
0 1 room 120 2 rooms 799 3 rooms 3,537 4 rooms 7,109 5 rooms 9,269 6 rooms 5,814 7 rooms 4,575 8 rooms 5,679 9+ rooms
Rooms in renter-occupied apartments in Eugene, Oregon
2,776 1 room 6,619 2 rooms 8,955 3 rooms 10,125 4 rooms 4,758 5 rooms 3,433 6 rooms 1,408 7 rooms 839 8 rooms 1,059 9+ rooms
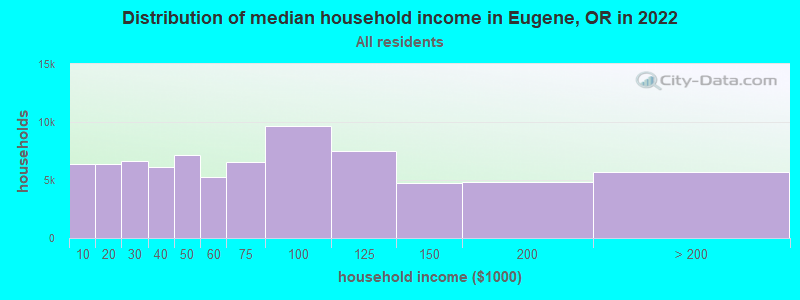
Eugene, OR household income distribution 6,369 Less than $10,0006,391 $10,000 to $19,9996,667 $20,000 to $29,9996,102 $30,000 to $39,9997,136 $40,000 to $49,9995,299 $50,000 to $59,9996,559 $60,000 to $74,9999,619 $75,000 to $99,9997,534 $100,000 to $124,9994,722 $125,000 to $149,9994,824 $150,000 to $199,9995,652 $200,000 or more
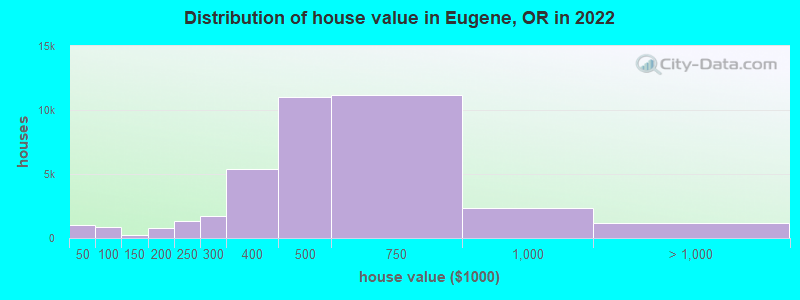
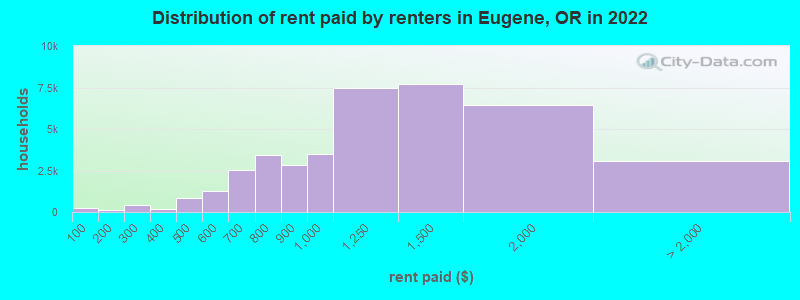
Home value of owner - occupied houses in 2022 in Eugene, OR 169 Less than $10,000100 $10,000 to $14,999187 $15,000 to $19,999102 $20,000 to $24,99956 $25,000 to $29,999147 $30,000 to $34,999111 $35,000 to $39,999133 $40,000 to $49,999123 $50,000 to $59,999187 $60,000 to $69,999125 $70,000 to $79,99991 $80,000 to $89,999196 $90,000 to $99,99963 $100,000 to $124,999149 $125,000 to $149,999278 $150,000 to $174,999528 $175,000 to $199,9991,358 $200,000 to $249,9991,750 $250,000 to $299,9995,416 $300,000 to $399,99910,998 $400,000 to $499,99911,152 $500,000 to $749,9992,321 $750,000 to $999,999888 $1,000,000 to $1,499,99956 $1,500,000 to $1,999,999218 $2,000,000 or moreRent paid by renters in 2022 in Eugene, OR 220 Less than $10095 $150 to $199270 $200 to $249126 $250 to $299131 $300 to $34944 $350 to $399386 $400 to $449434 $450 to $499460 $500 to $549831 $550 to $599889 $600 to $6491,659 $650 to $6991,039 $700 to $7492,397 $750 to $7992,824 $800 to $8993,483 $900 to $9997,485 $1,000 to $1,2497,695 $1,250 to $1,4996,450 $1,500 to $1,9991,136 $2,000 to $2,499594 $2,500 to $2,99993 $3,000 to $3,499350 $3,500 or more881 No cash rent
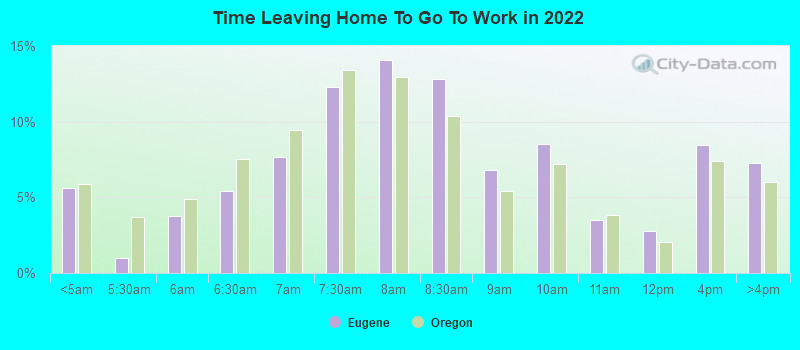
Percentage of workers working in this county: 95.9%Number of people working at home: 14,440 (15.8% of all workers )
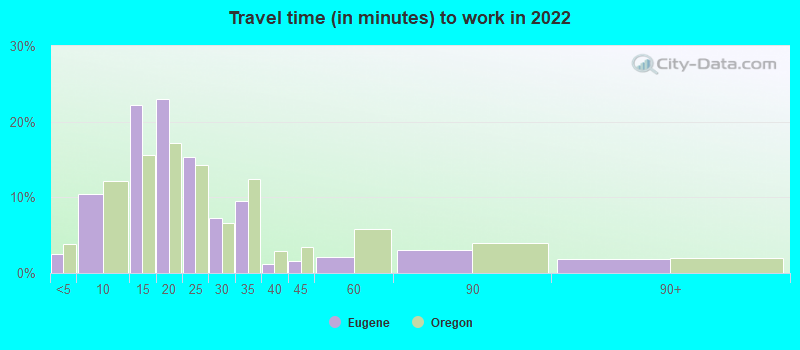
Travel time to work (commute)
Less than 5 minutes: 2,5095 to 9 minutes: 9,91710 to 14 minutes: 18,73415 to 19 minutes: 20,33920 to 24 minutes: 11,58125 to 29 minutes: 3,59230 to 34 minutes: 5,10435 to 39 minutes: 60640 to 44 minutes: 22045 to 59 minutes: 1,54860 to 89 minutes: 1,17790 or more minutes: 1,378
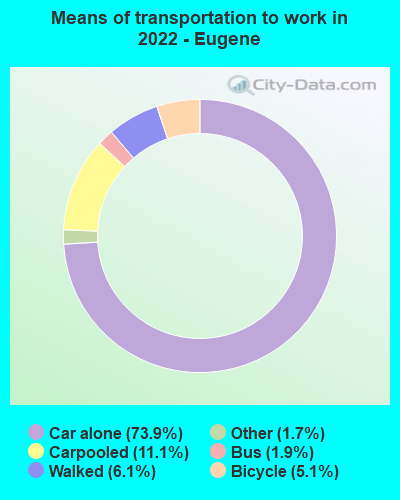
Means of transportation to work:
Drove a car alone: 66,797 (63.7%)Carpooled: 10,082 (9.6%)Bus : 1,740 (1.7%)Ferryboat: 83 (0.1%)Taxi: 1,549 (1.5%)Bicycle: 4,628 (4.4%)Walked: 5,553 (5.3%)Worked at home: 14,440 (13.8%)
Unemployment by race in 2022
Unemployment rate for White non-Hispanic residents 6.4% Males5.6% FemalesUnemployment rate for Black residents 12.8% Males8.4% FemalesUnemployment rate for American Indian and Alaska Native residents 0.9% Males1.6% FemalesUnemployment rate for Asian residents 3.1% Males8.2% FemalesUnemployment rate for other race residents 2.2% Males4.7% FemalesUnemployment rate for two or more race residents 5.1% Males8.5% FemalesUnemployment rate for Hispanic or Latino residents 8.6% Males4.4% Females
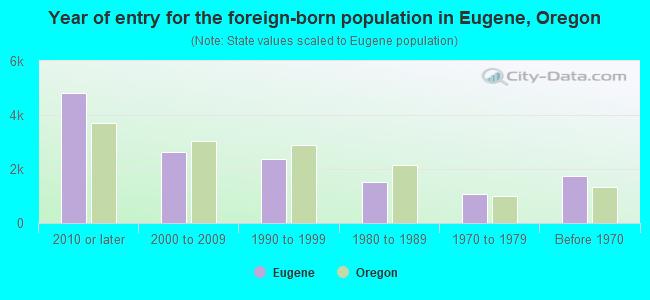
Year of entry for the foreign-born population in Eugene, Oregon
4,805 2010 or later 2,627 2000 to 2009 2,375 1990 to 1999 1,524 1980 to 1989 1,081 1970 to 1979 1,725 Before 1970
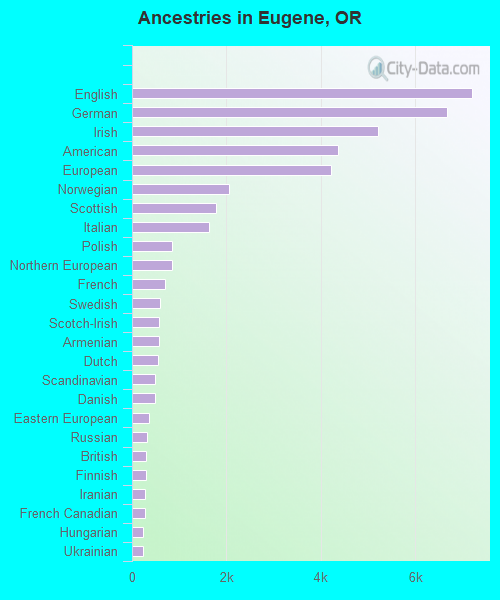
First ancestries reported:
English: 7,198 (10.9%)
German: 6,679 (10.1%)
Irish: 5,213 (7.9%)
American: 4,369 (6.6%)
European: 4,210 (6.4%)
Norwegian: 2,049 (3.1%)
Scottish: 1,778 (2.7%)
Italian: 1,624 (2.5%)
Polish: 853 (1.3%)
Northern European: 848 (1.3%)
French: 697 (1.1%)
Swedish: 601 (0.9%)
Scotch-Irish: 577 (0.9%)
Armenian: 563 (0.9%)
Dutch: 545 (0.8%)
Scandinavian: 484 (0.7%)
Danish: 481 (0.7%)
Eastern European: 367 (0.6%)
Russian: 312 (0.5%)
British: 302 (0.5%)
Finnish: 290 (0.4%)
Iranian: 276 (0.4%)
French Canadian: 270 (0.4%)
Hungarian: 241 (0.4%)
Ukrainian: 225 (0.3%)
Portuguese: 204 (0.3%)
Czech: 184 (0.3%)
Welsh: 184 (0.3%)
Romanian: 145 (0.2%)
Austrian: 134 (0.2%)
Swiss: 133 (0.2%)
Ghanaian: 131 (0.2%)
Croatian: 120 (0.2%)
Greek: 111 (0.2%)
Jordanian: 102 (0.2%)
Icelander: 101 (0.2%)
Israeli: 91 (0.1%)
Canadian: 79 (0.1%)
West Indian: 76 (0.1%)
Afghan: 71 (0.1%)
African: 60 (0.09%)
Australian: 56 (0.08%)
Alsatian: 54 (0.08%)
Belgian: 48 (0.07%)
Basque: 48 (0.07%)
Arab: 47 (0.07%)
Ugandan: 42 (0.06%)
Estonian: 41 (0.06%)
Serbian: 32 (0.05%)
Palestinian: 29 (0.04%)
Turkish: 25 (0.04%)
Latvian: 25 (0.04%)
Slavic: 24 (0.04%)
Pennsylvania German: 23 (0.03%)
German Russian: 21 (0.03%)
New Zealander: 20 (0.03%)
Lebanese: 18 (0.03%)
Nigerian: 18 (0.03%)
Belizean: 18 (0.03%)
Jamaican: 12 (0.02%)
Cajun: 11 (0.02%)
Brazilian: 9 (0.01%)
Bulgarian: 8 (0.01%)
Czechoslovakian: 6 (0.01%)
Slovak: 5 (0.01%)
Kenyan: 5 (0.01%)
Slovene: 4 (0.01%)
Haitian: 4 (0.01%)
Most common places of birth for foreign-born residents (%): Mexico Eugene:
19.9% (2,464)Oregon:
33.9% (140,109)
China, excluding Hong Kong and Taiwan Eugene:
11.7% (1,447)Oregon:
5.2% (21,429)
Canada Eugene:
5.6% (687)Oregon:
3.7% (15,229)
Korea Eugene:
4.7% (582)Oregon:
2.8% (11,450)
Philippines Eugene:
3.6% (449)Oregon:
3.5% (14,530)
Japan Eugene:
3.1% (388)Oregon:
1.5% (6,259)
Costa Rica Eugene:
2.8% (346)Oregon:
0.2% (927)
Germany Eugene:
2.7% (336)Oregon:
1.9% (8,005)
Guatemala Eugene:
2.4% (299)Oregon:
1.7% (7,103)
Ghana Eugene:
2.3% (286)Oregon:
0.3% (1,247)
India Eugene:
1.9% (230)Oregon:
4.7% (19,604)
Russia Eugene:
1.8% (225)Oregon:
1.3% (5,229)
Iran Eugene:
1.8% (222)Oregon:
1.0% (4,122)
Nepal Eugene:
1.5% (187)Oregon:
0.4% (1,562)
Place of birth for U.S.-born residents:
This state: 71,231Other state: 92,586Northeast: 9,419Midwest: 17,804South: 11,627West: 53,736 76.1% of Eugene residents lived in the same house 1 years ago.
Out of people who lived in different houses, 33.8% lived in this county.
Out of people who lived in different counties, 39.9% lived in Oregon.
Eugene:
76.1%State average:
85.5%
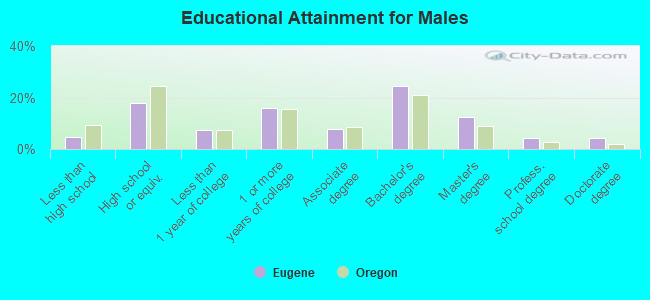
Education attainment for males 25 years and older:
No schooling: 314Nursery to 4th grade: 05th and 6th grade: 07th and 8th grade: 3499th grade: 39110th grade: 34611th grade: 70612th grade, no diploma: 551High school graduate (or equivalency): 10,081Less than 1 year of college: 4,220Some college more than 1 year, no degree: 8,914Associate degree: 4,443Bachelor's degree: 13,700Master's degree: 7,072Professional school degree: 2,487Doctorate degree: 2,467
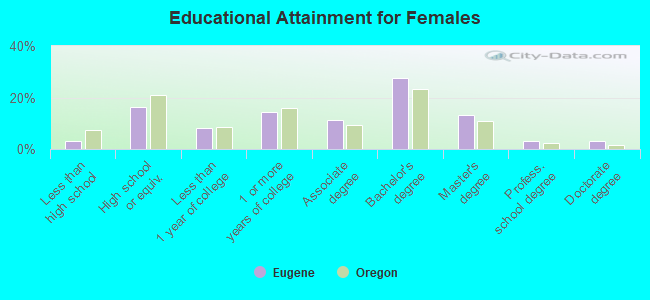
Education attainment for females 25 years and older:
No schooling: 397Nursery to 4th grade: 405th and 6th grade: 07th and 8th grade: 599th grade: 11310th grade: 41311th grade: 30712th grade, no diploma: 524High school graduate (or equivalency): 9,852Less than 1 year of college: 5,000Some college more than 1 year, no degree: 8,799Associate degree: 6,835Bachelor's degree: 16,777Master's degree: 7,969Professional school degree: 1,890Doctorate degree: 1,990
Housing units in structures:
One, detached: 40,473One, attached: 6,005Two: 2,6303 or 4: 4,4015 to 9: 5,35610 to 19: 6,46620 to 49: 3,22650 or more: 8,768Mobile homes: 2,527Median worth of mobile homes: $97,700
Housing units lacking complete plumbing facilities in 2022: 0.7%Housing units lacking complete kitchen facilities in 2022: 1.9%House/condo owner moved in on average 10 years ago
Renter moved in on average 1 years ago
Private vs. public school enrollment:
Students in private schools in grades 1 to 8 (elementary and middle school): 1,457 Students in private schools in grades 9 to 12 (high school): 366 Students in private undergraduate colleges: 944