Jump to a detailed profile or search site with Google Custom Search

Fleetwood, PA (Pennsylvania) Houses and Residents

Estimated median house or condo value in 2022: $227,636 (it was $99,900 in 2000)
Fleetwood:

$227,636
Pennsylvania:

$245,500
Lower value quartile - upper value quartile: $172,688 - $284,047

Total population: 4,078 (Urban population: 4,018, Rural population: 0)

Houses: 1,764 (1,726 occupied: 1,239 owner occupied, 487 renter occupied)

% of renters here:

28%
State:

31%

Housing density: 1,695 houses/condos per square mile

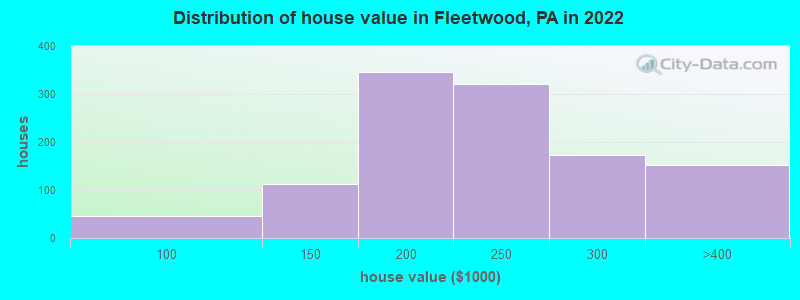
Median price asked for vacant for-sale houses and condos in 2022 in this county: $196,460.

Median contract rent in 2022: $826 (lower quartile is $714, upper quartile is $1,164)


Median rent asked for vacant for-rent units in 2022: $798


Median gross rent in Fleetwood, PA in 2022: $1,021

Housing units in Fleetwood with a mortgage: 834 (55 second mortgage, 9 home equity loan, 44 both second mortgage and home equity loan)
Houses without a mortgage: 169

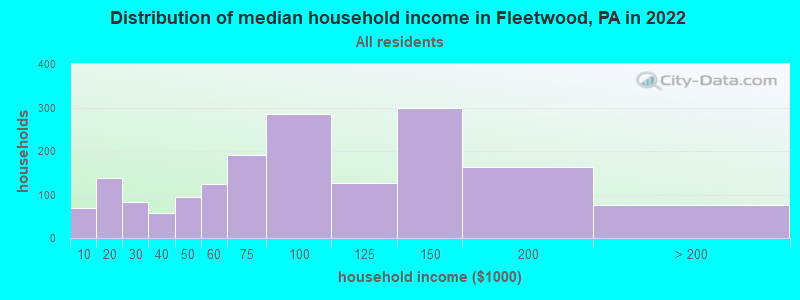
Median household income for houses/condos with a mortgage: $107,629

Median household income for apartments without a mortgage: $59,289

Median monthly housing costs: $1,246

Compare current foreclosures near Fleetwood, PA:

Check out more offers near Fleetwood, PA.
Powered by Foreclosure.com

Settings
X
Data:
Loading data...
Based on 2000-2022 data
Loading data...

123
Hide US histogram

Latest news about housing in Fleetwood, PA collected exclusively by city-data.com from local newspapers, TV, and radio stations

Fleetwood, Pennsylvania Age and Sex of Residents
Median year house/condo built: 1963

Median year apartment built: 1954

Household type by relationship:

Households: 4,064
  • Male householders: 795 (131 living alone), Female householders: 928 (408 living alone)
  • 668 spouses (661 opposite-sex spouses), 178 unmarried partners, (123 opposite-sex unmarried partners), 974 children (916 natural, 0 adopted, 58 stepchildren), 34 grandchildren, 16 brothers or sisters, 70 parents, 8 foster children, 48 other relatives, 314 non-relatives
  • In group quarters: 28

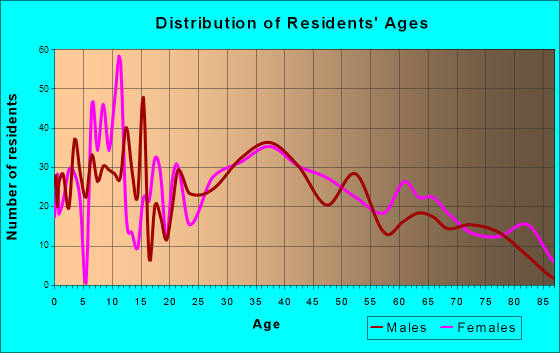
Size of family households: 598 2-persons, 133 3-persons, 162 4-persons, 90 5-persons, 29 6-persons, 14 7-or-more-persons.

Size of nonfamily households: 538 1-person, 60 2-persons, 107 3-persons.

254 married couples with children.
481 single-parent households (177 men, 304 women).

90.4% of residents of Fleetwood speak English at home.
4.7% of residents speak Spanish at home (100% speak English very well).
1.7% of residents speak other Indo-European language at home (64% speak English very well, 36% speak English well).

Foreign born population: 173 (4.3%)
(85.5% of them are naturalized citizens)

Median number of rooms in houses and condos:
Here:

6.5
State:

6.8

Median number of rooms in apartments
Here:

4.1
State:

4.3

Owner-occupied Renter-occupied
Bedrooms in owner-occupied houses and condos in Fleetwood, Pennsylvania
  • Bedrooms in owner-occupied houses and condos in Fleetwood, Pennsylvania
  • 0no bedroom
  • 161 bedroom
  • 1462 bedrooms
  • 6793 bedrooms
  • 3574 bedrooms
  • 415+ bedrooms
Bedrooms in renter-occupied apartments in Fleetwood, Pennsylvania
  • Bedrooms in renter-occupied apartments in Fleetwood, Pennsylvania
  • 28no bedroom
  • 2431 bedroom
  • 562 bedrooms
  • 1293 bedrooms
  • 314 bedrooms
  • 05+ bedrooms
Owner-occupied Renter-occupied
Cars and other vehicles available in Fleetwood in owner-occupied houses/condos
  • Cars and other vehicles available in Fleetwood in owner-occupied houses/condos
  • 24no vehicle
  • 3131 vehicle
  • 6352 vehicles
  • 1493 vehicles
  • 824 vehicles
  • 375+ vehicles
Cars and other vehicles available in Fleetwood in renter-occupied apartments
  • Cars and other vehicles available in Fleetwood in renter-occupied apartments
  • 44no vehicle
  • 2451 vehicle
  • 1212 vehicles
  • 773 vehicles
  • 04 vehicles
  • 05+ vehicles
Owner-occupied Renter-occupied
Rooms in owner-occupied houses in Fleetwood, Pennsylvania
  • Rooms in owner-occupied houses in Fleetwood, Pennsylvania
  • 01 room
  • 02 rooms
  • 83 rooms
  • 784 rooms
  • 2185 rooms
  • 3616 rooms
  • 2157 rooms
  • 1498 rooms
  • 2099+ rooms
Rooms in renter-occupied apartments in Fleetwood, Pennsylvania
  • Rooms in renter-occupied apartments in Fleetwood, Pennsylvania
  • 281 room
  • 162 rooms
  • 1163 rooms
  • 1514 rooms
  • 105 rooms
  • 876 rooms
  • 597 rooms
  • 98 rooms
  • 119+ rooms
Year house built
Median 2022 house/condo value by year built
Median house/condo value by year householder moved into unit
Breakdown of mean house values by ages of householders
Owners and renters by unit type in Fleetwood, PA
  • Fleetwood, PA household income distribution

  • Distribution of median household income in Fleetwood, PA in 2022
  • 69Less than $10,000
  • 137$10,000 to $19,999
  • 82$20,000 to $29,999
  • 57$30,000 to $39,999
  • 94$40,000 to $49,999
  • 125$50,000 to $59,999
  • 190$60,000 to $74,999
  • 284$75,000 to $99,999
  • 127$100,000 to $124,999
  • 300$125,000 to $149,999
  • 163$150,000 to $199,999
  • 75$200,000 or more
  • Home value of owner - occupied houses in 2022 in Fleetwood, PA

  • Distribution of house value in Fleetwood, PA in 2022
  • 7$60,000 to $69,999
  • 4$70,000 to $79,999
  • 33$90,000 to $99,999
  • 44$100,000 to $124,999
  • 68$125,000 to $149,999
  • 242$150,000 to $174,999
  • 103$175,000 to $199,999
  • 320$200,000 to $249,999
  • 171$250,000 to $299,999
  • 152$300,000 to $399,999
  • Rent paid by renters in 2022 in Fleetwood, PA

  • Distribution of rent paid by renters in Fleetwood, PA in 2022
  • 3$150 to $199
  • 33$350 to $399
  • 4$400 to $449
  • 7$450 to $499
  • 46$650 to $699
  • 57$700 to $749
  • 44$750 to $799
  • 34$800 to $899
  • 23$900 to $999
  • 100$1,000 to $1,249
  • 39$1,250 to $1,499
  • 20$2,000 to $2,499
  • 9No cash rent
Time Leaving Home To Go To Work in 2022

Percentage of workers working in this county: 83.2%
Number of people working at home: 249 (10.4% of all workers)

Travel time (in minutes) to work in 2022

Travel time to work (commute)

  • Less than 5 minutes: 94
  • 5 to 9 minutes: 283
  • 10 to 14 minutes: 291
  • 15 to 19 minutes: 201
  • 20 to 24 minutes: 419
  • 25 to 29 minutes: 217
  • 30 to 34 minutes: 263
  • 35 to 39 minutes: 53
  • 40 to 44 minutes: 61
  • 45 to 59 minutes: 192
  • 60 to 89 minutes: 37
  • 90 or more minutes: 10
Means of transportation to work in 2022 - Fleetwood

Means of transportation to work:

  • Drove a car alone: 1,477 (73.6%)
  • Carpooled: 254 (12.6%)
  • Taxi: 36 (1.8%)
  • Walked: 11 (0.5%)
  • Worked at home: 249 (12.4%)
Class of Workers in 2022
  • Unemployment by race in 2022
  • Unemployment rate for White non-Hispanic residents
  • 1.7%Males
  • 1.2%Females
  • Unemployment rate for Black residents
  • 100.0%Females
Year of entry for the foreign-born population in Fleetwood, Pennsylvania
  • Year of entry for the foreign-born population in Fleetwood, Pennsylvania
  • 722010 or later
  • 232000 to 2009
  • 591990 to 1999
  • 191980 to 1989
  • 81970 to 1979
  • 51Before 1970
Ancestries in Fleetwood, PA

First ancestries reported:

  • German: 945 (47.7%)
  • Pennsylvania German: 152 (7.7%)
  • Polish: 97 (4.9%)
  • Irish: 95 (4.8%)
  • American: 89 (4.5%)
  • English: 86 (4.3%)
  • Italian: 84 (4.2%)
  • Dutch: 31 (1.6%)
  • Welsh: 21 (1.1%)
  • European: 14 (0.7%)
  • Lithuanian: 8 (0.4%)
  • Trinidadian and Tobagonian: 7 (0.4%)

Most common places of birth for foreign-born residents (%):

Nicaragua
Fleetwood:

77.5% (124)
Pennsylvania:

0.2% (1,752)

Dominican Republic
Fleetwood:

45.6% (73)
Pennsylvania:

9.2% (86,544)

Trinidad and Tobago
Fleetwood:

7.5% (12)
Pennsylvania:

0.8% (7,224)

Bangladesh
Fleetwood:

6.9% (11)
Pennsylvania:

0.9% (8,772)

England
Fleetwood:

5.6% (9)
Pennsylvania:

1.0% (9,205)

United Kingdom, excluding England and Scotland
Fleetwood:

5.0% (8)
Pennsylvania:

1.1% (10,331)

Place of birth for U.S.-born residents:

  • This state: 3,306
  • Other state: 541
  • Northeast: 327
  • Midwest: 28
  • South: 111
  • West: 63

96.0% of Fleetwood residents lived in the same house 1 years ago.
   Out of people who lived in different houses, 44.2% lived in this county.
   Out of people who lived in different counties, 77.8% lived in Pennsylvania.


Fleetwood:

96.0%
State average:

89.3%

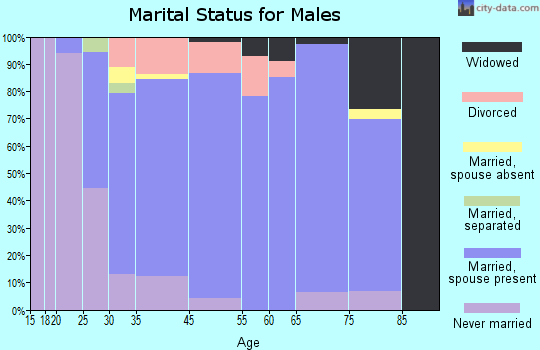
Education attainment for males 25 years and older:

  • No schooling: 0
  • Nursery to 4th grade: 0
  • 5th and 6th grade: 0
  • 7th and 8th grade: 0
  • 9th grade: 0
  • 10th grade: 29
  • 11th grade: 12
  • 12th grade, no diploma: 0
  • High school graduate (or equivalency): 831
  • Less than 1 year of college: 40
  • Some college more than 1 year, no degree: 223
  • Associate degree: 122
  • Bachelor's degree: 164
  • Master's degree: 59
  • Professional school degree: 11
  • Doctorate degree: 0
Educational Attainment for Males

Education attainment for females 25 years and older:

  • No schooling: 5
  • Nursery to 4th grade: 0
  • 5th and 6th grade: 0
  • 7th and 8th grade: 23
  • 9th grade: 0
  • 10th grade: 0
  • 11th grade: 5
  • 12th grade, no diploma: 17
  • High school graduate (or equivalency): 766
  • Less than 1 year of college: 63
  • Some college more than 1 year, no degree: 162
  • Associate degree: 155
  • Bachelor's degree: 223
  • Master's degree: 120
  • Professional school degree: 14
  • Doctorate degree: 28
Educational Attainment for Females
Fleetwood marital status for males
Fleetwood marital status for females

Housing units in structures:

  • One, detached: 954
  • One, attached: 484
  • Two: 92
  • 3 or 4: 109
  • 5 to 9: 40
  • 10 to 19: 13
  • 20 to 49: 69

House/condo owner moved in on average 17 years ago

Renter moved in on average 6 years ago

Year householders moved into residence in Fleetwood
Houses and condos Apartments
Most commonly used house heating fuel in houses and condos in Fleetwood, PA
  • 44.9%Utility gas
  • 32.0%Fuel oil, kerosene, etc.
  • 12.5%Electricity
  • 8.4%Bottled, tank, or LP gas
  • 2.3%Wood
Most commonly used house heating fuel in apartments in Fleetwood, PA
  • 51.7%Electricity
  • 37.4%Utility gas
  • 11.0%Fuel oil, kerosene, etc.

Private vs. public school enrollment:

Students in private schools in grades 1 to 8 (elementary and middle school): 11
Here:

2.7%
Pennsylvania:

15.7%

Students in private schools in grades 9 to 12 (high school): 8
Here:

2.7%
Pennsylvania:

13.4%

Students in private undergraduate colleges: 8
Here:

11.0%
Pennsylvania:

39.8%
School Enrollment by Level of School for Male Students
School Enrollment by Level of School for Female Students
Age and Sex of Sensory-Disabled Noninstitutionalized Residents
Age and Sex of Physically-Disabled Noninstitutionalized Residents
Age and Sex of Mentally-Disabled Noninstitutionalized Residents
Age and Sex of Self-Care Disabled Noninstitutionalized Residents
Age and Sex of Go-Outside-Home Disabled Noninstitutionalized Residents
Age and Sex of Noninstitutionalized Residents with Employment Disability