Florence, KY (Kentucky) Houses and Residents
Estimated median house or condo value in 2022: $203,576 (it was $99,800 in 2000 )
Florence:
$203,576Kentucky:
$196,300
Lower value quartile - upper value quartile: $150,702 - $261,076Mean price in 2022: Detached houses: $260,036 Here:
$260,036State:
$256,452
Townhouses or other attached units: $208,891 Here:
$208,891State:
$264,090
In 2-unit structures: $125,758 Here:
$125,758State:
$211,203
In 3-to-4-unit structures: $209,354 Here:
$209,354State:
$169,074
In 5-or-more-unit structures: $189,304 Here:
$189,304State:
$245,174
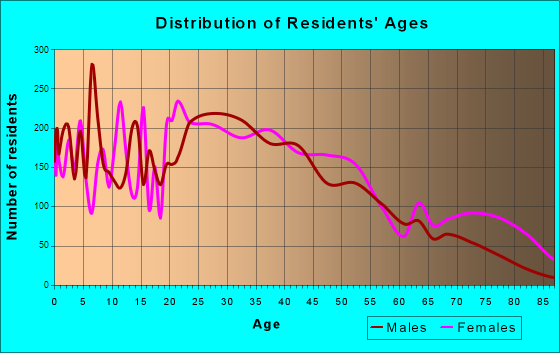
Total population: 31,888 (Urban population: 23,453, Rural population: 56 (all nonfarm) )
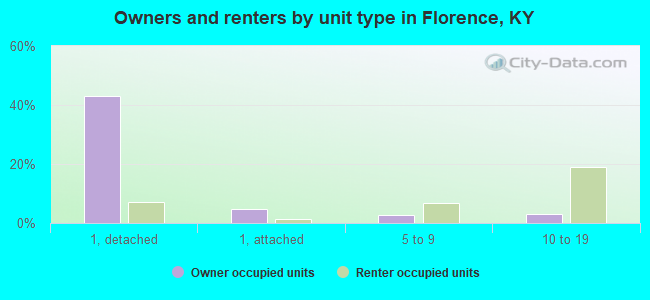
Houses: 14,869 (14,205 occupied: 8,173 owner occupied, 6,267 renter occupied )
% of renters here:
43%State:
31%
Housing density: 1,506 houses/condos per square mile
Median price asked for vacant for-sale houses and condos in 2022: $350,263.
Median contract rent in 2022: $1,035 (lower quartile is $804, upper quartile is $1,266)
Median rent asked for vacant for-rent units in 2022: $1,920
Median gross rent in Florence, KY in 2022: $1,192
Housing units in Florence with a mortgage: 5,698 (516 second mortgage, 26 home equity loan, 379 both second mortgage and home equity loan )Houses without a mortgage: 70
Median household income for houses/condos with a mortgage: $99,254
Median household income for apartments without a mortgage: $63,503
Median monthly housing costs: $1,128
Data:
Median house or condo value ($)
Median house or condo value ($ change since 2000)
Median house or condo value ($) - White
Median house or condo value ($) - Black or African American
Median house or condo value ($) - Asian
Median house or condo value ($) - Hispanic or Latino
Median house or condo value ($) - American Indian and Alaska Native
Median house or condo value ($) - Multirace
Median house or condo value ($) - Other Race
Median price asked for mobile homes ($)
Household density (households per square mile)
Mean house or condo value by units in structure - 1, detached ($)
Mean house or condo value by units in structure - 1, attached ($)
Mean house or condo value by units in structure - 2 ($)
Mean house or condo value by units in structure by units in structure - 3 or 4 ($)
Mean house or condo value by units in structure - 5 or more ($)
Mean house or condo value by units in structure - Boat, RV, van, etc. ($)
Mean house or condo value by units in structure - Mobile home ($)
Median contract rent ($)
Median contract rent - Lower quartile ($)
Median contract rent - Upper quartile ($)
Median gross rent ($)
Urban houses (%)
Rural houses (%)
Houses occupied (%)
Houses occupied (% change since 2000)
Houses owner occupied (%)
Houses owner occupied (% change since 2000)
Houses renter occupied (%)
Houses renter occupied (% change since 2000)
Vacant housing units - For rent (%)
Vacant housing units - For rent (% change since 2000)
Vacant housing units - For sale only (%)
Vacant housing units - For sale only (% change since 2000)
Vacant housing units - Rented or sold, not occupied (%)
Vacant housing units - Rented or sold, not occupied (% change since 2000)
Vacant housing units - For seasonal, recreational, or occasional use (%)
Vacant housing units - For seasonal, recreational, or occasional use (% change since 2000)
Vacant housing units - For migrant workers (%)
Vacant housing units - For migrant workers (% change since 2000)
Vacant housing units - Other vacant (%)
Vacant housing units - Other vacant (% change since 2000)
Median monthly housing costs ($)
Median household income for houses/condos with a mortgage ($)
Median household income for houses/condos without a mortgage ($)
Median household income ($)
Median household income ($) - White
Median household income ($) - Black or African American
Median household income ($) - Asian
Median household income ($) - Hispanic or Latino
Median household income ($) - American Indian and Alaska Native
Median household income ($) - Multirace
Median household income ($) - Other Race
Mortgage status - with mortgage (%)
Mortgage status - with second mortgage (%)
Mortgage status - with home equity loan (%)
Mortgage status - with both second mortgage and home equity loan (%)
Mortgage status - without a mortgage (%)
Median year house/condo built
Median year apartment built
Household type by relationship - Male householder living alone (%)
Household type by relationship - Male householder not living alone (%)
Household type by relationship - Female householder living alone (%)
Household type by relationship - Female householder not living alone (%)
Household type by relationship - Opposite-Sex spouse (%)
Household type by relationship - Same-Sex spouse (%)
Household type by relationship - Opposite-Sex unmarried partner (%)
Household type by relationship - Same-Sex unmarried partner (%)
Household type by relationship - In group quarters (%)
Size of family households - 2-person household (%)
Size of family households - 3-person household (%)
Size of family households - 4-person household (%)
Size of family households - 5-person household (%)
Size of family households - 6-person household (%)
Size of family households - 7-or-more-person household (%)
Size of nonfamily households - 1-person household (%)
Size of nonfamily households - 2-person household (%)
Size of nonfamily households - 3-person household (%)
Size of nonfamily households - 4-person household (%)
Size of nonfamily households - 5-person household (%)
Size of nonfamily households - 6-person household (%)
Size of nonfamily households - 7-or-moreperson household (%)
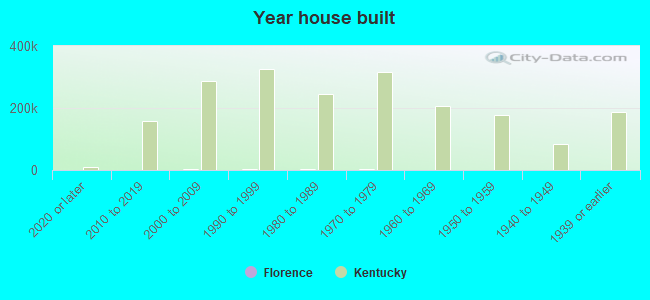
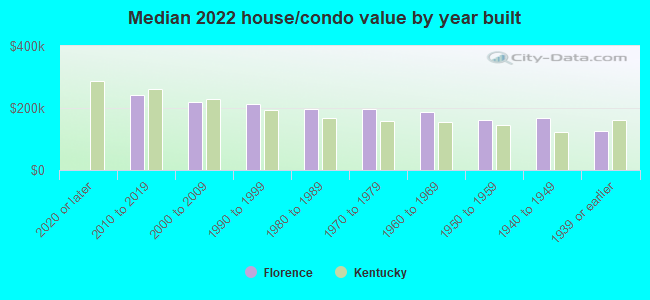
Year house built - Built 2010 or later (%)
Year house built - Built 2000 to 2009 (%)
Year house built - Built 1990 to 1999 (%)
Year house built - Built 1980 to 1989 (%)
Year house built - Built 1970 to 1979 (%)
Year house built - Built 1960 to 1969 (%)
Year house built - Built 1950 to 1959 (%)
Year house built - Built 1940 to 1949 (%)
Year house built - Built 1939 or earlier (%)
Median number of rooms in houses and condos
Median number of rooms in apartments
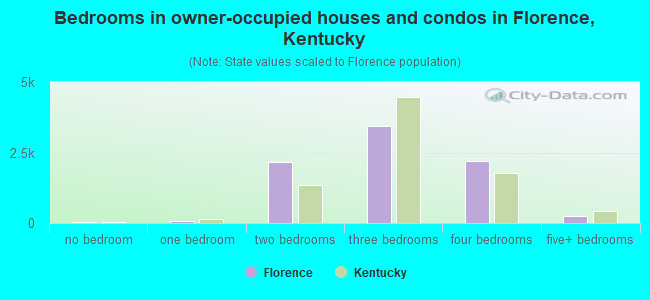
Median number of bedrooms in owner occupied houses
Mean number of bedrooms in owner occupied houses
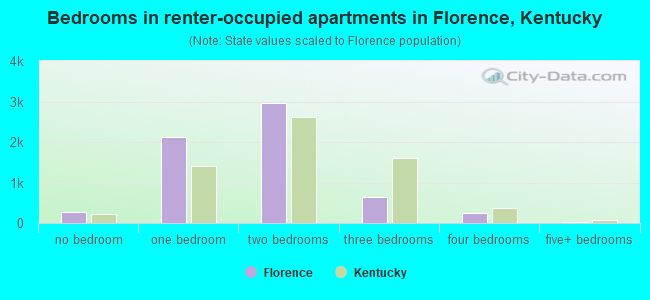
Median number of bedrooms in renter occupied houses
Mean number of bedrooms in renter occupied houses
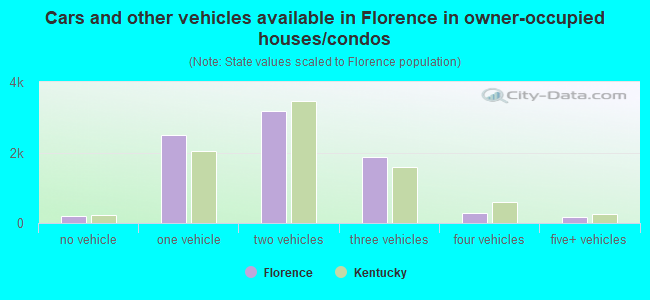
Median number of vehichles in owner occupied houses
Mean number of vehichles in owner occupied houses
Median number of vehichles in renter occupied houses
Mean number of vehichles in renter occupied houses
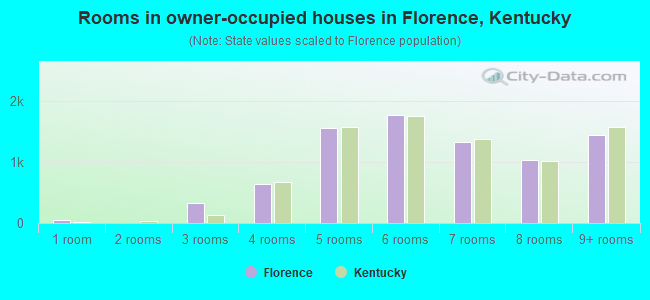
Rooms in owner-occupied houses - 1 room (%)
Rooms in owner-occupied houses - 2 rooms (%)
Rooms in owner-occupied houses - 3 rooms (%)
Rooms in owner-occupied houses - 4 rooms (%)
Rooms in owner-occupied houses - 5 rooms (%)
Rooms in owner-occupied houses - 6 rooms (%)
Rooms in owner-occupied houses - 7 rooms (%)
Rooms in owner-occupied houses - 8 rooms (%)
Rooms in owner-occupied houses - 9+ rooms (%)
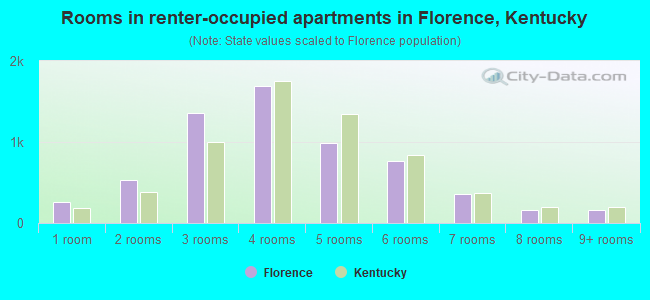
Rooms in renter-occupied houses - 1 room (%)
Rooms in renter-occupied houses - 2 rooms (%)
Rooms in renter-occupied houses - 3 rooms (%)
Rooms in renter-occupied houses - 4 rooms (%)
Rooms in renter-occupied houses - 5 rooms (%)
Rooms in renter-occupied houses - 6 rooms (%)
Rooms in renter-occupied houses - 7 rooms (%)
Rooms in renter-occupied houses - 8 rooms (%)
Rooms in renter-occupied houses - 9+ rooms (%)
Bedrooms in owner-occupied houses - no bedrooms (%)
Bedrooms in owner-occupied houses - 1 bedroom (%)
Bedrooms in owner-occupied houses - 2 bedrooms (%)
Bedrooms in owner-occupied houses - 3 bedrooms (%)
Bedrooms in owner-occupied houses - 4 bedrooms (%)
Bedrooms in owner-occupied houses - 5+ bedrooms (%)
Bedrooms in renter-occupied houses - no bedrooms (%)
Bedrooms in renter-occupied houses - 1 bedroom (%)
Bedrooms in renter-occupied houses - 2 bedrooms (%)
Bedrooms in renter-occupied houses - 3 bedrooms (%)
Bedrooms in renter-occupied houses - 4 bedrooms (%)
Bedrooms in renter-occupied houses - 5+ bedrooms (%)
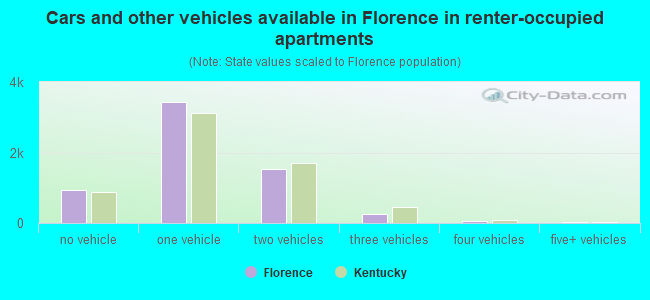
Vehicles available in owner-occupied houses - no vehicle available (%)
Vehicles available in owner-occupied houses - 1 vehicle available(%)
Vehicles available in owner-occupied houses - 2 Vehicles available (%)
Vehicles available in owner-occupied houses - 3 Vehicles available (%)
Vehicles available in owner-occupied houses - 4 Vehicles available (%)
Vehicles available in owner-occupied houses - 5+ Vehicles available (%)
Vehicles available in renter-occupied houses - no vehicle available (%)
Vehicles available in renter-occupied houses - 1 vehicle available (%)
Vehicles available in renter-occupied houses - 2 Vehicles available (%)
Vehicles available in renter-occupied houses - 3 Vehicles available (%)
Vehicles available in renter-occupied houses - 4 Vehicles available (%)
Vehicles available in renter-occupied houses - 5+ Vehicles available (%)
Housing units in structures - 1, detached (%)
Housing units in structures - 1, attached (%)
Housing units in structures - 2 (%)
Housing units in structures - 3 or 4 (%)
Housing units in structures - 5 to 9 (%)
Housing units in structures - 10 to 19 (%)
Housing units in structures - 20 to 49 (%)
Housing units in structures - 50 or more (%)
Housing units in structures - Mobile home (%)
Housing units in structures - Boat, RV, van, etc. (%)
Housing units in structures - Owners - 1, detached (%)
Housing units in structures - Owners - 1, attached (%)
Housing units in structures - Owners - 2 (%)
Housing units in structures - Owners - 3 or 4 (%)
Housing units in structures - Owners - 5 to 9 (%)
Housing units in structures - Owners - 10 to 19 (%)
Housing units in structures - Owners - 20 to 49 (%)
Housing units in structures - Owners - 50 or more (%)
Housing units in structures - Owners - Mobile home (%)
Housing units in structures - Owners - Boat, RV, van, etc. (%)
Housing units in structures - Renters - 1, detached (%)
Housing units in structures - Renters - 1, attached (%)
Housing units in structures - Renters - 2 (%)
Housing units in structures - Renters - 3 or 4 (%)
Housing units in structures - Renters - 5 to 9 (%)
Housing units in structures - Renters - 10 to 19 (%)
Housing units in structures - Renters - 20 to 49 (%)
Housing units in structures - Renters - 50 or more (%)
Housing units in structures - Renters - Mobile home (%)
Housing units in structures - Renters - Boat, RV, van, etc. (%)
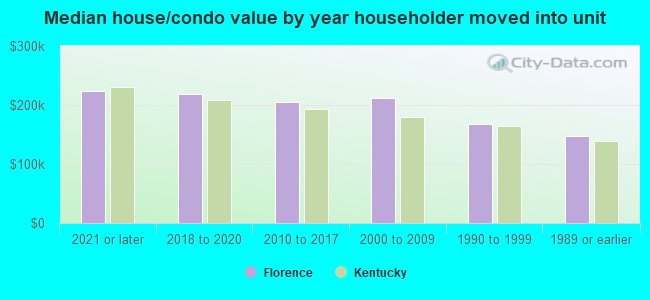
House/condo owner moved in on average (years ago)
Renter moved in on average (years ago)
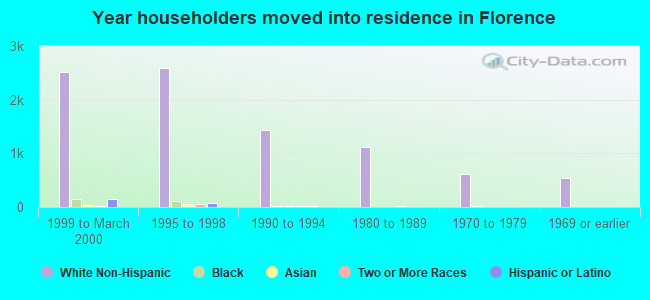
Year householder moved into unit - Moved in 1999 to March 2000 (%)
Year householder moved into unit - Moved in 1999 to March 2000 (%) - White
Year householder moved into unit - Moved in 1999 to March 2000 (%) - Black or African American
Year householder moved into unit - Moved in 1999 to March 2000 (%) - Asian
Year householder moved into unit - Moved in 1999 to March 2000 (%) - Hispanic or Latino
Year householder moved into unit - Moved in 1999 to March 2000 (%) - American Indian and Alaska Native
Year householder moved into unit - Moved in 1999 to March 2000 (%) - Multirace
Year householder moved into unit - Moved in 1999 to March 2000 (%) - Other Race
Year householder moved into unit - Moved in 1995 to 1998 (%)
Year householder moved into unit - Moved in 1995 to 1998 (%) - White
Year householder moved into unit - Moved in 1995 to 1998 (%) - Black or African American
Year householder moved into unit - Moved in 1995 to 1998 (%) - Asian
Year householder moved into unit - Moved in 1995 to 1998 (%) - Hispanic or Latino
Year householder moved into unit - Moved in 1995 to 1998 (%) - American Indian and Alaska Native
Year householder moved into unit - Moved in 1995 to 1998 (%) - Multirace
Year householder moved into unit - Moved in 1995 to 1998 (%) - Other Race
Year householder moved into unit - Moved in 1990 to 1994 (%)
Year householder moved into unit - Moved in 1990 to 1994 (%) - White
Year householder moved into unit - Moved in 1990 to 1994 (%) - Black or African American
Year householder moved into unit - Moved in 1990 to 1994 (%) - Asian
Year householder moved into unit - Moved in 1990 to 1994 (%) - Hispanic or Latino
Year householder moved into unit - Moved in 1990 to 1994 (%) - American Indian and Alaska Native
Year householder moved into unit - Moved in 1990 to 1994 (%) - Multirace
Year householder moved into unit - Moved in 1990 to 1994 (%) - Other Race
Year householder moved into unit - Moved in 1980 to 1989 (%)
Year householder moved into unit - Moved in 1980 to 1989 (%) - White
Year householder moved into unit - Moved in 1980 to 1989 (%) - Black or African American
Year householder moved into unit - Moved in 1980 to 1989 (%) - Asian
Year householder moved into unit - Moved in 1980 to 1989 (%) - Hispanic or Latino
Year householder moved into unit - Moved in 1980 to 1989 (%) - American Indian and Alaska Native
Year householder moved into unit - Moved in 1980 to 1989 (%) - Multirace
Year householder moved into unit - Moved in 1980 to 1989 (%) - Other Race
Year householder moved into unit - Moved in 1970 to 1979 (%)
Year householder moved into unit - Moved in 1970 to 1979 (%) - White
Year householder moved into unit - Moved in 1970 to 1979 (%) - Black or African American
Year householder moved into unit - Moved in 1970 to 1979 (%) - Asian
Year householder moved into unit - Moved in 1970 to 1979 (%) - Hispanic or Latino
Year householder moved into unit - Moved in 1970 to 1979 (%) - American Indian and Alaska Native
Year householder moved into unit - Moved in 1970 to 1979 (%) - Multirace
Year householder moved into unit - Moved in 1970 to 1979 (%) - Other Race
Year householder moved into unit - Moved in 1969 or earlier (%)
Year householder moved into unit - Moved in 1969 or earlier (%) - White
Year householder moved into unit - Moved in 1969 or earlier (%) - Black or African American
Year householder moved into unit - Moved in 1969 or earlier (%) - Asian
Year householder moved into unit - Moved in 1969 or earlier (%) - Hispanic or Latino
Year householder moved into unit - Moved in 1969 or earlier (%) - American Indian and Alaska Native
Year householder moved into unit - Moved in 1969 or earlier (%) - Multirace
Year householder moved into unit - Moved in 1969 or earlier (%) - Other Race
Housing units lacking complete plumbing facilities (%)
Housing units lacking complete kitchen facilities (%)
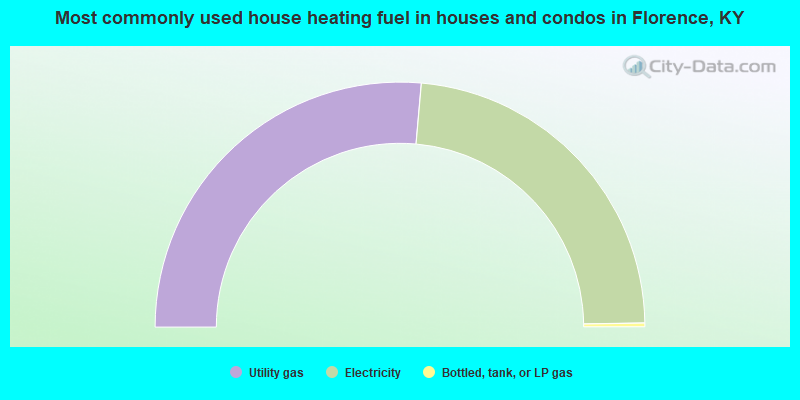
House heating fuel used in houses and condos - Utility gas (%)
House heating fuel used in houses and condos - Bottled, tank, or LP gas (%)
House heating fuel used in houses and condos - Electricity (%)
House heating fuel used in houses and condos - Fuel oil, kerosene, etc. (%)
House heating fuel used in houses and condos - Coal or coke (%)
House heating fuel used in houses and condos - Wood (%)
House heating fuel used in houses and condos - Solar energy (%)
House heating fuel used in houses and condos - Other fuel (%)
House heating fuel used in houses and condos - No fuel used (%)
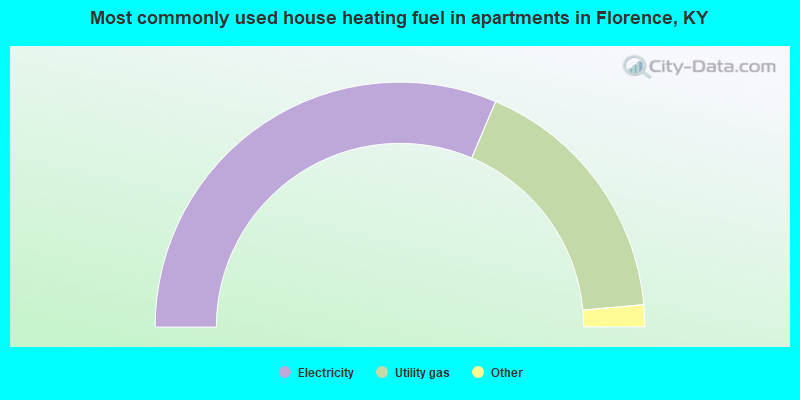
House heating fuel used in apartments - Utility gas (%)
House heating fuel used in apartments - Bottled, tank, or LP gas (%)
House heating fuel used in apartments - Electricity (%)
House heating fuel used in apartments - Fuel oil, kerosene, etc. (%)
House heating fuel used in apartments - Coal or coke (%)
House heating fuel used in apartments - Wood (%)
House heating fuel used in apartments - Solar energy (%)
House heating fuel used in apartments - Other fuel (%)
House heating fuel used in apartments - No fuel used (%)
Latest news about housing in Florence, KY collected exclusively by city-data.com from local newspapers, TV, and radio stations
Median year house/condo built: 1988Median year apartment built: 1981Household type by relationship:
Households: 32,748
Male householders: 6,941 (2,831 living alone ), Female householders: 7,115 (2,422 living alone )5,233 spouses (5,209 opposite-sex spouses ), 925 unmarried partners , (887 opposite-sex unmarried partners ), 8,717 children (8,274 natural , 119 adopted , 323 stepchildren ), 906 grandchildren , 204 brothers or sisters , 456 parents , 0 foster children , 531 other relatives , 1,292 non-relatives In group quarters: 423
Size of family households: 4,016 2-persons , 1,796 3-persons , 1,451 4-persons , 787 5-persons , 261 6-persons , 54 7-or-more-persons .
Size of nonfamily households: 4,674 1-person , 838 2-persons , 72 3-persons , 68 4-persons , 12 5-persons .
2,912 married couples with children. single-parent households (635 men , 1,982 women ).
90.1% of residents of Florence speak English at home. of residents speak Spanish at home (47% speak English very well , 36% speak English well , 1% speak English not well , 15% don't speak English at all ).of residents speak other Indo-European language at home (49% speak English very well , 28% speak English well , 16% speak English not well , 7% don't speak English at all ).of residents speak Asian or Pacific Island language at home (36% speak English very well , 32% speak English well , 30% speak English not well , 2% don't speak English at all ).of residents speak other language at home (49% speak English very well , 41% speak English well , 11% speak English not well ).
Foreign born population: 2,953 (9.0%)of them are naturalized citizens )
Median number of rooms in houses and condos:
Median number of rooms in apartments
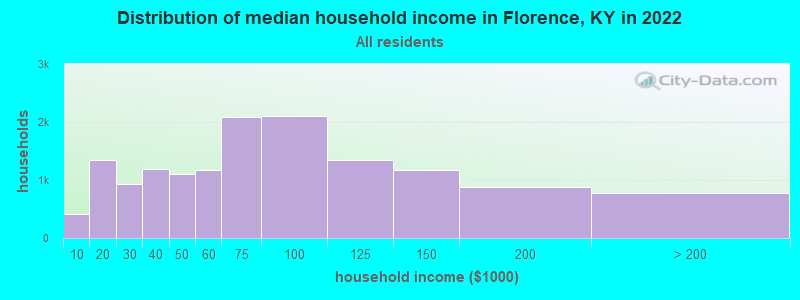
Florence, KY household income distribution 412 Less than $10,0001,350 $10,000 to $19,999929 $20,000 to $29,9991,190 $30,000 to $39,9991,105 $40,000 to $49,9991,171 $50,000 to $59,9992,092 $60,000 to $74,9992,099 $75,000 to $99,9991,351 $100,000 to $124,9991,176 $125,000 to $149,999874 $150,000 to $199,999773 $200,000 or more
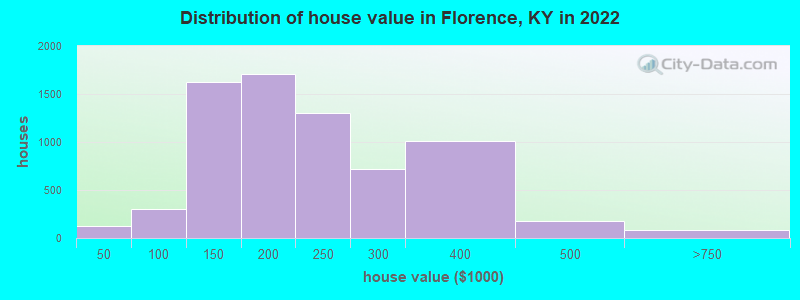
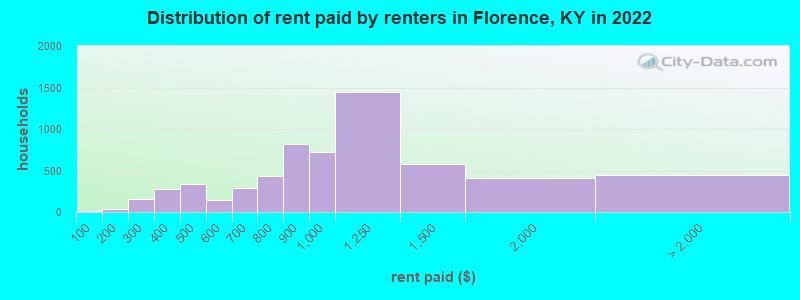
Home value of owner - occupied houses in 2022 in Florence, KY 16 $10,000 to $14,99966 $20,000 to $24,99924 $30,000 to $34,99921 $40,000 to $49,99915 $50,000 to $59,99911 $60,000 to $69,99918 $70,000 to $79,999110 $80,000 to $89,999125 $90,000 to $99,999843 $100,000 to $124,999786 $125,000 to $149,999611 $150,000 to $174,9991,095 $175,000 to $199,9991,305 $200,000 to $249,999721 $250,000 to $299,9991,009 $300,000 to $399,999176 $400,000 to $499,99981 $500,000 to $749,9995 $1,000,000 to $1,499,999Rent paid by renters in 2022 in Florence, KY 15 Less than $10038 $100 to $149112 $200 to $24941 $250 to $299195 $300 to $34979 $350 to $399232 $400 to $449100 $450 to $499112 $500 to $54935 $550 to $599128 $600 to $649159 $650 to $699258 $700 to $749172 $750 to $799816 $800 to $899728 $900 to $9991,447 $1,000 to $1,249573 $1,250 to $1,499408 $1,500 to $1,999196 $2,000 to $2,49929 $2,500 to $2,99945 $3,000 to $3,49980 $3,500 or more93 No cash rent
Percentage of workers working in this county: 62.7%Number of people working at home: 1,733 (10.6% of all workers )
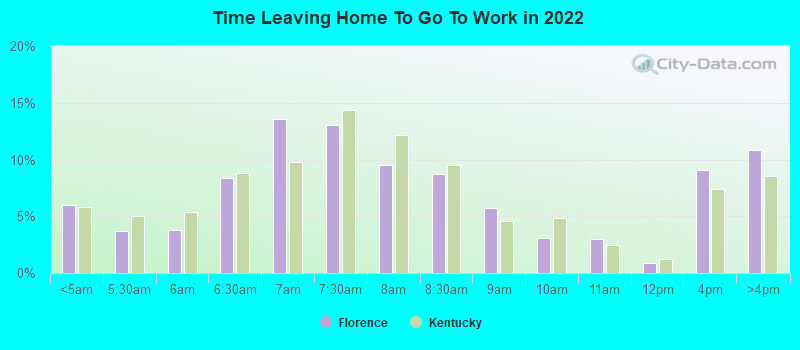
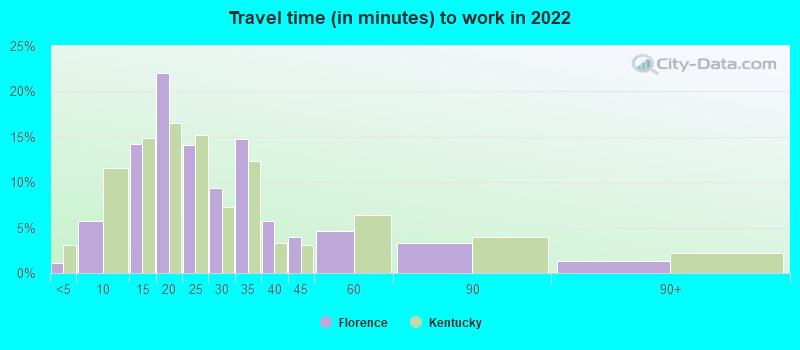
Travel time to work (commute)
Less than 5 minutes: 1675 to 9 minutes: 1,28310 to 14 minutes: 2,53415 to 19 minutes: 2,74920 to 24 minutes: 2,66225 to 29 minutes: 1,11230 to 34 minutes: 1,45535 to 39 minutes: 62940 to 44 minutes: 53945 to 59 minutes: 82260 to 89 minutes: 38190 or more minutes: 399
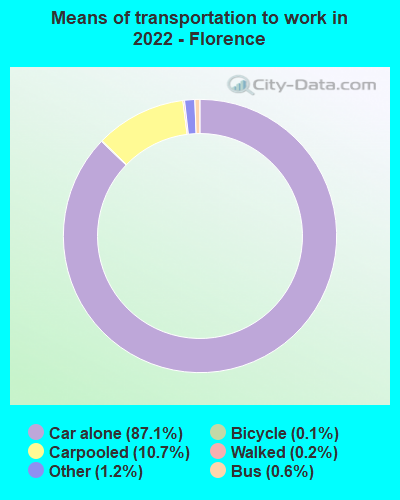
Means of transportation to work:
Drove a car alone: 21,027 (79.8%)Carpooled: 2,850 (10.8%)Bus : 97 (0.4%)Taxi: 352 (1.3%)Bicycle: 22 (0.1%)Walked: 51 (0.2%)Worked at home: 1,733 (6.6%)
Unemployment by race in 2022
Unemployment rate for White non-Hispanic residents 4.5% Males1.1% FemalesUnemployment rate for Black residents 5.5% FemalesUnemployment rate for other race residents 2.8% FemalesUnemployment rate for two or more race residents 8.3% FemalesUnemployment rate for Hispanic or Latino residents 4.1% Females
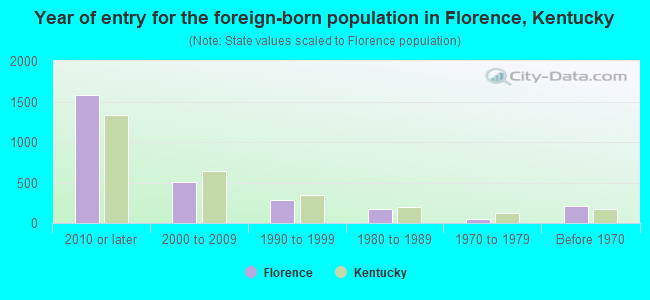
Year of entry for the foreign-born population in Florence, Kentucky
1,579 2010 or later 501 2000 to 2009 287 1990 to 1999 175 1980 to 1989 51 1970 to 1979 206 Before 1970
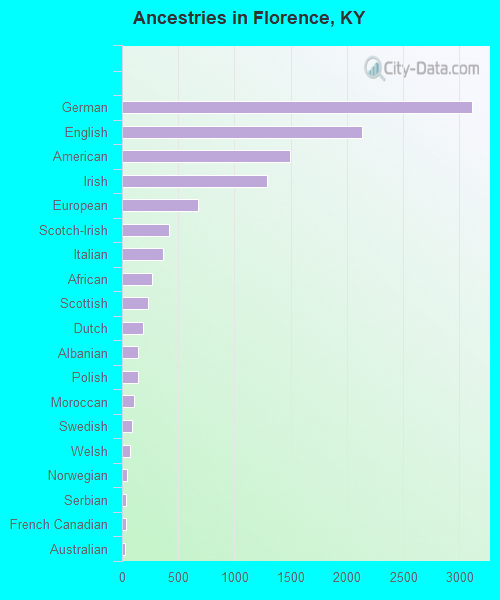
First ancestries reported:
German: 3,107 (20.6%)
English: 2,129 (14.1%)
American: 1,490 (9.9%)
Irish: 1,288 (8.5%)
European: 677 (4.5%)
Scotch-Irish: 420 (2.8%)
Italian: 361 (2.4%)
African: 267 (1.8%)
Scottish: 228 (1.5%)
Dutch: 185 (1.2%)
Albanian: 140 (0.9%)
Polish: 138 (0.9%)
Moroccan: 105 (0.7%)
Swedish: 85 (0.6%)
Welsh: 70 (0.5%)
Norwegian: 46 (0.3%)
Serbian: 35 (0.2%)
French Canadian: 32 (0.2%)
Australian: 31 (0.2%)
Yugoslavian: 28 (0.2%)
Arab: 26 (0.2%)
British: 25 (0.2%)
Hungarian: 23 (0.2%)
Jamaican: 22 (0.1%)
French: 19 (0.1%)
Canadian: 14 (0.09%)
Northern European: 13 (0.09%)
Portuguese: 11 (0.07%)
Russian: 9 (0.06%)
Scandinavian: 4 (0.03%) Most common places of birth for foreign-born residents (%): Mexico Florence:
18.8% (515)Kentucky:
15.8% (29,070)
India Florence:
14.4% (395)Kentucky:
7.3% (13,454)
Democratic Republic of Congo (Zaire) Florence:
10.4% (285)Kentucky:
1.9% (3,435)
Vietnam Florence:
6.6% (182)Kentucky:
2.0% (3,654)
Other Eastern Europe Florence:
5.5% (151)Kentucky:
0.6% (1,077)
Somalia Florence:
4.0% (110)Kentucky:
1.0% (1,776)
Philippines Florence:
3.7% (102)Kentucky:
3.3% (6,109)
Cameroon Florence:
3.7% (100)Kentucky:
0.2% (339)
Other Middle Africa Florence:
3.5% (97)Kentucky:
0.3% (539)
Morocco Florence:
2.7% (73)Kentucky:
0.6% (1,089)
China, excluding Hong Kong and Taiwan Florence:
2.6% (72)Kentucky:
4.2% (7,734)
Other Western Africa Florence:
1.7% (46)Kentucky:
0.3% (607)
Canada Florence:
1.6% (44)Kentucky:
2.3% (4,303)
Africa, n.e.c. Florence:
1.6% (43)Kentucky:
0.8% (1,445)
Taiwan Florence:
1.5% (42)Kentucky:
0.4% (804)
Place of birth for U.S.-born residents:
This state: 15,955Other state: 13,481Northeast: 759Midwest: 8,858South: 2,939West: 965 81.7% of Florence residents lived in the same house 1 years ago.
Out of people who lived in different houses, 20.2% lived in this county.
Out of people who lived in different counties, 58.3% lived in Kentucky.
Florence:
81.7%State average:
87.2%
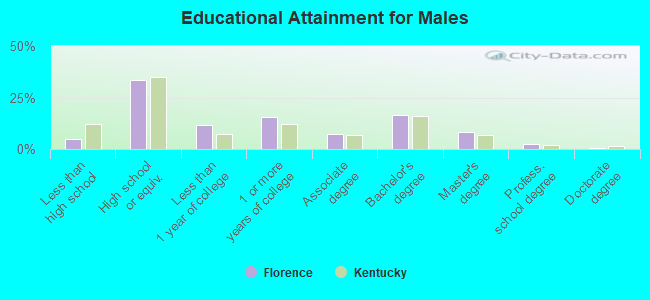
Education attainment for males 25 years and older:
No schooling: 36Nursery to 4th grade: 05th and 6th grade: 437th and 8th grade: 1059th grade: 4010th grade: 14211th grade: 3812th grade, no diploma: 136High school graduate (or equivalency): 3,755Less than 1 year of college: 1,320Some college more than 1 year, no degree: 1,730Associate degree: 802Bachelor's degree: 1,841Master's degree: 933Professional school degree: 288Doctorate degree: 58
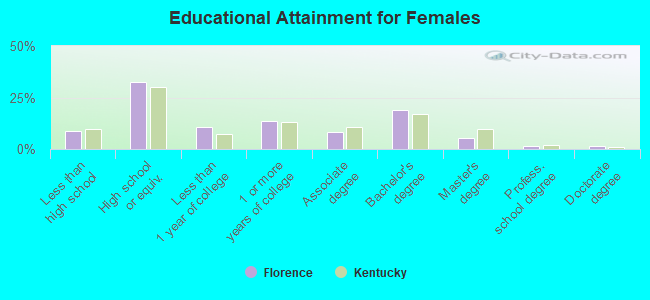
Education attainment for females 25 years and older:
No schooling: 142Nursery to 4th grade: 05th and 6th grade: 107th and 8th grade: 1149th grade: 4010th grade: 27511th grade: 9412th grade, no diploma: 344High school graduate (or equivalency): 3,808Less than 1 year of college: 1,241Some college more than 1 year, no degree: 1,592Associate degree: 944Bachelor's degree: 2,207Master's degree: 654Professional school degree: 148Doctorate degree: 172
Housing units in structures:
One, detached: 6,883One, attached: 870Two: 2303 or 4: 5295 to 9: 2,05310 to 19: 2,90920 to 49: 54150 or more: 825Mobile homes: 24Housing units lacking complete kitchen facilities in 2022: 1.3%House/condo owner moved in on average 11 years ago
Renter moved in on average 3 years ago
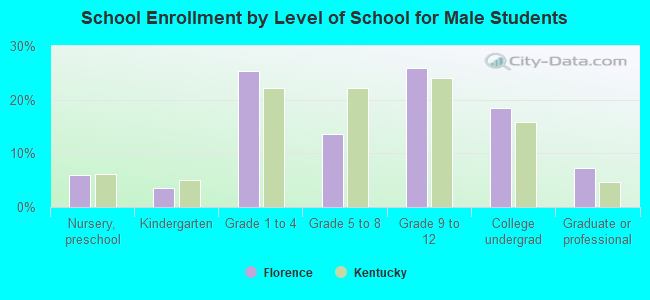
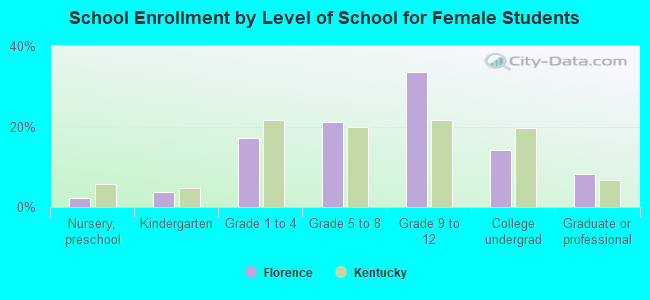
Private vs. public school enrollment:
Students in private schools in grades 1 to 8 (elementary and middle school): 121 Students in private schools in grades 9 to 12 (high school): 61 Students in private undergraduate colleges: 122