Garfield, NJ (New Jersey) Houses and Residents
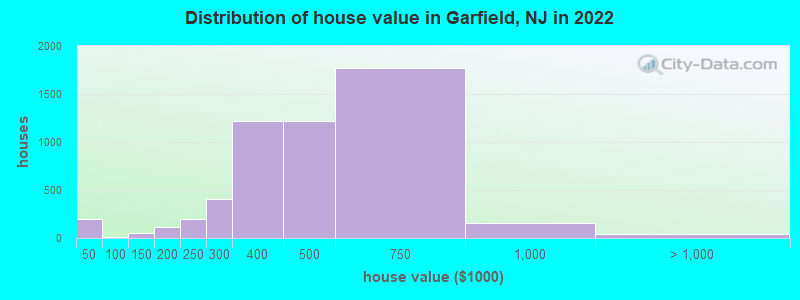
Estimated median house or condo value in 2022: $443,611 (it was $178,400 in 2000 )
Garfield:
$443,611New Jersey:
$428,900
Lower value quartile - upper value quartile: $331,809 - $556,392Mean price in 2022: Detached houses: $395,360 Here:
$395,360State:
$537,591
Townhouses or other attached units: $364,663 Here:
$364,663State:
$381,113
In 2-unit structures: $543,433 Here:
$543,433State:
$444,476
In 3-to-4-unit structures: $667,935 Here:
$667,935State:
$457,463
In 5-or-more-unit structures: $250,563 Here:
$250,563State:
$368,745
Mobile homes: $361,238 Here:
$361,238State:
$119,788
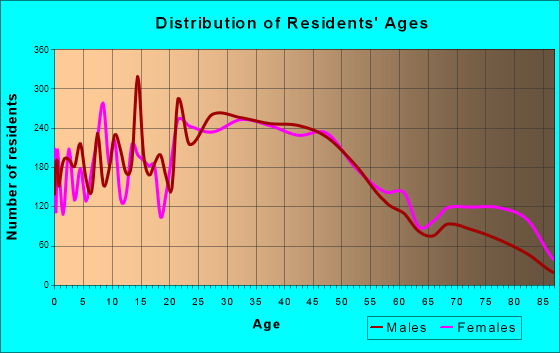
Total population: 31,486 (Urban population: 29,786, Rural population: 0)
Houses: 12,206 (11,616 occupied: 5,437 owner occupied, 6,240 renter occupied )
% of renters here:
53%State:
35%
Housing density: 5,727 houses/condos per square mile
Median price asked for vacant for-sale houses and condos in 2022: $4,276,343.
Median contract rent in 2022: $1,317 (lower quartile is $1,030, upper quartile is $1,678)
Median rent asked for vacant for-rent units in 2022: $1,497
Median gross rent in Garfield, NJ in 2022: $1,466
Housing units in Garfield with a mortgage: 3,174 (135 second mortgage, 0 home equity loan, 125 both second mortgage and home equity loan )Houses without a mortgage: 101
Median household income for houses/condos with a mortgage: $104,401
Median household income for apartments without a mortgage: $65,837
Median monthly housing costs: $1,523
Data:
Median house or condo value ($)
Median house or condo value ($ change since 2000)
Median house or condo value ($) - White
Median house or condo value ($) - Black or African American
Median house or condo value ($) - Asian
Median house or condo value ($) - Hispanic or Latino
Median house or condo value ($) - American Indian and Alaska Native
Median house or condo value ($) - Multirace
Median house or condo value ($) - Other Race
Median price asked for mobile homes ($)
Household density (households per square mile)
Mean house or condo value by units in structure - 1, detached ($)
Mean house or condo value by units in structure - 1, attached ($)
Mean house or condo value by units in structure - 2 ($)
Mean house or condo value by units in structure by units in structure - 3 or 4 ($)
Mean house or condo value by units in structure - 5 or more ($)
Mean house or condo value by units in structure - Boat, RV, van, etc. ($)
Mean house or condo value by units in structure - Mobile home ($)
Median contract rent ($)
Median contract rent - Lower quartile ($)
Median contract rent - Upper quartile ($)
Median gross rent ($)
Urban houses (%)
Rural houses (%)
Houses occupied (%)
Houses occupied (% change since 2000)
Houses owner occupied (%)
Houses owner occupied (% change since 2000)
Houses renter occupied (%)
Houses renter occupied (% change since 2000)
Vacant housing units - For rent (%)
Vacant housing units - For rent (% change since 2000)
Vacant housing units - For sale only (%)
Vacant housing units - For sale only (% change since 2000)
Vacant housing units - Rented or sold, not occupied (%)
Vacant housing units - Rented or sold, not occupied (% change since 2000)
Vacant housing units - For seasonal, recreational, or occasional use (%)
Vacant housing units - For seasonal, recreational, or occasional use (% change since 2000)
Vacant housing units - For migrant workers (%)
Vacant housing units - For migrant workers (% change since 2000)
Vacant housing units - Other vacant (%)
Vacant housing units - Other vacant (% change since 2000)
Median monthly housing costs ($)
Median household income for houses/condos with a mortgage ($)
Median household income for houses/condos without a mortgage ($)
Median household income ($)
Median household income ($) - White
Median household income ($) - Black or African American
Median household income ($) - Asian
Median household income ($) - Hispanic or Latino
Median household income ($) - American Indian and Alaska Native
Median household income ($) - Multirace
Median household income ($) - Other Race
Mortgage status - with mortgage (%)
Mortgage status - with second mortgage (%)
Mortgage status - with home equity loan (%)
Mortgage status - with both second mortgage and home equity loan (%)
Mortgage status - without a mortgage (%)
Median year house/condo built
Median year apartment built
Household type by relationship - Male householder living alone (%)
Household type by relationship - Male householder not living alone (%)
Household type by relationship - Female householder living alone (%)
Household type by relationship - Female householder not living alone (%)
Household type by relationship - Opposite-Sex spouse (%)
Household type by relationship - Same-Sex spouse (%)
Household type by relationship - Opposite-Sex unmarried partner (%)
Household type by relationship - Same-Sex unmarried partner (%)
Household type by relationship - In group quarters (%)
Size of family households - 2-person household (%)
Size of family households - 3-person household (%)
Size of family households - 4-person household (%)
Size of family households - 5-person household (%)
Size of family households - 6-person household (%)
Size of family households - 7-or-more-person household (%)
Size of nonfamily households - 1-person household (%)
Size of nonfamily households - 2-person household (%)
Size of nonfamily households - 3-person household (%)
Size of nonfamily households - 4-person household (%)
Size of nonfamily households - 5-person household (%)
Size of nonfamily households - 6-person household (%)
Size of nonfamily households - 7-or-moreperson household (%)
Year house built - Built 2010 or later (%)
Year house built - Built 2000 to 2009 (%)
Year house built - Built 1990 to 1999 (%)
Year house built - Built 1980 to 1989 (%)
Year house built - Built 1970 to 1979 (%)
Year house built - Built 1960 to 1969 (%)
Year house built - Built 1950 to 1959 (%)
Year house built - Built 1940 to 1949 (%)
Year house built - Built 1939 or earlier (%)
Median number of rooms in houses and condos
Median number of rooms in apartments
Median number of bedrooms in owner occupied houses
Mean number of bedrooms in owner occupied houses
Median number of bedrooms in renter occupied houses
Mean number of bedrooms in renter occupied houses
Median number of vehichles in owner occupied houses
Mean number of vehichles in owner occupied houses
Median number of vehichles in renter occupied houses
Mean number of vehichles in renter occupied houses
Rooms in owner-occupied houses - 1 room (%)
Rooms in owner-occupied houses - 2 rooms (%)
Rooms in owner-occupied houses - 3 rooms (%)
Rooms in owner-occupied houses - 4 rooms (%)
Rooms in owner-occupied houses - 5 rooms (%)
Rooms in owner-occupied houses - 6 rooms (%)
Rooms in owner-occupied houses - 7 rooms (%)
Rooms in owner-occupied houses - 8 rooms (%)
Rooms in owner-occupied houses - 9+ rooms (%)
Rooms in renter-occupied houses - 1 room (%)
Rooms in renter-occupied houses - 2 rooms (%)
Rooms in renter-occupied houses - 3 rooms (%)
Rooms in renter-occupied houses - 4 rooms (%)
Rooms in renter-occupied houses - 5 rooms (%)
Rooms in renter-occupied houses - 6 rooms (%)
Rooms in renter-occupied houses - 7 rooms (%)
Rooms in renter-occupied houses - 8 rooms (%)
Rooms in renter-occupied houses - 9+ rooms (%)
Bedrooms in owner-occupied houses - no bedrooms (%)
Bedrooms in owner-occupied houses - 1 bedroom (%)
Bedrooms in owner-occupied houses - 2 bedrooms (%)
Bedrooms in owner-occupied houses - 3 bedrooms (%)
Bedrooms in owner-occupied houses - 4 bedrooms (%)
Bedrooms in owner-occupied houses - 5+ bedrooms (%)
Bedrooms in renter-occupied houses - no bedrooms (%)
Bedrooms in renter-occupied houses - 1 bedroom (%)
Bedrooms in renter-occupied houses - 2 bedrooms (%)
Bedrooms in renter-occupied houses - 3 bedrooms (%)
Bedrooms in renter-occupied houses - 4 bedrooms (%)
Bedrooms in renter-occupied houses - 5+ bedrooms (%)
Vehicles available in owner-occupied houses - no vehicle available (%)
Vehicles available in owner-occupied houses - 1 vehicle available(%)
Vehicles available in owner-occupied houses - 2 Vehicles available (%)
Vehicles available in owner-occupied houses - 3 Vehicles available (%)
Vehicles available in owner-occupied houses - 4 Vehicles available (%)
Vehicles available in owner-occupied houses - 5+ Vehicles available (%)
Vehicles available in renter-occupied houses - no vehicle available (%)
Vehicles available in renter-occupied houses - 1 vehicle available (%)
Vehicles available in renter-occupied houses - 2 Vehicles available (%)
Vehicles available in renter-occupied houses - 3 Vehicles available (%)
Vehicles available in renter-occupied houses - 4 Vehicles available (%)
Vehicles available in renter-occupied houses - 5+ Vehicles available (%)
Housing units in structures - 1, detached (%)
Housing units in structures - 1, attached (%)
Housing units in structures - 2 (%)
Housing units in structures - 3 or 4 (%)
Housing units in structures - 5 to 9 (%)
Housing units in structures - 10 to 19 (%)
Housing units in structures - 20 to 49 (%)
Housing units in structures - 50 or more (%)
Housing units in structures - Mobile home (%)
Housing units in structures - Boat, RV, van, etc. (%)
Housing units in structures - Owners - 1, detached (%)
Housing units in structures - Owners - 1, attached (%)
Housing units in structures - Owners - 2 (%)
Housing units in structures - Owners - 3 or 4 (%)
Housing units in structures - Owners - 5 to 9 (%)
Housing units in structures - Owners - 10 to 19 (%)
Housing units in structures - Owners - 20 to 49 (%)
Housing units in structures - Owners - 50 or more (%)
Housing units in structures - Owners - Mobile home (%)
Housing units in structures - Owners - Boat, RV, van, etc. (%)
Housing units in structures - Renters - 1, detached (%)
Housing units in structures - Renters - 1, attached (%)
Housing units in structures - Renters - 2 (%)
Housing units in structures - Renters - 3 or 4 (%)
Housing units in structures - Renters - 5 to 9 (%)
Housing units in structures - Renters - 10 to 19 (%)
Housing units in structures - Renters - 20 to 49 (%)
Housing units in structures - Renters - 50 or more (%)
Housing units in structures - Renters - Mobile home (%)
Housing units in structures - Renters - Boat, RV, van, etc. (%)
House/condo owner moved in on average (years ago)
Renter moved in on average (years ago)
Year householder moved into unit - Moved in 1999 to March 2000 (%)
Year householder moved into unit - Moved in 1999 to March 2000 (%) - White
Year householder moved into unit - Moved in 1999 to March 2000 (%) - Black or African American
Year householder moved into unit - Moved in 1999 to March 2000 (%) - Asian
Year householder moved into unit - Moved in 1999 to March 2000 (%) - Hispanic or Latino
Year householder moved into unit - Moved in 1999 to March 2000 (%) - American Indian and Alaska Native
Year householder moved into unit - Moved in 1999 to March 2000 (%) - Multirace
Year householder moved into unit - Moved in 1999 to March 2000 (%) - Other Race
Year householder moved into unit - Moved in 1995 to 1998 (%)
Year householder moved into unit - Moved in 1995 to 1998 (%) - White
Year householder moved into unit - Moved in 1995 to 1998 (%) - Black or African American
Year householder moved into unit - Moved in 1995 to 1998 (%) - Asian
Year householder moved into unit - Moved in 1995 to 1998 (%) - Hispanic or Latino
Year householder moved into unit - Moved in 1995 to 1998 (%) - American Indian and Alaska Native
Year householder moved into unit - Moved in 1995 to 1998 (%) - Multirace
Year householder moved into unit - Moved in 1995 to 1998 (%) - Other Race
Year householder moved into unit - Moved in 1990 to 1994 (%)
Year householder moved into unit - Moved in 1990 to 1994 (%) - White
Year householder moved into unit - Moved in 1990 to 1994 (%) - Black or African American
Year householder moved into unit - Moved in 1990 to 1994 (%) - Asian
Year householder moved into unit - Moved in 1990 to 1994 (%) - Hispanic or Latino
Year householder moved into unit - Moved in 1990 to 1994 (%) - American Indian and Alaska Native
Year householder moved into unit - Moved in 1990 to 1994 (%) - Multirace
Year householder moved into unit - Moved in 1990 to 1994 (%) - Other Race
Year householder moved into unit - Moved in 1980 to 1989 (%)
Year householder moved into unit - Moved in 1980 to 1989 (%) - White
Year householder moved into unit - Moved in 1980 to 1989 (%) - Black or African American
Year householder moved into unit - Moved in 1980 to 1989 (%) - Asian
Year householder moved into unit - Moved in 1980 to 1989 (%) - Hispanic or Latino
Year householder moved into unit - Moved in 1980 to 1989 (%) - American Indian and Alaska Native
Year householder moved into unit - Moved in 1980 to 1989 (%) - Multirace
Year householder moved into unit - Moved in 1980 to 1989 (%) - Other Race
Year householder moved into unit - Moved in 1970 to 1979 (%)
Year householder moved into unit - Moved in 1970 to 1979 (%) - White
Year householder moved into unit - Moved in 1970 to 1979 (%) - Black or African American
Year householder moved into unit - Moved in 1970 to 1979 (%) - Asian
Year householder moved into unit - Moved in 1970 to 1979 (%) - Hispanic or Latino
Year householder moved into unit - Moved in 1970 to 1979 (%) - American Indian and Alaska Native
Year householder moved into unit - Moved in 1970 to 1979 (%) - Multirace
Year householder moved into unit - Moved in 1970 to 1979 (%) - Other Race
Year householder moved into unit - Moved in 1969 or earlier (%)
Year householder moved into unit - Moved in 1969 or earlier (%) - White
Year householder moved into unit - Moved in 1969 or earlier (%) - Black or African American
Year householder moved into unit - Moved in 1969 or earlier (%) - Asian
Year householder moved into unit - Moved in 1969 or earlier (%) - Hispanic or Latino
Year householder moved into unit - Moved in 1969 or earlier (%) - American Indian and Alaska Native
Year householder moved into unit - Moved in 1969 or earlier (%) - Multirace
Year householder moved into unit - Moved in 1969 or earlier (%) - Other Race
Housing units lacking complete plumbing facilities (%)
Housing units lacking complete kitchen facilities (%)
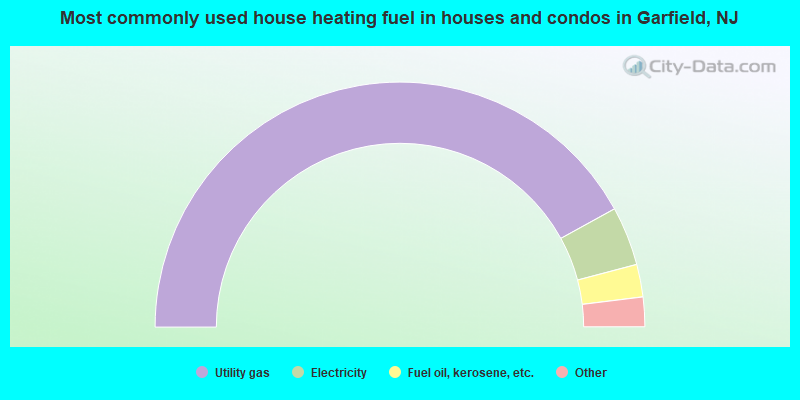
House heating fuel used in houses and condos - Utility gas (%)
House heating fuel used in houses and condos - Bottled, tank, or LP gas (%)
House heating fuel used in houses and condos - Electricity (%)
House heating fuel used in houses and condos - Fuel oil, kerosene, etc. (%)
House heating fuel used in houses and condos - Coal or coke (%)
House heating fuel used in houses and condos - Wood (%)
House heating fuel used in houses and condos - Solar energy (%)
House heating fuel used in houses and condos - Other fuel (%)
House heating fuel used in houses and condos - No fuel used (%)
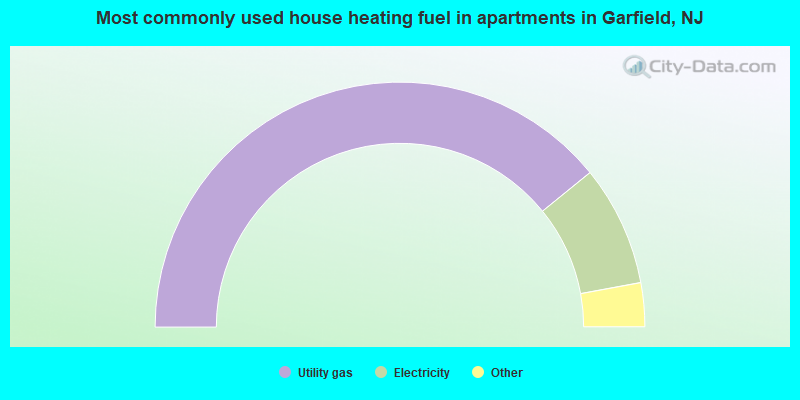
House heating fuel used in apartments - Utility gas (%)
House heating fuel used in apartments - Bottled, tank, or LP gas (%)
House heating fuel used in apartments - Electricity (%)
House heating fuel used in apartments - Fuel oil, kerosene, etc. (%)
House heating fuel used in apartments - Coal or coke (%)
House heating fuel used in apartments - Wood (%)
House heating fuel used in apartments - Solar energy (%)
House heating fuel used in apartments - Other fuel (%)
House heating fuel used in apartments - No fuel used (%)
Latest news about housing in Garfield, NJ collected exclusively by city-data.com from local newspapers, TV, and radio stations
Median year house/condo built: 1951Median year apartment built: 1958Household type by relationship:
Households: 32,463
Male householders: 5,856 (1,170 living alone ), Female householders: 5,684 (1,138 living alone )5,461 spouses (5,435 opposite-sex spouses ), 940 unmarried partners , (866 opposite-sex unmarried partners ), 10,310 children (10,005 natural , 32 adopted , 271 stepchildren ), 482 grandchildren , 442 brothers or sisters , 979 parents , 58 foster children , 996 other relatives , 1,210 non-relatives In group quarters: 37
Size of family households: 2,724 2-persons , 2,588 3-persons , 1,811 4-persons , 782 5-persons , 405 6-persons , 376 7-or-more-persons .
Size of nonfamily households: 2,387 1-person , 573 2-persons , 73 3-persons , 10 4-persons .
4,070 married couples with children. single-parent households (245 men , 1,350 women ).
32.4% of residents of Garfield speak English at home. of residents speak Spanish at home (54% speak English very well , 21% speak English well , 15% speak English not well , 9% don't speak English at all ).of residents speak other Indo-European language at home (50% speak English very well , 28% speak English well , 18% speak English not well , 4% don't speak English at all ).of residents speak Asian or Pacific Island language at home (53% speak English very well , 26% speak English well , 16% speak English not well , 5% don't speak English at all ).of residents speak other language at home (49% speak English very well , 45% speak English well , 6% speak English not well ).
Foreign born population: 15,501 (47.7%)of them are naturalized citizens )
Median number of rooms in houses and condos:
Median number of rooms in apartments
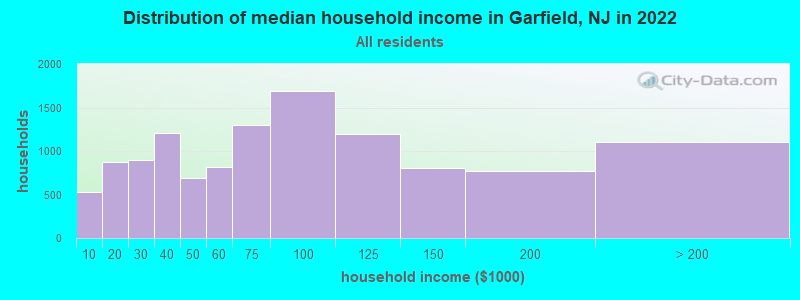
Garfield, NJ household income distribution 523 Less than $10,000869 $10,000 to $19,999893 $20,000 to $29,9991,202 $30,000 to $39,999685 $40,000 to $49,999812 $50,000 to $59,9991,299 $60,000 to $74,9991,686 $75,000 to $99,9991,192 $100,000 to $124,999801 $125,000 to $149,999775 $150,000 to $199,9991,104 $200,000 or more
Home value of owner - occupied houses in 2022 in Garfield, NJ 151 Less than $10,00043 $10,000 to $14,9996 $40,000 to $49,9998 $100,000 to $124,99948 $125,000 to $149,99975 $150,000 to $174,99938 $175,000 to $199,999192 $200,000 to $249,999402 $250,000 to $299,9991,222 $300,000 to $399,9991,216 $400,000 to $499,9991,769 $500,000 to $749,999160 $750,000 to $999,99914 $1,000,000 to $1,499,99925 $2,000,000 or moreRent paid by renters in 2022 in Garfield, NJ 10 $100 to $1499 $150 to $199158 $200 to $24947 $250 to $29952 $300 to $349120 $350 to $39924 $400 to $44981 $500 to $54952 $550 to $59914 $650 to $699111 $700 to $74952 $750 to $799226 $800 to $899422 $900 to $9991,353 $1,000 to $1,2491,207 $1,250 to $1,4991,802 $1,500 to $1,999243 $2,000 to $2,499140 $2,500 to $2,99928 $3,000 to $3,4998 $3,500 or more58 No cash rent
Percentage of workers working in this county: 60.4%Number of people working at home: 1,222 (7.2% of all workers )
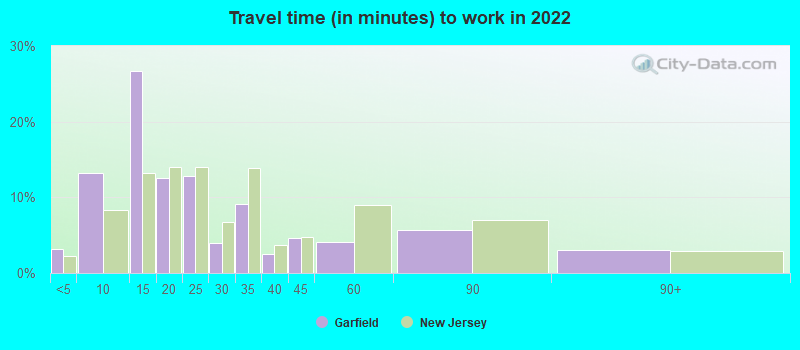
Travel time to work (commute)
Less than 5 minutes: 2915 to 9 minutes: 79310 to 14 minutes: 3,19715 to 19 minutes: 1,93220 to 24 minutes: 1,90825 to 29 minutes: 1,20130 to 34 minutes: 2,29335 to 39 minutes: 33140 to 44 minutes: 53445 to 59 minutes: 1,44660 to 89 minutes: 1,04590 or more minutes: 404
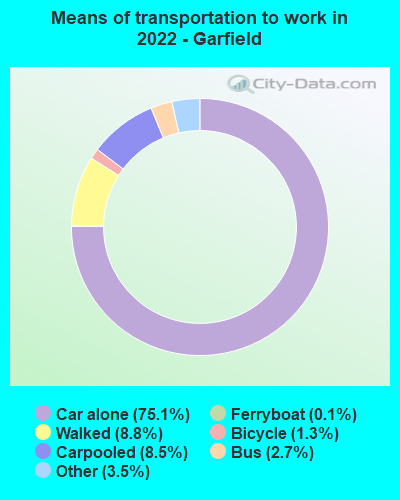
Means of transportation to work:
Drove a car alone: 4,481 (60.9%)Carpooled: 612 (8.3%)Bus : 147 (2.0%)Ferryboat: 7 (0.1%)Taxi: 237 (3.2%)Bicycle: 54 (0.7%)Walked: 561 (7.6%)Worked at home: 1,222 (16.6%)
Unemployment by race in 2022
Unemployment rate for White non-Hispanic residents 3.9% Males5.0% FemalesUnemployment rate for Black residents 6.6% MalesUnemployment rate for American Indian and Alaska Native residents 100.0% MalesUnemployment rate for Asian residents 3.7% Males3.4% FemalesUnemployment rate for other race residents 0.2% Males6.8% FemalesUnemployment rate for two or more race residents 3.3% Males2.3% FemalesUnemployment rate for Hispanic or Latino residents 1.7% Males3.3% Females
Year of entry for the foreign-born population in Garfield, New Jersey
4,765 2010 or later 3,747 2000 to 2009 3,799 1990 to 1999 2,991 1980 to 1989 1,358 1970 to 1979 1,499 Before 1970
First ancestries reported:
Polish: 4,373 (20.7%)
Italian: 1,470 (6.9%)
Macedonian: 732 (3.5%)
Albanian: 530 (2.5%)
American: 366 (1.7%)
Turkish: 341 (1.6%)
Yugoslavian: 244 (1.2%)
Irish: 243 (1.1%)
Jamaican: 229 (1.1%)
German: 209 (1.0%)
Portuguese: 187 (0.9%)
Bulgarian: 173 (0.8%)
Hungarian: 159 (0.8%)
Ukrainian: 156 (0.7%)
Slovak: 132 (0.6%)
Egyptian: 114 (0.5%)
Moroccan: 101 (0.5%)
Russian: 94 (0.4%)
English: 87 (0.4%)
Haitian: 86 (0.4%)
Syrian: 65 (0.3%)
Dutch: 63 (0.3%)
Slovene: 59 (0.3%)
Brazilian: 51 (0.2%)
Greek: 46 (0.2%)
Romanian: 41 (0.2%)
Croatian: 37 (0.2%)
Scotch-Irish: 27 (0.1%)
British West Indian: 23 (0.1%)
Scottish: 16 (0.08%)
Jordanian: 15 (0.07%)
Czech: 14 (0.07%)
British: 12 (0.06%)
Armenian: 11 (0.05%)
Czechoslovakian: 10 (0.05%)
Lebanese: 8 (0.04%)
Norwegian: 8 (0.04%)
Eastern European: 8 (0.04%)
Serbian: 7 (0.03%)
Iranian: 6 (0.03%)
European: 6 (0.03%)
French: 3 (0.01%)
Austrian: 2 (0.01%) Most common places of birth for foreign-born residents (%): Poland Garfield:
19.0% (2,941)New Jersey:
2.3% (48,811)
Dominican Republic Garfield:
13.6% (2,113)New Jersey:
9.7% (209,055)
Peru Garfield:
9.6% (1,482)New Jersey:
2.7% (58,563)
Mexico Garfield:
6.9% (1,067)New Jersey:
4.8% (102,527)
Colombia Garfield:
6.4% (985)New Jersey:
4.2% (90,817)
North Macedonia (Macedonia) Garfield:
5.3% (826)New Jersey:
0.2% (5,094)
Cuba Garfield:
4.6% (716)New Jersey:
2.1% (45,435)
Albania Garfield:
3.0% (465)New Jersey:
0.3% (6,130)
Ecuador Garfield:
2.8% (430)New Jersey:
4.4% (95,275)
Other Eastern Europe Garfield:
2.4% (373)New Jersey:
0.4% (7,791)
Turkey Garfield:
2.2% (340)New Jersey:
0.8% (16,778)
El Salvador Garfield:
2.1% (323)New Jersey:
2.3% (48,885)
Italy Garfield:
1.7% (262)New Jersey:
1.5% (33,198)
Place of birth for U.S.-born residents:
This state: 12,947Other state: 3,282Northeast: 2,768Midwest: 77South: 309West: 118 92.4% of Garfield residents lived in the same house 1 years ago.
Out of people who lived in different houses, 34.9% lived in this county.
Out of people who lived in different counties, 54.7% lived in New Jersey.
Garfield:
92.4%State average:
90.4%
Education attainment for males 25 years and older:
No schooling: 674Nursery to 4th grade: 1445th and 6th grade: 2427th and 8th grade: 2179th grade: 8110th grade: 8011th grade: 21512th grade, no diploma: 373High school graduate (or equivalency): 4,575Less than 1 year of college: 564Some college more than 1 year, no degree: 983Associate degree: 1,203Bachelor's degree: 1,545Master's degree: 549Professional school degree: 136Doctorate degree: 275
Education attainment for females 25 years and older:
No schooling: 585Nursery to 4th grade: 645th and 6th grade: 2517th and 8th grade: 2199th grade: 2710th grade: 8711th grade: 9212th grade, no diploma: 234High school graduate (or equivalency): 4,225Less than 1 year of college: 811Some college more than 1 year, no degree: 935Associate degree: 924Bachelor's degree: 1,653Master's degree: 756Professional school degree: 104Doctorate degree: 121
Housing units in structures:
One, detached: 2,564One, attached: 742Two: 5,8703 or 4: 1,2905 to 9: 59710 to 19: 28820 to 49: 35550 or more: 470Mobile homes: 26Housing units lacking complete kitchen facilities in 2022: 1.5%House/condo owner moved in on average 16 years ago
Renter moved in on average 5 years ago
Private vs. public school enrollment:
Students in private schools in grades 1 to 8 (elementary and middle school): 272 Here:
10.1%New Jersey:
12.3%
Students in private schools in grades 9 to 12 (high school): 56 Here:
4.8%New Jersey:
13.1%
Students in private undergraduate colleges: 359 Here:
23.4%New Jersey:
33.2%