Gibsonton, FL (Florida) Houses and Residents
| Gibsonton: | $306,185 |
| Florida: | $354,100 |
Mean price in 2022:
Detached houses: $408,558
Here: $408,558 State: $500,941 Townhouses or other attached units: $190,483
Here: $190,483 State: $370,869 In 5-or-more-unit structures: $236,219
Here: $236,219 State: $447,145 Mobile homes: $95,099
Here: $95,099 State: $113,202 Occupied boats, RVs, vans, etc.: $86,057
Here: $86,057 State: $73,933
Total population: 14,234 (Urban population: 8,283, Rural population: 477 (all nonfarm))
Houses: 6,524 (6,030 occupied: 4,175 owner occupied, 1,879 renter occupied)
| % of renters here: | 31% |
| State: | 33% |
Housing density: 508 houses/condos per square mile
Median price asked for vacant for-sale houses and condos in 2022: $233,773.
Median contract rent in 2022: $1,157 (lower quartile is $869, upper quartile is $1,385)
Median rent asked for vacant for-rent units in 2022: $1,353
Median gross rent in Gibsonton, FL in 2022: $1,313
Housing units in Gibsonton with a mortgage: 3,086 (192 second mortgage, 0 home equity loan, 197 both second mortgage and home equity loan)
Houses without a mortgage: 30
Median household income for houses/condos with a mortgage: $101,112
Median household income for apartments without a mortgage: $52,217
Median monthly housing costs: $1,504
Compare current foreclosures near Gibsonton, FL:
| Photo | Address | Area | Beds / Baths | Price | Details |
|---|---|---|---|---|---|

|
#1
Florence St
Gibsonton, FL 33534
|
1,596 sq. feet
|
2 baths 2 beds |
show details | |

|
#2
Midway St
Gibsonton, FL 33534
|
1,526 sq. feet
|
1 baths 3 beds |
show details | |

|
#3
Nundy Ave
Gibsonton, FL 33534
|
2,908 sq. feet
|
3 baths 3 beds |
show details | |

|
#4
Vern St
Gibsonton, FL 33534
|
1,050 sq. feet
|
1 baths 2 beds |
show details | |

|
#5
Citrus Leaf Dr
Gibsonton, FL 33534
|
3,216 sq. feet
|
4 baths 6 beds |
show details | |

|
#6
Cherry Blossom Trl
Gibsonton, FL 33534
|
1,292 sq. feet
|
2 baths 3 beds |
show details | |

|
#7
Cherry Blossom Trl
Gibsonton, FL 33534
|
2,726 sq. feet
|
3 baths 4 beds |
show details | |

|
#8
Nundy Ave
Gibsonton, FL 33534
|
1,872 sq. feet
|
2 baths 4 beds |
show details | |

|
#9
Cherry Blossom Trl
Gibsonton, FL 33534
|
1,912 sq. feet
|
2 baths 4 beds |
show details | |

|
#10
Payne Ave
Gibsonton, FL 33534
|
- sq. feet
|
- baths - beds |
show details |
| Photo | Address | Area | Beds / Baths | Price | Details |
|---|---|---|---|---|---|

|
#11
Merlot Sienna Ave
Gibsonton, FL 33534
|
- sq. feet
|
- baths - beds |
show details | |

|
#12
Grand Kempston Dr
Gibsonton, FL 33534
|
- sq. feet
|
- baths - beds |
show details | |

|
#13
Ohio Ave Lot 102
Gibsonton, FL 33534
|
- sq. feet
|
- baths - beds |
show details | |

|
#14
Brickleton Woods Ave
Gibsonton, FL 33534
|
- sq. feet
|
- baths - beds |
show details | |

|
#15
Tangle Branch Ln
Gibsonton, FL 33534
|
- sq. feet
|
- baths - beds |
show details | |

|
#16
Gibsonton Dr Lot 66
Gibsonton, FL 33534
|
- sq. feet
|
- baths - beds |
show details | |

|
#17
Gillingham Harbor Ln
Gibsonton, FL 33534
|
- sq. feet
|
- baths - beds |
show details | |

|
#18
Tangle Rush Dr
Gibsonton, FL 33534
|
- sq. feet
|
- baths - beds |
show details | |

|
#19
Harris Hawk Ave
Ruskin, FL 33570
|
1,926 sq. feet
|
2 baths 4 beds |
$370,000
|
show details |

|
#20
Blue Magnolia Rd
Brandon, FL 33510
|
1,231 sq. feet
|
2 baths 2 beds |
$200,000
|
show details |
| Photo | Address | Area | Beds / Baths | Price | Details |
|---|---|---|---|---|---|

|
#21
83rd Ave N Apt 120
Saint Petersburg, FL 33702
|
1,000 sq. feet
|
2 baths 2 beds |
$152,000
|
show details |

|
#22
Harbour Blue St
Ruskin, FL 33570
|
- sq. feet
|
3 baths 4 beds |
show details | |

|
#23
Park Meadowbrooke Dr
Riverview, FL 33578
|
2,807 sq. feet
|
3 baths 5 beds |
show details | |

|
#24
Cherry St NE
Saint Petersburg, FL 33703
|
1,919 sq. feet
|
3 baths 3 beds |
show details | |

|
#25
N Whittier St
Tampa, FL 33617
|
1,609 sq. feet
|
2 baths 3 beds |
show details | |

|
#26
Falconridge Rd
Lithia, FL 33547
|
2,578 sq. feet
|
3 baths 4 beds |
show details | |

|
#27
Freeport Rd
Riverview, FL 33578
|
2,172 sq. feet
|
2 baths 3 beds |
show details | |

|
#28
Martinmeadow Dr
Lithia, FL 33547
|
2,682 sq. feet
|
3 baths 4 beds |
show details | |

|
#29
E Frierson Ave
Tampa, FL 33610
|
1,175 sq. feet
|
2 baths 4 beds |
show details | |

|
#30
Valhalla Woods Dr
Riverview, FL 33579
|
- sq. feet
|
2 baths 3 beds |
show details |
| Photo | Address | Area | Beds / Baths | Price | Details |
|---|---|---|---|---|---|

|
#31
Redmond Brook Ln
Ruskin, FL 33570
|
2,341 sq. feet
|
2 baths 4 beds |
show details | |

|
#32
Fawn Brindle St
Riverview, FL 33578
|
- sq. feet
|
2 baths 3 beds |
show details | |

|
#33
S Valrico Rd
Valrico, FL 33594
|
3,568 sq. feet
|
2 baths 3 beds |
show details | |

|
#34
W Nassau St
Tampa, FL 33607
|
1,066 sq. feet
|
1 baths 2 beds |
show details | |

|
#35
Hawks View Dr
Ruskin, FL 33570
|
1,370 sq. feet
|
2 baths 3 beds |
show details | |

|
#36
N Gunlock Ave
Tampa, FL 33614
|
1,326 sq. feet
|
2 baths 3 beds |
show details | |

|
#37
N Highland Ave
Tampa, FL 33612
|
1,179 sq. feet
|
1 baths 2 beds |
show details | |

|
#38
Leland Groves Dr
Riverview, FL 33579
|
- sq. feet
|
3 baths 5 beds |
show details | |

|
#39
N Cortez Ave
Tampa, FL 33614
|
962 sq. feet
|
1 baths 2 beds |
show details | |

|
#40
Hemingway Cir
Tampa, FL 33602
|
2,537 sq. feet
|
2 baths 3 beds |
show details |
| Photo | Address | Area | Beds / Baths | Price | Details |
|---|---|---|---|---|---|

|
#41
W San Miguel St N
Tampa, FL 33629
|
1,413 sq. feet
|
1 baths 2 beds |
show details | |

|
#42
E Palm Ave Apt 14302
Tampa, FL 33605
|
598 sq. feet
|
1 baths 1 beds |
show details | |

|
#43
Falling Leaves Dr
Valrico, FL 33596
|
2,333 sq. feet
|
2 baths 4 beds |
show details | |

|
#44
Takomah Trl
Tampa, FL 33617
|
2,416 sq. feet
|
2 baths 5 beds |
show details | |

|
#45
Blane Dr
Tampa, FL 33617
|
1,760 sq. feet
|
2 baths 3 beds |
show details | |

|
#46
Clara Dr
Brandon, FL 33510
|
1,440 sq. feet
|
2 baths 3 beds |
show details | |

|
#47
Shangri La Dr
Seffner, FL 33584
|
1,836 sq. feet
|
2 baths 3 beds |
show details | |

|
#48
Bonita Bluff Ct
Ruskin, FL 33570
|
2,276 sq. feet
|
3 baths 4 beds |
show details | |

|
#49
Sand Ridge Dr
Valrico, FL 33594
|
1,847 sq. feet
|
2 baths 3 beds |
show details | |

|
Check over 1 million property listings on Foreclosure.com!
|
browse all offers | |||

Latest news about housing in Gibsonton, FL collected exclusively by city-data.com from local newspapers, TV, and radio stations

 | just bought a house at Valencia Lakes...what to expect?? (50 replies) |
| 120-150s houses? (43 replies) |
| Riverview - Big Bend area (54 replies) |
| Temple Terrace/Surrounding area apartments (14 replies) |
| Gibsonton FL. 33534 Good or Bad neighborhood for a young women new to the area (13 replies) |
| Moving to Tampa or Jacksonville (22 replies) |
Median year apartment built: 1989
Household type by relationship:
Households: 18,423- Male householders: 3,159 (617 living alone), Female householders: 2,835 (526 living alone)
3,032 spouses (3,004 opposite-sex spouses), 718 unmarried partners, (615 opposite-sex unmarried partners), 6,745 children (6,353 natural, 102 adopted, 289 stepchildren), 556 grandchildren, 116 brothers or sisters, 412 parents, 19 foster children, 369 other relatives, 457 non-relatives
Size of family households: 1,437 2-persons, 1,038 3-persons, 983 4-persons, 735 5-persons, 289 6-persons, 76 7-or-more-persons.
Size of nonfamily households: 1,100 1-person, 441 2-persons, 9 3-persons, 23 4-persons.
3,204 married couples with children.
1,670 single-parent households (545 men, 1,125 women).
66.8% of residents of Gibsonton speak English at home.
27.8% of residents speak Spanish at home (72% speak English very well, 10% speak English well, 9% speak English not well, 8% don't speak English at all).
2.6% of residents speak other Indo-European language at home (54% speak English very well, 33% speak English well, 12% speak English not well, 1% don't speak English at all).
1.3% of residents speak Asian or Pacific Island language at home (67% speak English very well, 6% speak English well, 6% speak English not well, 20% don't speak English at all).
0.3% of residents speak other language at home (100% speak English very well).
Foreign born population: 2,966 (16.1%)
(58.7% of them are naturalized citizens)
| Here: | 6.1 |
| State: | 5.9 |
| Here: | 4.5 |
| State: | 4.2 |

- Bedrooms in owner-occupied houses and condos in Gibsonton, Florida
- 8no bedroom
- 671 bedroom
- 4662 bedrooms
- 2,0773 bedrooms
- 1,3704 bedrooms
- 1875+ bedrooms

- Bedrooms in renter-occupied apartments in Gibsonton, Florida
- 40no bedroom
- 2011 bedroom
- 7812 bedrooms
- 6243 bedrooms
- 2344 bedrooms
- 05+ bedrooms

- Cars and other vehicles available in Gibsonton in owner-occupied houses/condos
- 41no vehicle
- 7991 vehicle
- 2,3652 vehicles
- 7493 vehicles
- 1634 vehicles
- 585+ vehicles

- Cars and other vehicles available in Gibsonton in renter-occupied apartments
- 190no vehicle
- 6951 vehicle
- 8022 vehicles
- 1733 vehicles
- 154 vehicles
- 45+ vehicles

- Rooms in owner-occupied houses in Gibsonton, Florida
- 81 room
- 272 rooms
- 633 rooms
- 3544 rooms
- 9975 rooms
- 1,1516 rooms
- 6207 rooms
- 6168 rooms
- 3389+ rooms

- Rooms in renter-occupied apartments in Gibsonton, Florida
- 261 room
- 632 rooms
- 3053 rooms
- 5074 rooms
- 4805 rooms
- 2366 rooms
- 2217 rooms
- 428 rooms
- 09+ rooms


Gibsonton, FL household income distribution

- 333Less than $10,000
- 470$10,000 to $19,999
- 486$20,000 to $29,999
- 331$30,000 to $39,999
- 533$40,000 to $49,999
- 452$50,000 to $59,999
- 321$60,000 to $74,999
- 924$75,000 to $99,999
- 601$100,000 to $124,999
- 774$125,000 to $149,999
- 418$150,000 to $199,999
- 372$200,000 or more

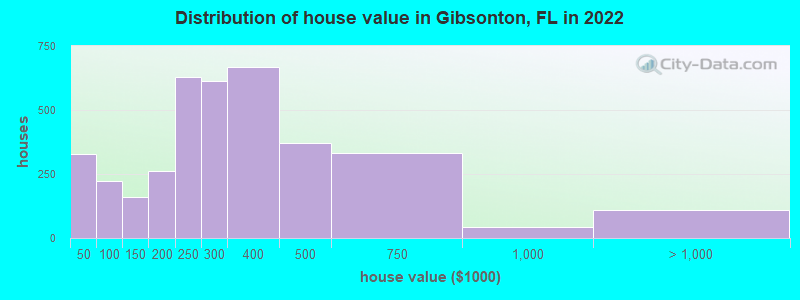
Home value of owner - occupied houses in 2022 in Gibsonton, FL
-
- 130Less than $10,000
- 9$10,000 to $14,999
- 14$15,000 to $19,999
- 13$20,000 to $24,999
- 30$25,000 to $29,999
- 10$30,000 to $34,999
- 15$35,000 to $39,999
- 101$40,000 to $49,999
- 28$50,000 to $59,999
- 17$60,000 to $69,999
- 17$70,000 to $79,999
- 7$80,000 to $89,999
- 49$90,000 to $99,999
- 63$100,000 to $124,999
- 95$125,000 to $149,999
- 134$150,000 to $174,999
- 126$175,000 to $199,999
- 626$200,000 to $249,999
- 612$250,000 to $299,999
- 667$300,000 to $399,999
- 371$400,000 to $499,999
- 333$500,000 to $749,999
- 42$750,000 to $999,999
- 69$1,000,000 to $1,499,999
- 38$2,000,000 or more
Rent paid by renters in 2022 in Gibsonton, FL
-
- 15$100 to $149
- 3$250 to $299
- 12$400 to $449
- 5$450 to $499
- 94$500 to $549
- 34$550 to $599
- 62$600 to $649
- 109$650 to $699
- 11$700 to $749
- 28$750 to $799
- 121$800 to $899
- 129$900 to $999
- 484$1,000 to $1,249
- 128$1,250 to $1,499
- 221$1,500 to $1,999
- 19$2,000 to $2,499
- 181$2,500 to $2,999
- 55No cash rent


Percentage of workers working in this county: 92.1%
Number of people working at home: 1,456 (16.5% of all workers)
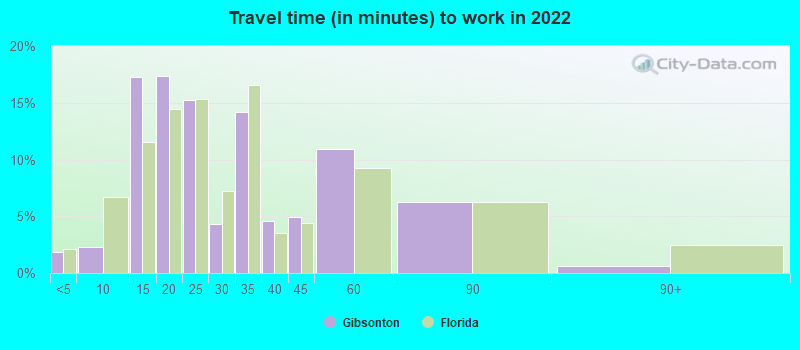
Travel time to work (commute)
- Less than 5 minutes: 93
- 5 to 9 minutes: 152
- 10 to 14 minutes: 543
- 15 to 19 minutes: 1,038
- 20 to 24 minutes: 1,151
- 25 to 29 minutes: 350
- 30 to 34 minutes: 1,048
- 35 to 39 minutes: 105
- 40 to 44 minutes: 713
- 45 to 59 minutes: 1,252
- 60 to 89 minutes: 485
- 90 or more minutes: 241

Means of transportation to work:
- Drove a car alone: 2,397 (57.2%)
- Carpooled: 361 (8.6%)
- Taxi: 106 (2.5%)
- Walked: 78 (1.9%)
- Worked at home: 1,456 (34.8%)

- Unemployment by race in 2022
- Unemployment rate for White non-Hispanic residents
- 5.0%Males
- 2.1%Females
- Unemployment rate for Black residents
- 4.2%Males
- 5.0%Females
- Unemployment rate for other race residents
- 0.6%Males
- 11.1%Females
- Unemployment rate for two or more race residents
- 8.8%Males
- 6.6%Females
- Unemployment rate for Hispanic or Latino residents
- 0.5%Males
- 13.0%Females

- Year of entry for the foreign-born population in Gibsonton, Florida
- 5952010 or later
- 5952000 to 2009
- 7931990 to 1999
- 1591980 to 1989
- 1381970 to 1979
- 77Before 1970

First ancestries reported:
- German: 346 (3.1%)
- American: 307 (2.7%)
- Italian: 222 (2.0%)
- English: 176 (1.6%)
- British West Indian: 171 (1.5%)
- Polish: 141 (1.3%)
- Haitian: 137 (1.2%)
- Irish: 124 (1.1%)
- British: 98 (0.9%)
- Guyanese: 58 (0.5%)
- Portuguese: 55 (0.5%)
- Greek: 54 (0.5%)
- West Indian: 54 (0.5%)
- French Canadian: 40 (0.4%)
- Nigerian: 33 (0.3%)
- European: 28 (0.2%)
- Jamaican: 24 (0.2%)
- French: 20 (0.2%)
- Trinidadian and Tobagonian: 18 (0.2%)
- Scotch-Irish: 16 (0.1%)
- Scottish: 12 (0.1%)
- Russian: 11 (0.10%)
- Slovak: 8 (0.07%)
- Dutch: 6 (0.05%)
Most common places of birth for foreign-born residents (%):
| Gibsonton: | 22.3% (634) |
| Florida: | 5.6% (257,152) |
| Gibsonton: | 7.8% (223) |
| Florida: | 22.0% (1,006,576) |
| Gibsonton: | 7.1% (202) |
| Florida: | 3.0% (137,727) |
| Gibsonton: | 5.9% (168) |
| Florida: | 7.5% (342,375) |
| Gibsonton: | 5.1% (146) |
| Florida: | 2.3% (105,066) |
| Gibsonton: | 4.6% (132) |
| Florida: | 2.1% (97,632) |
| Gibsonton: | 4.3% (123) |
| Florida: | 6.5% (298,669) |
| Gibsonton: | 3.8% (108) |
| Florida: | 1.1% (49,838) |
| Gibsonton: | 2.5% (70) |
| Florida: | 0.7% (33,556) |
| Gibsonton: | 2.5% (70) |
| Florida: | 0.5% (22,972) |
| Gibsonton: | 2.4% (68) |
| Florida: | 0.4% (16,570) |
| Gibsonton: | 2.2% (62) |
| Florida: | 5.7% (262,042) |
| Gibsonton: | 2.0% (57) |
| Florida: | 0.1% (3,183) |
| Gibsonton: | 1.9% (55) |
| Florida: | 0.2% (10,443) |
| Gibsonton: | 1.9% (55) |
| Florida: | 1.2% (56,071) |
| Gibsonton: | 1.9% (54) |
| Florida: | 2.4% (109,132) |
| Gibsonton: | 1.9% (53) |
| Florida: | 0.2% (8,980) |
| Gibsonton: | 1.8% (51) |
| Florida: | 1.8% (84,403) |
| Gibsonton: | 1.7% (49) |
| Florida: | 0.3% (15,079) |
| Gibsonton: | 1.7% (47) |
| Florida: | 5.0% (227,319) |
| Gibsonton: | 1.5% (44) |
| Florida: | 1.2% (54,272) |
Place of birth for U.S.-born residents:
- This state: 8,062
- Other state: 6,252
- Northeast: 2,056
- Midwest: 1,676
- South: 1,903
- West: 584
90.8% of Gibsonton residents lived in the same house 1 years ago.
Out of people who lived in different houses, 35.6% lived in this county.
Out of people who lived in different counties, 42.4% lived in Florida.
| Gibsonton: | 90.8% |
| State average: | 86.3% |
Education attainment for males 25 years and older:
- No schooling: 180
- Nursery to 4th grade: 29
- 5th and 6th grade: 110
- 7th and 8th grade: 78
- 9th grade: 74
- 10th grade: 107
- 11th grade: 186
- 12th grade, no diploma: 219
- High school graduate (or equivalency): 2,015
- Less than 1 year of college: 435
- Some college more than 1 year, no degree: 683
- Associate degree: 440
- Bachelor's degree: 671
- Master's degree: 313
- Professional school degree: 48
- Doctorate degree: 0

Education attainment for females 25 years and older:
- No schooling: 153
- Nursery to 4th grade: 65
- 5th and 6th grade: 111
- 7th and 8th grade: 72
- 9th grade: 127
- 10th grade: 123
- 11th grade: 123
- 12th grade, no diploma: 135
- High school graduate (or equivalency): 1,741
- Less than 1 year of college: 350
- Some college more than 1 year, no degree: 620
- Associate degree: 553
- Bachelor's degree: 1,083
- Master's degree: 280
- Professional school degree: 87
- Doctorate degree: 0

Housing units in structures:
- One, detached: 4,385
- One, attached: 146
- Two: 50
- 3 or 4: 125
- 5 to 9: 36
- 10 to 19: 61
- Mobile homes: 1,707
- Boats, RVs, vans, etc.: 12
Median worth of mobile homes: $103,593
Housing units lacking complete kitchen facilities in 2022: 0.8%
House/condo owner moved in on average 6 years ago
Renter moved in on average 1 years ago

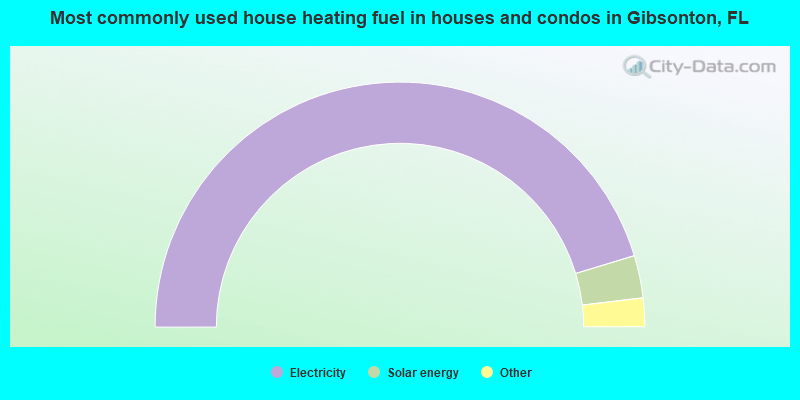
- 90.6%Electricity
- 5.6%Solar energy
- 2.1%No fuel used
- 1.3%Utility gas
- 0.3%Bottled, tank, or LP gas
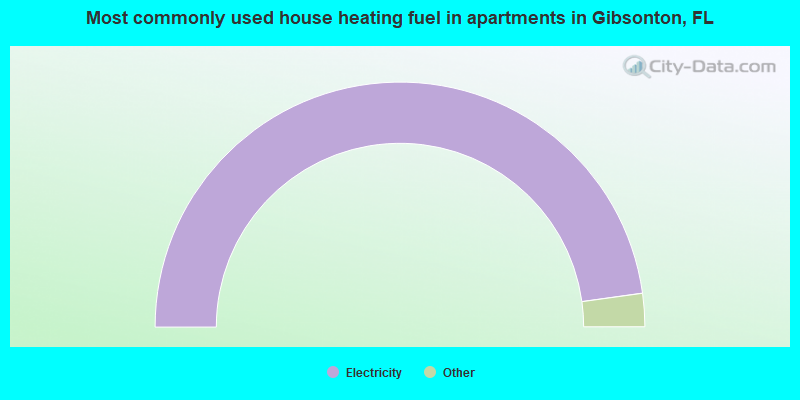
- 95.6%Electricity
- 2.2%Bottled, tank, or LP gas
- 1.4%No fuel used
- 0.8%Utility gas
Private vs. public school enrollment:
| Here: | 4.6% |
| Florida: | 15.8% |
| Here: | 10.3% |
| Florida: | 12.9% |
| Here: | 43.3% |
| Florida: | 23.6% |


