Jump to a detailed profile or search site with Google Custom Search

Greeley, CO (Colorado) Houses and Residents

Estimated median house or condo value in 2022: $385,900 (it was $129,600 in 2000)
Greeley:

$385,900
Colorado:

$531,100
Lower value quartile - upper value quartile: $309,000 - $473,700

Mean price in 2022:

Detached houses: $400,138
Here:

$400,138
State:

$676,667

Townhouses or other attached units: $542,831
Here:

$542,831
State:

$526,340

In 2-unit structures: $293,252
Here:

$293,252
State:

$431,509

In 3-to-4-unit structures: $259,999
Here:

$259,999
State:

$385,502

In 5-or-more-unit structures: $267,577
Here:

$267,577
State:

$417,586

Mobile homes: $103,659
Here:

$103,659
State:

$115,510

Total population: 98,596 (Urban population: 76,537, Rural population: 281 (26 farm, 255 nonfarm))

Houses: 42,635 (39,643 occupied: 24,779 owner occupied, 14,864 renter occupied)

% of renters here:

37%
State:

34%

Housing density: 1,426 houses/condos per square mile

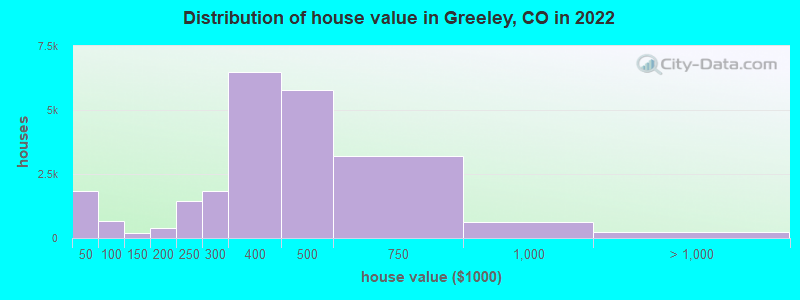
Median price asked for vacant for-sale houses and condos in 2022: $739,352.

Median contract rent in 2022: $1,121 (lower quartile is $896, upper quartile is $1,431)


Median rent asked for vacant for-rent units in 2022: $1,881


Median gross rent in Greeley, CO in 2022: $1,243

Housing units in Greeley with a mortgage: 16,695 (1,842 second mortgage, 100 home equity loan, 1,472 both second mortgage and home equity loan)
Houses without a mortgage: 463

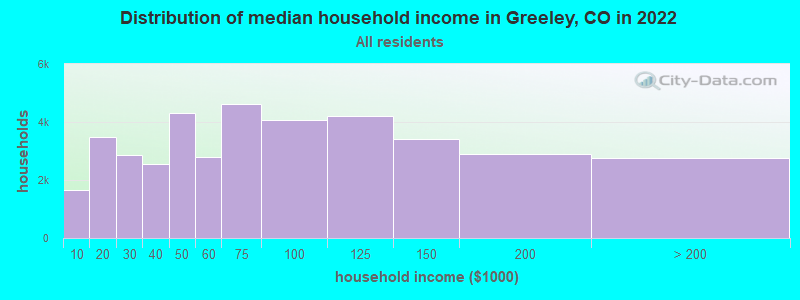
Median household income for houses/condos with a mortgage: $100,806

Median household income for apartments without a mortgage: $70,179

Median monthly housing costs: $1,305

Compare current foreclosures in Greeley, CO:

Check out more offers in Greeley, CO.
Powered by Foreclosure.com

Settings
X
Data:
Loading data...
Based on 2000-2020 data
Loading data...

123
Hide US histogram

Latest news about housing in Greeley, CO collected exclusively by city-data.com from local newspapers, TV, and radio stations

Greeley, Colorado Age and Sex of Residents
Median year house/condo built: 1986

Median year apartment built: 1979

Household type by relationship:

Households: 109,203
  • Male householders: 18,565 (5,074 living alone), Female householders: 21,078 (6,347 living alone)
  • 18,268 spouses (18,153 opposite-sex spouses), 4,131 unmarried partners, (3,983 opposite-sex unmarried partners), 30,812 children (27,482 natural, 536 adopted, 2,794 stepchildren), 2,580 grandchildren, 803 brothers or sisters, 1,885 parents, 65 foster children, 1,390 other relatives, 5,498 non-relatives
  • In group quarters: 4,128

Size of family households: 9,552 2-persons, 5,314 3-persons, 5,819 4-persons, 2,644 5-persons, 997 6-persons, 808 7-or-more-persons.

Size of nonfamily households: 11,421 1-person, 1,888 2-persons, 436 3-persons, 662 4-persons, 102 5-persons.

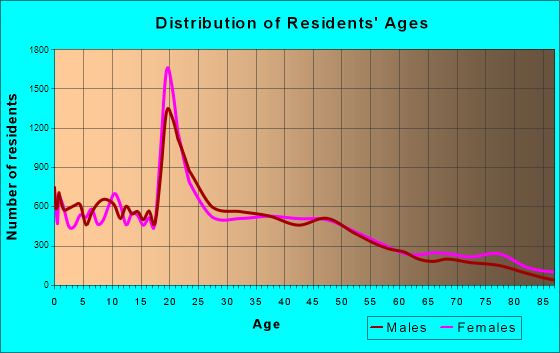
16,562 married couples with children.
5,980 single-parent households (974 men, 5,006 women).

74.5% of residents of Greeley speak English at home.
22.1% of residents speak Spanish at home (62% speak English very well, 16% speak English well, 15% speak English not well, 7% don't speak English at all).
1.1% of residents speak other Indo-European language at home (83% speak English very well, 9% speak English well, 8% speak English not well).
0.9% of residents speak Asian or Pacific Island language at home (71% speak English very well, 21% speak English well, 9% speak English not well).
1.1% of residents speak other language at home (57% speak English very well, 24% speak English well, 7% speak English not well, 12% don't speak English at all).

Foreign born population: 13,786 (12.6%)
(39.6% of them are naturalized citizens)

Median number of rooms in houses and condos:
Here:

7.4
State:

6.8

Median number of rooms in apartments
Here:

4.0
State:

4.0

Owner-occupied Renter-occupied
Bedrooms in owner-occupied houses and condos in Greeley, Colorado
  • Bedrooms in owner-occupied houses and condos in Greeley, Colorado
  • 133no bedroom
  • 2181 bedroom
  • 3,2932 bedrooms
  • 9,0993 bedrooms
  • 7,9474 bedrooms
  • 4,0895+ bedrooms
Bedrooms in renter-occupied apartments in Greeley, Colorado
  • Bedrooms in renter-occupied apartments in Greeley, Colorado
  • 2,010no bedroom
  • 2,6941 bedroom
  • 5,9542 bedrooms
  • 1,8773 bedrooms
  • 1,7464 bedrooms
  • 5835+ bedrooms
Owner-occupied Renter-occupied
Cars and other vehicles available in Greeley in owner-occupied houses/condos
  • Cars and other vehicles available in Greeley in owner-occupied houses/condos
  • 672no vehicle
  • 4,8371 vehicle
  • 10,5562 vehicles
  • 6,1913 vehicles
  • 1,5004 vehicles
  • 1,0235+ vehicles
Cars and other vehicles available in Greeley in renter-occupied apartments
  • Cars and other vehicles available in Greeley in renter-occupied apartments
  • 2,797no vehicle
  • 6,8461 vehicle
  • 3,1422 vehicles
  • 1,4743 vehicles
  • 3744 vehicles
  • 2315+ vehicles
Owner-occupied Renter-occupied
Rooms in owner-occupied houses in Greeley, Colorado
  • Rooms in owner-occupied houses in Greeley, Colorado
  • 1331 room
  • 892 rooms
  • 4863 rooms
  • 1,5834 rooms
  • 2,2985 rooms
  • 4,2086 rooms
  • 4,0737 rooms
  • 4,6048 rooms
  • 7,3059+ rooms
Rooms in renter-occupied apartments in Greeley, Colorado
  • Rooms in renter-occupied apartments in Greeley, Colorado
  • 1,9271 room
  • 1,2102 rooms
  • 1,7423 rooms
  • 4,6674 rooms
  • 1,0945 rooms
  • 1,7566 rooms
  • 8117 rooms
  • 6868 rooms
  • 9719+ rooms
Year house built
Median 2022 house/condo value by year built
Median house/condo value by year householder moved into unit
Breakdown of mean house values by ages of householders
Owners and renters by unit type in Greeley, CO
  • Greeley, CO household income distribution

  • Distribution of median household income in Greeley, CO in 2022
  • 1,647Less than $10,000
  • 3,484$10,000 to $19,999
  • 2,848$20,000 to $29,999
  • 2,560$30,000 to $39,999
  • 4,321$40,000 to $49,999
  • 2,799$50,000 to $59,999
  • 4,619$60,000 to $74,999
  • 4,079$75,000 to $99,999
  • 4,203$100,000 to $124,999
  • 3,417$125,000 to $149,999
  • 2,898$150,000 to $199,999
  • 2,768$200,000 or more
  • Home value of owner - occupied houses in 2022 in Greeley, CO

  • Distribution of house value in Greeley, CO in 2022
  • 346Less than $10,000
  • 130$10,000 to $14,999
  • 104$15,000 to $19,999
  • 246$20,000 to $24,999
  • 248$25,000 to $29,999
  • 210$30,000 to $34,999
  • 264$35,000 to $39,999
  • 276$40,000 to $49,999
  • 53$50,000 to $59,999
  • 30$60,000 to $69,999
  • 124$70,000 to $79,999
  • 70$80,000 to $89,999
  • 102$90,000 to $99,999
  • 124$100,000 to $124,999
  • 83$125,000 to $149,999
  • 161$150,000 to $174,999
  • 245$175,000 to $199,999
  • 1,455$200,000 to $249,999
  • 1,839$250,000 to $299,999
  • 6,477$300,000 to $399,999
  • 5,793$400,000 to $499,999
  • 3,195$500,000 to $749,999
  • 612$750,000 to $999,999
  • 137$1,000,000 to $1,499,999
  • 17$1,500,000 to $1,999,999
  • 79$2,000,000 or more
  • Rent paid by renters in 2022 in Greeley, CO

  • Distribution of rent paid by renters in Greeley, CO in 2022
  • 481Less than $100
  • 12$100 to $149
  • 168$150 to $199
  • 526$200 to $249
  • 141$250 to $299
  • 91$300 to $349
  • 148$350 to $399
  • 302$400 to $449
  • 104$450 to $499
  • 92$500 to $549
  • 186$550 to $599
  • 299$600 to $649
  • 102$650 to $699
  • 136$700 to $749
  • 576$750 to $799
  • 623$800 to $899
  • 1,274$900 to $999
  • 3,497$1,000 to $1,249
  • 2,001$1,250 to $1,499
  • 2,116$1,500 to $1,999
  • 1,075$2,000 to $2,499
  • 130$2,500 to $2,999
  • 26$3,000 to $3,499
  • 560No cash rent
Time Leaving Home To Go To Work in 2022

Percentage of workers working in this county: 74.1%
Number of people working at home: 4,122 (7.7% of all workers)

Travel time (in minutes) to work in 2022

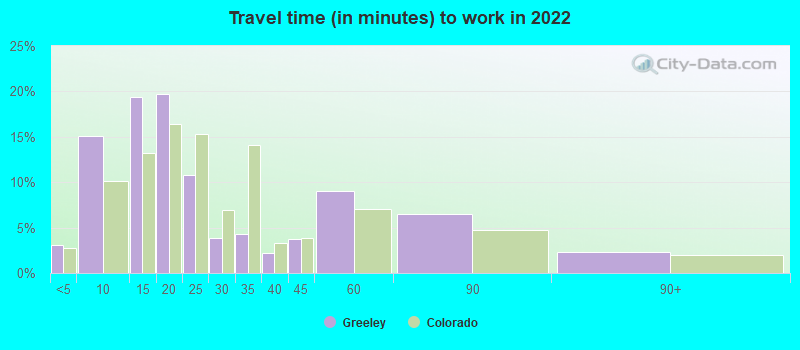
Travel time to work (commute)

  • Less than 5 minutes: 1,215
  • 5 to 9 minutes: 6,861
  • 10 to 14 minutes: 9,056
  • 15 to 19 minutes: 8,405
  • 20 to 24 minutes: 5,102
  • 25 to 29 minutes: 937
  • 30 to 34 minutes: 3,957
  • 35 to 39 minutes: 937
  • 40 to 44 minutes: 2,100
  • 45 to 59 minutes: 4,666
  • 60 to 89 minutes: 3,514
  • 90 or more minutes: 2,620
Means of transportation to work in 2022 - Greeley

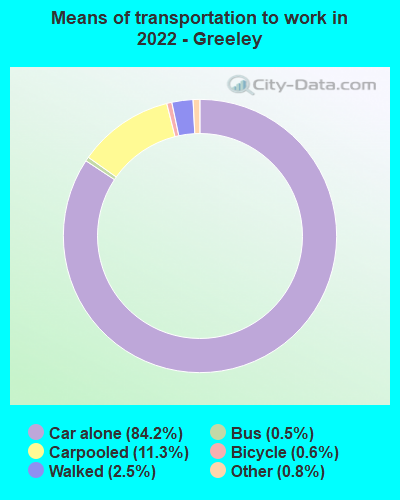
Means of transportation to work:

  • Drove a car alone: 41,601 (73.9%)
  • Carpooled: 5,799 (10.3%)
  • Bus: 300 (0.5%)
  • Light rail, streetcar or trolley: 3 (0.0%)
  • Taxi: 492 (0.9%)
  • Bicycle: 246 (0.4%)
  • Walked: 895 (1.6%)
  • Worked at home: 5,300 (9.4%)
Class of Workers in 2022
  • Unemployment by race in 2022
  • Unemployment rate for White non-Hispanic residents
  • 4.2%Males
  • 3.5%Females
  • Unemployment rate for Black residents
  • 4.3%Males
  • 1.4%Females
  • Unemployment rate for American Indian and Alaska Native residents
  • 27.4%Males
  • 12.7%Females
  • Unemployment rate for Asian residents
  • 10.7%Females
  • Unemployment rate for other race residents
  • 5.9%Males
  • 3.9%Females
  • Unemployment rate for two or more race residents
  • 4.6%Males
  • 9.7%Females
  • Unemployment rate for Hispanic or Latino residents
  • 2.1%Males
  • 1.6%Females
Year of entry for the foreign-born population in Greeley, Colorado
  • Year of entry for the foreign-born population in Greeley, Colorado
  • 4,9122010 or later
  • 3,6062000 to 2009
  • 2,4681990 to 1999
  • 1,7971980 to 1989
  • 7331970 to 1979
  • 578Before 1970
Ancestries in Greeley, CO

First ancestries reported:

  • German: 6,022 (10.7%)
  • American: 3,631 (6.5%)
  • English: 2,706 (4.8%)
  • European: 1,809 (3.2%)
  • Irish: 1,685 (3.0%)
  • Italian: 1,100 (2.0%)
  • Swedish: 525 (0.9%)
  • Ethiopian: 517 (0.9%)
  • Dutch: 475 (0.8%)
  • Norwegian: 468 (0.8%)
  • Scottish: 410 (0.7%)
  • French: 330 (0.6%)
  • African: 325 (0.6%)
  • Polish: 301 (0.5%)
  • Scotch-Irish: 269 (0.5%)
  • Scandinavian: 225 (0.4%)
  • Northern European: 170 (0.3%)
  • Kenyan: 143 (0.3%)
  • Czech: 136 (0.2%)
  • British: 119 (0.2%)
  • Arab: 116 (0.2%)
  • Somali: 113 (0.2%)
  • German Russian: 103 (0.2%)
  • Danish: 98 (0.2%)
  • Russian: 84 (0.1%)
  • Eastern European: 82 (0.1%)
  • Swiss: 75 (0.1%)
  • Welsh: 64 (0.1%)
  • Haitian: 62 (0.1%)
  • Canadian: 54 (0.10%)
  • Syrian: 49 (0.09%)
  • Romanian: 45 (0.08%)
  • Hungarian: 45 (0.08%)
  • French Canadian: 39 (0.07%)
  • Czechoslovakian: 35 (0.06%)
  • Slovene: 32 (0.06%)
  • Austrian: 32 (0.06%)
  • Croatian: 30 (0.05%)
  • Greek: 30 (0.05%)
  • Lebanese: 27 (0.05%)
  • Finnish: 26 (0.05%)
  • Brazilian: 24 (0.04%)
  • Belgian: 22 (0.04%)
  • Portuguese: 19 (0.03%)
  • Lithuanian: 19 (0.03%)
  • Yugoslavian: 17 (0.03%)
  • Moroccan: 14 (0.02%)
  • Ukrainian: 12 (0.02%)
  • Luxembourger: 10 (0.02%)
  • Turkish: 9 (0.02%)
  • Barbadian: 9 (0.02%)
  • Basque: 8 (0.01%)
  • Iranian: 8 (0.01%)
  • Pennsylvania German: 7 (0.01%)
  • Ugandan: 7 (0.01%)
  • Celtic: 6 (0.01%)
  • Slovak: 6 (0.01%)
  • Nigerian: 6 (0.01%)
  • West Indian: 6 (0.01%)

Most common places of birth for foreign-born residents (%):

Mexico
Greeley:

64.8% (8,741)
Colorado:

38.3% (209,491)

El Salvador
Greeley:

5.2% (696)
Colorado:

2.2% (12,150)

Guatemala
Greeley:

5.1% (684)
Colorado:

1.4% (7,898)

Eritrea
Greeley:

2.6% (346)
Colorado:

0.4% (2,447)

Germany
Greeley:

2.1% (290)
Colorado:

2.5% (13,706)

Other Western Africa
Greeley:

2.0% (265)
Colorado:

0.3% (1,904)

Place of birth for U.S.-born residents:

  • This state: 59,441
  • Other state: 35,055
  • Northeast: 2,453
  • Midwest: 12,186
  • South: 6,691
  • West: 13,725

82.8% of Greeley residents lived in the same house 1 years ago.
   Out of people who lived in different houses, 33.0% lived in this county.
   Out of people who lived in different counties, 67.7% lived in Colorado.


Greeley:

82.8%
State average:

83.6%

Education attainment for males 25 years and older:

  • No schooling: 1,447
  • Nursery to 4th grade: 50
  • 5th and 6th grade: 841
  • 7th and 8th grade: 1,039
  • 9th grade: 86
  • 10th grade: 825
  • 11th grade: 800
  • 12th grade, no diploma: 1,250
  • High school graduate (or equivalency): 9,034
  • Less than 1 year of college: 3,218
  • Some college more than 1 year, no degree: 4,711
  • Associate degree: 3,192
  • Bachelor's degree: 5,234
  • Master's degree: 2,791
  • Professional school degree: 491
  • Doctorate degree: 759
Educational Attainment for Males

Education attainment for females 25 years and older:

  • No schooling: 1,670
  • Nursery to 4th grade: 0
  • 5th and 6th grade: 691
  • 7th and 8th grade: 669
  • 9th grade: 0
  • 10th grade: 365
  • 11th grade: 43
  • 12th grade, no diploma: 1,147
  • High school graduate (or equivalency): 9,173
  • Less than 1 year of college: 1,983
  • Some college more than 1 year, no degree: 5,005
  • Associate degree: 3,284
  • Bachelor's degree: 7,708
  • Master's degree: 3,110
  • Professional school degree: 487
  • Doctorate degree: 89
Educational Attainment for Females
Greeley marital status for males
Greeley marital status for females

Housing units in structures:

  • One, detached: 24,573
  • One, attached: 1,848
  • Two: 1,946
  • 3 or 4: 3,237
  • 5 to 9: 2,829
  • 10 to 19: 2,410
  • 20 to 49: 2,349
  • 50 or more: 1,785
  • Mobile homes: 1,658

Median worth of mobile homes: $46,913

Housing units lacking complete plumbing facilities in 2022: 1.3%

Housing units lacking complete kitchen facilities in 2022: 2.8%

House/condo owner moved in on average 8 years ago

Renter moved in on average 2 years ago

Year householders moved into residence in Greeley
Houses and condos Apartments
Most commonly used house heating fuel in houses and condos in Greeley, CO
  • 85.5%Utility gas
  • 11.6%Electricity
  • 1.2%Bottled, tank, or LP gas
  • 0.8%Wood
  • 0.7%Solar energy
  • 0.2%No fuel used
Most commonly used house heating fuel in apartments in Greeley, CO
  • 60.9%Utility gas
  • 33.5%Electricity
  • 3.2%Bottled, tank, or LP gas
  • 1.1%No fuel used
  • 0.9%Other fuel
  • 0.2%Solar energy
  • 0.1%Fuel oil, kerosene, etc.

Private vs. public school enrollment:

Students in private schools in grades 1 to 8 (elementary and middle school): 1,959
Here:

17.3%
Colorado:

11.4%

Students in private schools in grades 9 to 12 (high school): 590
Here:

10.1%
Colorado:

8.5%

Students in private undergraduate colleges: 781
Here:

9.5%
Colorado:

14.0%
School Enrollment by Level of School for Male Students
School Enrollment by Level of School for Female Students
Age and Sex of Sensory-Disabled Noninstitutionalized Residents
Age and Sex of Physically-Disabled Noninstitutionalized Residents
Age and Sex of Mentally-Disabled Noninstitutionalized Residents
Age and Sex of Self-Care Disabled Noninstitutionalized Residents
Age and Sex of Go-Outside-Home Disabled Noninstitutionalized Residents
Age and Sex of Noninstitutionalized Residents with Employment Disability