Housing density: 643 houses/condos per square mile
Median price asked for vacant for-sale houses and condos in 2022 in this county: $398,010.
Median contract rent in 2022: $1,102 (lower quartile is $899, upper quartile is $1,622)
Median rent asked for vacant for-rent units in 2022: $1,073
Median gross rent in Green Acres, WA in 2022: $1,284
Housing units in Green Acres with a mortgage: 819 (141 second mortgage, 60 home equity loan, 0 both second mortgage and home equity loan) Houses without a mortgage: 279
Compare current foreclosures near Green Acres, WA:
In family households: 366,690 (83,287 male householders, 34,925 female householders)
88,280 spouses, 127,815 children (116,710 natural, 4,033 adopted, 7,072 stepchildren), 7,024 grandchildren, 3,522 brothers or sisters, 2,875 parents, foster children, 3,766 other relatives, 12,897 non-relatives
In nonfamily households: 89,839 (32,533 male householders (24,107 living alone)), 36,422 female householders (29,515 living alone)), 20,884 nonrelatives
In group quarters: 14,692 (5,666 institutionalized population)
72,314 married couples with children.
26,546 single-parent households (6,454 men, 20,092 women).
94.2% of residents of Green Acres speak English at home.
2.5% of residents speak Spanish at home (78% speak English very well, 13% speak English well, 9% speak English not well).
3.3% of residents speak other Indo-European language at home (66% speak English very well, 20% speak English well, 14% speak English not well).
Foreign born population: 241 (3.5%)
(71.0% of them are naturalized citizens)
Year of entry for the foreign-born population in Green Acres, Washington
91995 to March 2000
401990 to 1994
451985 to 1989
181980 to 1984
71975 to 1979
131970 to 1974
91965 to 1969
22Before 1965
First ancestries reported:
German: 1,283 (23.1%)
Other: 894 (16.1%)
Irish: 757 (13.6%)
English: 585 (10.5%)
Norwegian: 309 (5.6%)
United States: 234 (4.2%)
Swedish: 217 (3.9%)
French: 198 (3.6%)
Scottish: 155 (2.8%)
Russian: 149 (2.7%)
Scotch-Irish: 149 (2.7%)
Dutch: 132 (2.4%)
Italian: 113 (2.0%)
French Canadian: 84 (1.5%)
Polish: 71 (1.3%)
Welsh: 59 (1.1%)
Danish: 53 (1.0%)
Czech: 23 (0.4%)
Lithuanian: 20 (0.4%)
Hungarian: 19 (0.3%)
Greek: 16 (0.3%)
Swiss: 14 (0.3%)
Portuguese: 9 (0.2%)
Slovak: 9 (0.2%)
Ukrainian: 7 (0.1%)
Most common places of birth for foreign-born residents (%):
Canada
Green Acres:
35.0% (57)
Washington:
7.7% (47,568)
Russia
Green Acres:
27.0% (44)
Washington:
2.5% (15,491)
Other Eastern Europe
Green Acres:
8.6% (14)
Washington:
1.2% (7,645)
Mexico
Green Acres:
6.7% (11)
Washington:
24.1% (148,115)
Germany
Green Acres:
5.5% (9)
Washington:
3.4% (21,167)
Korea
Green Acres:
4.9% (8)
Washington:
6.2% (38,172)
Bangladesh
Green Acres:
4.3% (7)
Washington:
0.1% (330)
Australia
Green Acres:
4.3% (7)
Washington:
0.4% (2,329)
Netherlands
Green Acres:
3.7% (6)
Washington:
0.6% (3,795)
Place of birth for U.S.-born residents:
This state: 2,758
Other state: 2,236
Northeast: 168
Midwest: 471
South: 226
West: 1,371
59% of Green Acres residents lived in the same house 5 years ago. Out of people who lived in different houses, 77% lived in this county. Out of people who lived in different counties, 34% lived in Washington.
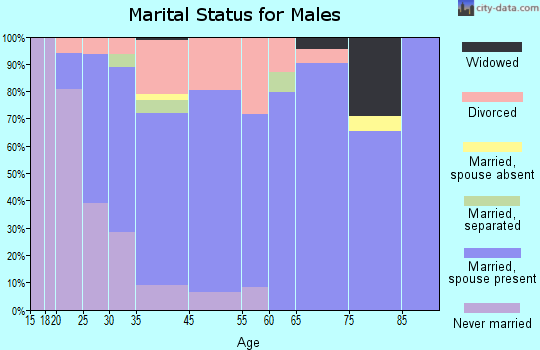
Education attainment for males 25 years and older:
No schooling: 0
Nursery to 4th grade: 9
5th and 6th grade: 8
7th and 8th grade: 65
9th grade: 38
10th grade: 25
11th grade: 11
12th grade, no diploma: 98
High school graduate (or equivalency): 625
Less than 1 year of college: 147
Some college more than 1 year, no degree: 199
Associate degree: 198
Bachelor's degree: 143
Master's degree: 38
Professional school degree: 0
Doctorate degree: 0
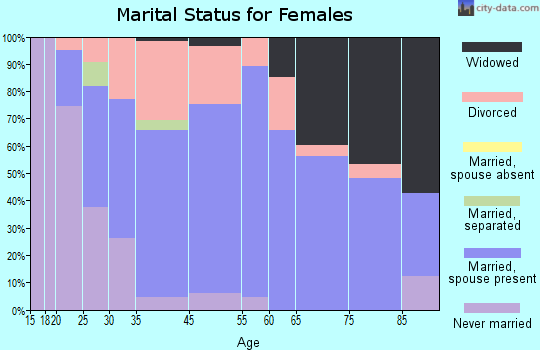
Education attainment for females 25 years and older: