Green Valley, IL (Illinois) Houses and Residents
| Green Valley: | $105,927 |
| Illinois: | $251,600 |
Mean price in 2022:
Detached houses: $108,557
Here: $108,557 State: $310,164
Total population: 694 (Urban population: 0, Rural population: 739 (9 farm, 730 nonfarm))
Houses: 320 (304 occupied: 210 owner occupied, 97 renter occupied)
| % of renters here: | 32% |
| State: | 33% |
Housing density: 1,038 houses/condos per square mile
Median price asked for vacant for-sale houses and condos in 2022: $235,016.
Median contract rent in 2022: $627 (lower quartile is $546, upper quartile is $712)
Median rent asked for vacant for-rent units in 2022: $637
Median gross rent in Green Valley, IL in 2022: $780
Housing units in Green Valley with a mortgage: 138 (6 second mortgage, 0 home equity loan, 3 both second mortgage and home equity loan)
Houses without a mortgage: 0
Median household income for houses/condos with a mortgage: $79,384
Median household income for apartments without a mortgage: $68,268
Median monthly housing costs: $820
Compare current foreclosures near Green Valley, IL:
| Photo | Address | Area | Beds / Baths | Price | Details |
|---|---|---|---|---|---|

|
#1
Townline Rd
Green Valley, IL 61534
|
2,186 sq. feet
|
1 baths 3 beds |
show details | |

|
#2
Sunset Blvd
Green Valley, IL 61534
|
1,647 sq. feet
|
2 baths 3 beds |
show details | |

|
#3
2nd St
Pekin, IL 61554
|
1,058 sq. feet
|
1 baths 3 beds |
$124,900
|
show details |

|
#4
Desutter Rd
Manito, IL 61546
|
1,276 sq. feet
|
1 baths 2 beds |
$74,000
|
show details |

|
#5
Herman St
Pekin, IL 61554
|
915 sq. feet
|
1 baths 2 beds |
$135,000
|
show details |

|
#6
N Pear
Topeka, IL 61567
|
- sq. feet
|
1 baths 2 beds |
$39,900
|
show details |

|
#7
State St
Pekin, IL 61554
|
1,652 sq. feet
|
1 baths 6 beds |
$29,900
|
show details |

|
#8
N Highland St
Creve Coeur, IL 61610
|
750 sq. feet
|
1 baths 1 beds |
$24,900
|
show details |

|
#9
S East St
Tremont, IL 61568
|
1,224 sq. feet
|
1 baths 3 beds |
show details | |

|
#10
N 14th St
Pekin, IL 61554
|
1,044 sq. feet
|
1 baths 2 beds |
show details |
| Photo | Address | Area | Beds / Baths | Price | Details |
|---|---|---|---|---|---|

|
#11
Hawthorne Ave
Pekin, IL 61554
|
1,983 sq. feet
|
2 baths 3 beds |
show details | |

|
#12
Hawthorne Ave
Pekin, IL 61554
|
2,012 sq. feet
|
2 baths 3 beds |
show details | |

|
#13
S Powell Rd
Peoria, IL 61607
|
1,008 sq. feet
|
1 baths 2 beds |
show details | |

|
#14
Florence Ave
Pekin, IL 61554
|
1,600 sq. feet
|
2 baths 3 beds |
show details | |

|
#15
Camden St
Pekin, IL 61554
|
864 sq. feet
|
1 baths 3 beds |
show details | |

|
#16
Florence Ave
Pekin, IL 61554
|
1,934 sq. feet
|
1 baths 3 beds |
show details | |

|
#17
Sheridan Rd
Pekin, IL 61554
|
1,040 sq. feet
|
1 baths 1 beds |
show details | |

|
#18
W Summit Ave
Peoria, IL 61607
|
2,533 sq. feet
|
2 baths 3 beds |
show details | |

|
#19
Timber Cir
Groveland, IL 61535
|
1,666 sq. feet
|
2 baths 3 beds |
show details | |

|
#20
E 3rd St
Glasford, IL 61533
|
1,080 sq. feet
|
2 baths 3 beds |
show details |
| Photo | Address | Area | Beds / Baths | Price | Details |
|---|---|---|---|---|---|

|
#21
Lincoln Rd
Pekin, IL 61554
|
988 sq. feet
|
1 baths 3 beds |
show details | |

|
#22
W Surface Rd
Mapleton, IL 61547
|
1,075 sq. feet
|
1 baths 2 beds |
show details | |

|
#23
Matilda St
Pekin, IL 61554
|
904 sq. feet
|
1 baths 3 beds |
show details | |

|
#24
S Sampson St
Tremont, IL 61568
|
896 sq. feet
|
1 baths 2 beds |
show details | |

|
#25
N 3rd St
Pekin, IL 61554
|
910 sq. feet
|
1 baths 3 beds |
show details | |

|
#26
Windsor St
Pekin, IL 61554
|
1,149 sq. feet
|
1 baths 3 beds |
show details | |

|
#27
Windsor St
Pekin, IL 61554
|
1,768 sq. feet
|
2 baths 3 beds |
show details | |

|
#28
Bellair Drive
Liverpool, IL 61543
|
616 sq. feet
|
1 baths 2 beds |
show details | |

|
#29
Sherwood Dr
Pekin, IL 61554
|
925 sq. feet
|
1 baths 3 beds |
show details | |

|
#30
Holly Dr
Pekin, IL 61554
|
988 sq. feet
|
1 baths 3 beds |
show details |
| Photo | Address | Area | Beds / Baths | Price | Details |
|---|---|---|---|---|---|

|
#31
N 3rd St
Pekin, IL 61554
|
728 sq. feet
|
1 baths 2 beds |
show details | |

|
#32
Mary St
Pekin, IL 61554
|
1,804 sq. feet
|
2 baths 5 beds |
show details | |

|
#33
Matilda St
Pekin, IL 61554
|
850 sq. feet
|
1 baths 2 beds |
show details | |

|
#34
Willow St
Pekin, IL 61554
|
1,588 sq. feet
|
2 baths 3 beds |
show details | |

|
#35
Chestnut St
Pekin, IL 61554
|
1,567 sq. feet
|
1 baths 4 beds |
show details | |

|
#36
Arrow St
Pekin, IL 61554
|
1,627 sq. feet
|
2 baths 3 beds |
show details | |

|
#37
Illinois St
Pekin, IL 61554
|
1,008 sq. feet
|
1 baths 2 beds |
show details | |

|
#38
Reuling Ct
Pekin, IL 61554
|
1,325 sq. feet
|
2 baths 2 beds |
show details | |

|
#39
E Pine St
Mason City, IL 62664
|
3,960 sq. feet
|
3 baths 4 beds |
show details | |

|
#40
N Capitol St
Pekin, IL 61554
|
814 sq. feet
|
1 baths 2 beds |
show details |
| Photo | Address | Area | Beds / Baths | Price | Details |
|---|---|---|---|---|---|

|
#41
N 5th St
Pekin, IL 61554
|
1,272 sq. feet
|
2 baths 3 beds |
show details | |

|
#42
Rogers Rd
Pekin, IL 61554
|
988 sq. feet
|
1 baths 3 beds |
show details | |

|
#43
E Essex St
Glasford, IL 61533
|
1,589 sq. feet
|
1 baths 3 beds |
show details | |

|
#44
Velde St
Creve Coeur, IL 61610
|
600 sq. feet
|
1 baths 1 beds |
show details | |

|
#45
Collier Ave
Peoria, IL 61607
|
1,008 sq. feet
|
1 baths 2 beds |
show details | |

|
#46
S Glen Ave
Morton, IL 61550
|
1,608 sq. feet
|
1 baths 3 beds |
show details | |

|
#47
S Jefferson St
Peoria, IL 61607
|
1,486 sq. feet
|
2 baths 3 beds |
show details | |

|
#48
W Mcclure Ave
Peoria, IL 61607
|
832 sq. feet
|
1 baths 2 beds |
show details | |

|
#49
W Garfield Ave
Peoria, IL 61607
|
962 sq. feet
|
1 baths 2 beds |
show details | |

|
Check over 1 million property listings on Foreclosure.com!
|
browse all offers | |||


 | Any thriving small towns in Illinois? (44 replies) |
| Possibly moving to Washington IL (9 replies) |
| Bartonville IL (19 replies) |
| Family friendly with best high school neighbourhood near Peoria (7 replies) |
| Cobden Illinois? (8 replies) |
| A Caveat On "garbage Hill" (5 replies) |

Median year apartment built: 1939
Household type by relationship:
Households: 763- Male householders: 127 (40 living alone), Female householders: 173 (48 living alone)
121 spouses (121 opposite-sex spouses), 49 unmarried partners, (49 opposite-sex unmarried partners), 240 children (214 natural, 6 adopted, 18 stepchildren), 24 grandchildren, 0 brothers or sisters, 6 parents, 0 foster children, 5 other relatives, 13 non-relatives
Size of family households: 100 2-persons, 28 3-persons, 48 4-persons, 7 5-persons, 3 6-persons, 15 7-or-more-persons.
Size of nonfamily households: 85 1-person, 16 2-persons, 3 3-persons.
60 married couples with children.
123 single-parent households (53 men, 70 women).
97.7% of residents of Green Valley speak English at home.
0.3% of residents speak Spanish at home (100% speak English very well).
0.4% of residents speak other Indo-European language at home (100% speak English very well).
0.1% of residents speak Asian or Pacific Island language at home (100% speak English very well).
Foreign born population: 9 (1.2%)
(55.6% of them are naturalized citizens)
| Here: | 6.3 |
| State: | 6.4 |
| Here: | 4.8 |
| State: | 4.1 |

- Bedrooms in owner-occupied houses and condos in Green Valley, Illinois
- 0no bedroom
- 01 bedroom
- 322 bedrooms
- 1403 bedrooms
- 344 bedrooms
- 45+ bedrooms

- Bedrooms in renter-occupied apartments in Green Valley, Illinois
- 0no bedroom
- 61 bedroom
- 392 bedrooms
- 463 bedrooms
- 34 bedrooms
- 45+ bedrooms

- Cars and other vehicles available in Green Valley in owner-occupied houses/condos
- 3no vehicle
- 591 vehicle
- 872 vehicles
- 343 vehicles
- 254 vehicles
- 25+ vehicles

- Cars and other vehicles available in Green Valley in renter-occupied apartments
- 3no vehicle
- 151 vehicle
- 672 vehicles
- 63 vehicles
- 64 vehicles
- 05+ vehicles

- Rooms in owner-occupied houses in Green Valley, Illinois
- 01 room
- 02 rooms
- 03 rooms
- 164 rooms
- 565 rooms
- 516 rooms
- 307 rooms
- 248 rooms
- 339+ rooms

- Rooms in renter-occupied apartments in Green Valley, Illinois
- 01 room
- 02 rooms
- 153 rooms
- 244 rooms
- 425 rooms
- 46 rooms
- 27 rooms
- 68 rooms
- 49+ rooms


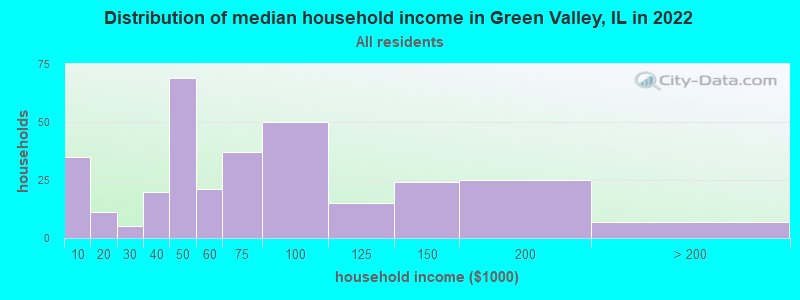
Green Valley, IL household income distribution

- 35Less than $10,000
- 11$10,000 to $19,999
- 5$20,000 to $29,999
- 20$30,000 to $39,999
- 69$40,000 to $49,999
- 21$50,000 to $59,999
- 37$60,000 to $74,999
- 50$75,000 to $99,999
- 15$100,000 to $124,999
- 24$125,000 to $149,999
- 25$150,000 to $199,999
- 7$200,000 or more
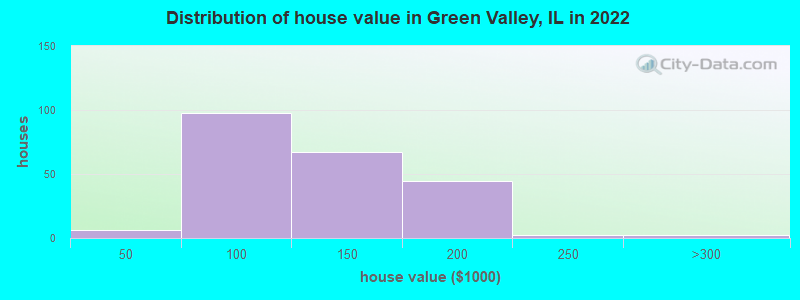
Home value of owner - occupied houses in 2022 in Green Valley, IL
-
- 1$15,000 to $19,999
- 2$20,000 to $24,999
- 2$30,000 to $34,999
- 1$50,000 to $59,999
- 2$60,000 to $69,999
- 42$70,000 to $79,999
- 19$80,000 to $89,999
- 31$90,000 to $99,999
- 39$100,000 to $124,999
- 27$125,000 to $149,999
- 43$150,000 to $174,999
- 1$175,000 to $199,999
- 2$200,000 to $249,999
- 2$250,000 to $299,999
Rent paid by renters in 2022 in Green Valley, IL
-
- 1$100 to $149
- 3$200 to $249
- 2$350 to $399
- 0$450 to $499
- 34$500 to $549
- 1$550 to $599
- 20$600 to $649
- 20$650 to $699
- 5$700 to $749
- 4$750 to $799
- 6$800 to $899
- 1No cash rent


Percentage of workers working in this county: 61.7%
Number of people working at home: 13 (3.1% of all workers)
Travel time to work (commute)
- Less than 5 minutes: 6
- 5 to 9 minutes: 8
- 10 to 14 minutes: 64
- 15 to 19 minutes: 54
- 20 to 24 minutes: 74
- 25 to 29 minutes: 22
- 30 to 34 minutes: 66
- 35 to 39 minutes: 14
- 40 to 44 minutes: 6
- 45 to 59 minutes: 67
- 60 to 89 minutes: 18
- 90 or more minutes: 8
Means of transportation to work:
- Drove a car alone: 255 (78.9%)
- Carpooled: 53 (16.4%)
- Bus or trolley bus: 2 (0.6%)
- Bicycle: 3 (0.9%)
- Other means: 3 (0.9%)
- Worked at home: 7 (2.2%)

- Unemployment by race in 2022
- Unemployment rate for White non-Hispanic residents
- 0.6%Males
- 0.5%Females

First ancestries reported:
- German: 64 (21.1%)
- European: 61 (20.1%)
- English: 42 (13.9%)
- Scottish: 41 (13.5%)
- American: 32 (10.6%)
- Scotch-Irish: 10 (3.3%)
- Italian: 2 (0.7%)
- Scandinavian: 2 (0.7%)
- Dutch: 1 (0.3%)
- Irish: 1 (0.3%)
- Polish: 1 (0.3%)
- Slovak: 1 (0.3%)
Most common places of birth for foreign-born residents (%):
| Green Valley: | 77.8% (7) |
| Illinois: | 0.6% (10,762) |
| Green Valley: | 22.2% (2) |
| Illinois: | 9.2% (166,409) |
Place of birth for U.S.-born residents:
- This state: 631
- Other state: 113
- Northeast: 0
- Midwest: 54
- South: 26
- West: 30
77.5% of Green Valley residents lived in the same house 1 years ago.
Out of people who lived in different houses, 34.8% lived in this county.
Out of people who lived in different counties, 100.0% lived in Illinois.
| Green Valley: | 77.5% |
| State average: | 88.3% |
Education attainment for males 25 years and older:
- No schooling: 2
- Nursery to 4th grade: 0
- 5th and 6th grade: 0
- 7th and 8th grade: 0
- 9th grade: 0
- 10th grade: 1
- 11th grade: 3
- 12th grade, no diploma: 4
- High school graduate (or equivalency): 118
- Less than 1 year of college: 28
- Some college more than 1 year, no degree: 15
- Associate degree: 32
- Bachelor's degree: 10
- Master's degree: 5
- Professional school degree: 0
- Doctorate degree: 3

Education attainment for females 25 years and older:
- No schooling: 3
- Nursery to 4th grade: 0
- 5th and 6th grade: 0
- 7th and 8th grade: 2
- 9th grade: 0
- 10th grade: 0
- 11th grade: 0
- 12th grade, no diploma: 2
- High school graduate (or equivalency): 105
- Less than 1 year of college: 11
- Some college more than 1 year, no degree: 57
- Associate degree: 19
- Bachelor's degree: 46
- Master's degree: 18
- Professional school degree: 0
- Doctorate degree: 11


Housing units in structures:
- One, detached: 249
- One, attached: 7
- 3 or 4: 56
- 50 or more: 8
House/condo owner moved in on average 9 years ago
Renter moved in on average 1 years ago

Private vs. public school enrollment:
| Here: | 0.0% |
| Illinois: | 13.3% |
| Here: | 0.0% |
| Illinois: | 9.9% |
| Here: | 0.0% |
| Illinois: | 27.4% |


