Jump to a detailed profile or search site with Google Custom Search

Hadley, MA (Massachusetts) Houses and Residents

Estimated median house or condo value in 2022: $443,628 (it was $170,700 in 2000)
Hadley:

$443,628
Massachusetts:

$534,700
Lower value quartile - upper value quartile: $382,792 - $548,612

Total population: 5,250 (Urban population: 2,584 (2,295 inside urbanized areas, 289 inside urban clusters), Rural population: 2,209 (46 farm, 2,163 nonfarm))

Houses: 1,953 (1,895 occupied: 1,418 owner occupied, 477 renter occupied)

% of renters here:

25%
State:

38%

Housing density: 84 houses/condos per square mile

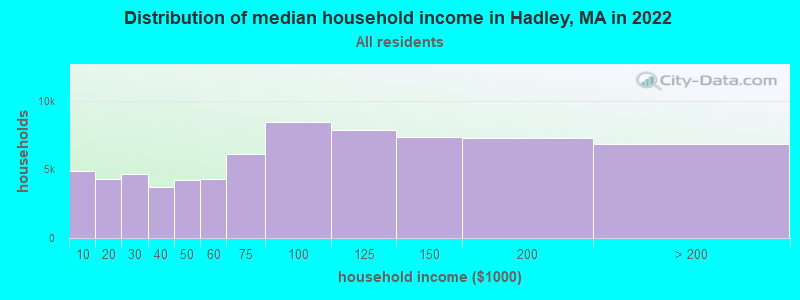
Median price asked for vacant for-sale houses and condos in 2022 in this county: $222,792.

Median contract rent in 2022: $1,198 (lower quartile is $707, upper quartile is over $2,000)


Median gross rent in Hadley, MA in 2022: $1,369

Housing units in Hadley with a mortgage: 746 (34 second mortgage, 197 home equity loan, 0 both second mortgage and home equity loan)
Houses without a mortgage: 489

Compare current foreclosures near Hadley, MA:

Check out more offers near Hadley, MA.
Powered by Foreclosure.com


Latest news about housing in Hadley, MA collected exclusively by city-data.com from local newspapers, TV, and radio stations

Hadley, Massachusetts Age and Sex of Residents

Household type by relationship:

Households: 137,248
  • In family households: 102,805 (23,141 male householders, 11,339 female householders)
    26,289 spouses, 34,225 children (31,880 natural, 1,196 adopted, 1,149 stepchildren), 1,465 grandchildren, 834 brothers or sisters, 944 parents, foster children, 834 other relatives, 3,097 non-relatives
  • In nonfamily households: 34,443 (10,544 male householders (7,207 living alone)), 13,678 female householders (10,221 living alone)), 10,221 nonrelatives
  • In group quarters: 20,832 (1,268 institutionalized population)

21,116 married couples with children.
6,740 single-parent households (1,315 men, 5,425 women).

91.7% of residents of Hadley speak English at home.
1.4% of residents speak Spanish at home (53% speak English very well, 20% speak English well, 27% speak English not well).
5.5% of residents speak other Indo-European language at home (72% speak English very well, 15% speak English well, 13% speak English not well).
1.4% of residents speak Asian or Pacific Island language at home (60% speak English very well, 8% speak English well, 32% speak English not well).

Foreign born population: 316 (6.2%)
(75.0% of them are naturalized citizens)

Median number of rooms in houses and condos:
Here:

6.5
State:

6.5

Median number of rooms in apartments
Here:

6.0
State:

4.0

Owner-occupied Renter-occupied
Bedrooms in owner-occupied houses and condos in Hadley, Massachusetts
  • Bedrooms in owner-occupied houses and condos in Hadley, Massachusetts
  • 0no bedroom
  • 131 bedroom
  • 1732 bedrooms
  • 7793 bedrooms
  • 3704 bedrooms
  • 835+ bedrooms
Bedrooms in renter-occupied apartments in Hadley, Massachusetts
  • Bedrooms in renter-occupied apartments in Hadley, Massachusetts
  • 7no bedroom
  • 1221 bedroom
  • 1562 bedrooms
  • 1233 bedrooms
  • 694 bedrooms
  • 05+ bedrooms
Owner-occupied Renter-occupied
Cars and other vehicles available in Hadley in owner-occupied houses/condos
  • Cars and other vehicles available in Hadley in owner-occupied houses/condos
  • 33no vehicle
  • 3391 vehicle
  • 7092 vehicles
  • 2683 vehicles
  • 694 vehicles
  • 05+ vehicles
Cars and other vehicles available in Hadley in renter-occupied apartments
  • Cars and other vehicles available in Hadley in renter-occupied apartments
  • 69no vehicle
  • 1751 vehicle
  • 1612 vehicles
  • 623 vehicles
  • 104 vehicles
  • 05+ vehicles
Owner-occupied Renter-occupied
Rooms in owner-occupied houses in Hadley, Massachusetts
  • Rooms in owner-occupied houses in Hadley, Massachusetts
  • 01 room
  • 02 rooms
  • 03 rooms
  • 254 rooms
  • 3065 rooms
  • 3776 rooms
  • 3227 rooms
  • 1838 rooms
  • 2059+ rooms
Rooms in renter-occupied apartments in Hadley, Massachusetts
  • Rooms in renter-occupied apartments in Hadley, Massachusetts
  • 71 room
  • 562 rooms
  • 563 rooms
  • 844 rooms
  • 1365 rooms
  • 546 rooms
  • 347 rooms
  • 198 rooms
  • 319+ rooms
Year house built
Breakdown of mean house values by ages of householders
Owners and renters by unit type in Hadley, MA
  • Hadley, MA household income distribution

  • Distribution of median household income in Hadley, MA in 2022
  • 4,886Less than $10,000
  • 4,290$10,000 to $19,999
  • 4,633$20,000 to $29,999
  • 3,721$30,000 to $39,999
  • 4,187$40,000 to $49,999
  • 4,318$50,000 to $59,999
  • 6,086$60,000 to $74,999
  • 8,438$75,000 to $99,999
  • 7,866$100,000 to $124,999
  • 7,346$125,000 to $149,999
  • 7,304$150,000 to $199,999
  • 6,861$200,000 or more

Percentage of workers working in this county: 75.0%
Number of people working at home: 521 (18.4% of all workers)

Travel time to work (commute)

  • Less than 5 minutes: 92
  • 5 to 9 minutes: 426
  • 10 to 14 minutes: 445
  • 15 to 19 minutes: 420
  • 20 to 24 minutes: 337
  • 25 to 29 minutes: 105
  • 30 to 34 minutes: 230
  • 35 to 39 minutes: 41
  • 40 to 44 minutes: 70
  • 45 to 59 minutes: 103
  • 60 to 89 minutes: 58
  • 90 or more minutes: 57

Means of transportation to work:

  • Drove a car alone: 2,203 (89.7%)
  • Carpooled: 73 (3.0%)
  • Bus or trolley bus: 19 (0.8%)
  • Streetcar or trolley car: 11 (0.4%)
  • Bicycle: 24 (1.0%)
  • Walked: 32 (1.3%)
  • Other means: 22 (0.9%)
  • Worked at home: 71 (2.9%)
Class of Workers in 2000
Year of entry for the foreign-born population in Hadley, Massachusetts
  • Year of entry for the foreign-born population in Hadley, Massachusetts
  • 381995 to March 2000
  • 101990 to 1994
  • 701985 to 1989
  • 01980 to 1984
  • 01975 to 1979
  • 121970 to 1974
  • 61965 to 1969
  • 74Before 1965
Ancestries in Hadley, MA

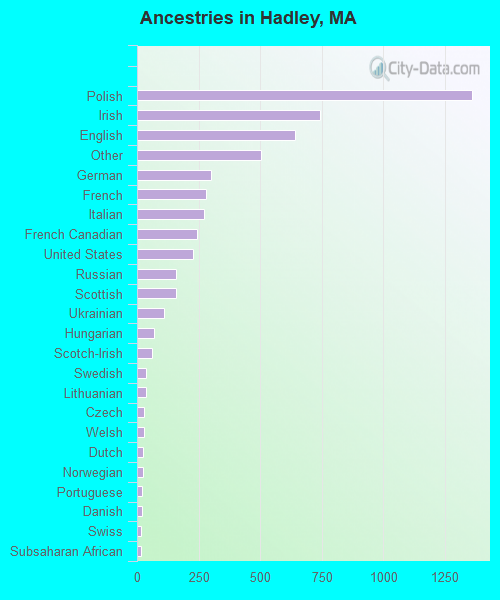
First ancestries reported:

  • Polish: 1,361 (25.2%)
  • Irish: 744 (13.8%)
  • English: 642 (11.9%)
  • Other: 502 (9.3%)
  • German: 301 (5.6%)
  • French: 279 (5.2%)
  • Italian: 270 (5.0%)
  • French Canadian: 243 (4.5%)
  • United States: 228 (4.2%)
  • Russian: 160 (3.0%)
  • Scottish: 160 (3.0%)
  • Ukrainian: 111 (2.1%)
  • Hungarian: 69 (1.3%)
  • Scotch-Irish: 61 (1.1%)
  • Swedish: 38 (0.7%)
  • Lithuanian: 37 (0.7%)
  • Czech: 28 (0.5%)
  • Welsh: 27 (0.5%)
  • Dutch: 26 (0.5%)
  • Norwegian: 25 (0.5%)
  • Portuguese: 20 (0.4%)
  • Danish: 19 (0.4%)
  • Swiss: 18 (0.3%)
  • Subsaharan African: 17 (0.3%)
  • Arab: 5 (0.09%)
  • West Indian: 4 (0.07%)

Most common places of birth for foreign-born residents (%):

Poland
Hadley:

21.9% (46)
Massachusetts:

1.8% (13,543)

United Kingdom
Hadley:

16.7% (35)
Massachusetts:

3.3% (25,403)

Taiwan
Hadley:

14.8% (31)
Massachusetts:

0.9% (7,258)

Germany
Hadley:

10.0% (21)
Massachusetts:

1.9% (14,883)

Canada
Hadley:

7.6% (16)
Massachusetts:

5.2% (40,247)

Vietnam
Hadley:

6.7% (14)
Massachusetts:

3.9% (30,457)

China, excluding Hong Kong and Taiwan
Hadley:

5.7% (12)
Massachusetts:

5.1% (39,255)

Iran
Hadley:

2.9% (6)
Massachusetts:

0.6% (4,416)

Thailand
Hadley:

2.9% (6)
Massachusetts:

0.6% (4,578)

Guatemala
Hadley:

2.9% (6)
Massachusetts:

1.7% (12,868)

India
Hadley:

2.4% (5)
Massachusetts:

3.6% (28,086)

Austria
Hadley:

1.9% (4)
Massachusetts:

0.2% (1,418)

South Africa
Hadley:

1.9% (4)
Massachusetts:

0.3% (2,242)

Jamaica
Hadley:

1.9% (4)
Massachusetts:

1.7% (12,808)

Place of birth for U.S.-born residents:

  • This state: 3,265
  • Other state: 1,263
  • Northeast: 804
  • Midwest: 171
  • South: 191
  • West: 97

64% of Hadley residents lived in the same house 5 years ago.
   Out of people who lived in different houses, 50% lived in this county.
   Out of people who lived in different counties, 53% lived in Massachusetts.

Education attainment for males 25 years and older:

  • No schooling: 0
  • Nursery to 4th grade: 7
  • 5th and 6th grade: 4
  • 7th and 8th grade: 23
  • 9th grade: 21
  • 10th grade: 31
  • 11th grade: 41
  • 12th grade, no diploma: 9
  • High school graduate (or equivalency): 419
  • Less than 1 year of college: 117
  • Some college more than 1 year, no degree: 145
  • Associate degree: 130
  • Bachelor's degree: 374
  • Master's degree: 155
  • Professional school degree: 23
  • Doctorate degree: 72
Educational Attainment for Males

Education attainment for females 25 years and older:

  • No schooling: 15
  • Nursery to 4th grade: 0
  • 5th and 6th grade: 26
  • 7th and 8th grade: 48
  • 9th grade: 64
  • 10th grade: 31
  • 11th grade: 20
  • 12th grade, no diploma: 17
  • High school graduate (or equivalency): 459
  • Less than 1 year of college: 76
  • Some college more than 1 year, no degree: 219
  • Associate degree: 161
  • Bachelor's degree: 437
  • Master's degree: 195
  • Professional school degree: 62
  • Doctorate degree: 85
Educational Attainment for Females
Hadley marital status for males
Hadley marital status for females

Housing units in structures:

  • One, detached: 1,575
  • One, attached: 15
  • Two: 223
  • 3 or 4: 46
  • 5 to 9: 59
  • 20 to 49: 14
  • 50 or more: 8
  • Mobile homes: 7
  • Boats, RVs, vans, etc.: 6
Year householders moved into residence in Hadley
Houses and condos Apartments
Most commonly used house heating fuel in houses and condos in Hadley, MA
  • 69.9%Fuel oil, kerosene, etc.
  • 11.7%Utility gas
  • 10.9%Electricity
  • 5.6%Bottled, tank, or LP gas
  • 2.0%Wood
Most commonly used house heating fuel in apartments in Hadley, MA
  • 49.5%Fuel oil, kerosene, etc.
  • 26.8%Utility gas
  • 13.4%Electricity
  • 4.6%Wood
  • 4.2%Bottled, tank, or LP gas
  • 1.5%Other fuel

Private vs. public school enrollment:

Students in private schools in grades 1 to 8 (elementary and middle school): 33
Here:

7.3%
Massachusetts:

10.8%

Students in private schools in grades 9 to 12 (high school): 18
Here:

6.9%
Massachusetts:

12.2%

Students in private undergraduate colleges: 50
Here:

16.8%
Massachusetts:

48.2%
School Enrollment by Level of School for Male Students
School Enrollment by Level of School for Female Students
Age and Sex of Sensory-Disabled Noninstitutionalized Residents
Age and Sex of Physically-Disabled Noninstitutionalized Residents
Age and Sex of Mentally-Disabled Noninstitutionalized Residents
Age and Sex of Self-Care Disabled Noninstitutionalized Residents
Age and Sex of Go-Outside-Home Disabled Noninstitutionalized Residents
Age and Sex of Noninstitutionalized Residents with Employment Disability