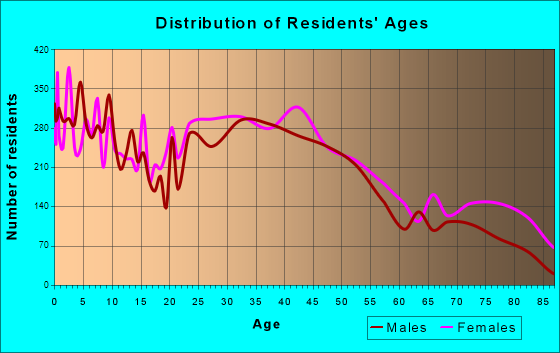
Hagerstown, MD (Maryland) Houses and Residents
| Hagerstown: | $208,053 |
| Maryland: | $398,100 |
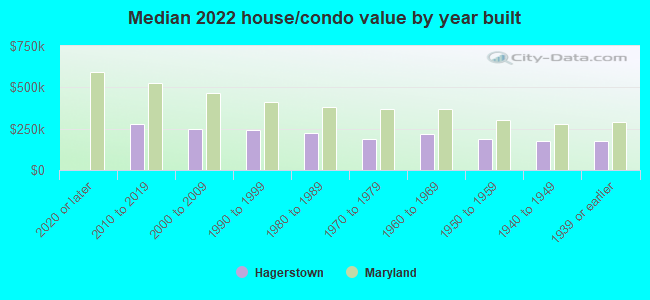
Mean price in 2022:
Detached houses: $241,281
Here: $241,281 State: $526,819 Townhouses or other attached units: $221,476
Here: $221,476 State: $328,305 In 2-unit structures: $1,088,834
Here: $1,088,834 State: $346,599 In 3-to-4-unit structures: $144,332
Here: $144,332 State: $295,378 In 5-or-more-unit structures: $141,153
Here: $141,153 State: $350,378
Total population: 40,364 (Urban population: 36,705, Rural population: 34 (all nonfarm))
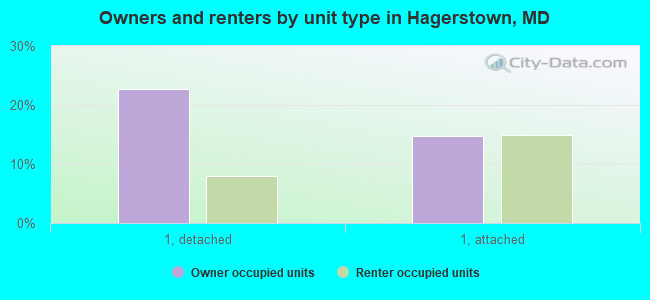
Houses: 20,061 (18,276 occupied: 7,353 owner occupied, 10,953 renter occupied)
| % of renters here: | 60% |
| State: | 32% |
Housing density: 1,882 houses/condos per square mile
Median price asked for vacant for-sale houses and condos in 2022: $199,649.
Median contract rent in 2022: $775 (lower quartile is $585, upper quartile is $1,028)
Median rent asked for vacant for-rent units in 2022: $1,026
Median gross rent in Hagerstown, MD in 2022: $917
Housing units in Hagerstown with a mortgage: 4,674 (324 second mortgage, 12 home equity loan, 296 both second mortgage and home equity loan)
Houses without a mortgage: 243
Median household income for houses/condos with a mortgage: $72,315
Median household income for apartments without a mortgage: $47,648
Median monthly housing costs: $935
Compare current foreclosures in Hagerstown, MD:
| Photo | Address | Area | Beds / Baths | Price | Details |
|---|---|---|---|---|---|

|
#1
E Antietam St
Hagerstown, MD 21740
|
1,820 sq. feet
|
1 baths 3 beds |
$156,000
|
show details |

|
#2
Shale Dr
Hagerstown, MD 21740
|
3,302 sq. feet
|
2 baths 4 beds |
$495,000
|
show details |

|
#3
Oriole Cir
Hagerstown, MD 21742
|
1,724 sq. feet
|
2 baths 3 beds |
$329,900
|
show details |

|
#4
Coffman Ave
Hagerstown, MD 21740
|
1,332 sq. feet
|
1 baths 4 beds |
show details | |

|
#5
Ray St
Hagerstown, MD 21740
|
924 sq. feet
|
1 baths 3 beds |
show details | |

|
#6
N Cleveland Ave
Hagerstown, MD 21740
|
1,500 sq. feet
|
1 baths - beds |
show details | |

|
#7
Cristins Cir
Hagerstown, MD 21742
|
1,440 sq. feet
|
1 baths - beds |
show details | |

|
#8
Emerald Dr
Hagerstown, MD 21742
|
2,452 sq. feet
|
2 baths - beds |
show details | |

|
#9
Clubhouse Dr
Hagerstown, MD 21740
|
1,680 sq. feet
|
2 baths - beds |
show details | |

|
#10
S Cannon Ave
Hagerstown, MD 21740
|
1,344 sq. feet
|
1 baths - beds |
show details |
| Photo | Address | Area | Beds / Baths | Price | Details |
|---|---|---|---|---|---|

|
#11
Babylon Ct
Hagerstown, MD 21742
|
3,966 sq. feet
|
4 baths - beds |
show details | |

|
#12
Royal Rd
Hagerstown, MD 21742
|
2,174 sq. feet
|
2 baths - beds |
show details | |

|
#13
Wilderness Way
Hagerstown, MD 21740
|
2,093 sq. feet
|
2 baths - beds |
show details | |

|
#14
Papa Ct
Hagerstown, MD 21740
|
2,125 sq. feet
|
2 baths - beds |
show details | |

|
#15
Leitersburg Pike
Hagerstown, MD 21742
|
2,535 sq. feet
|
4 baths - beds |
show details | |

|
#16
Winston Dr
Hagerstown, MD 21740
|
2,436 sq. feet
|
2 baths - beds |
show details | |

|
#17
Sapphire Dr
Hagerstown, MD 21742
|
1,526 sq. feet
|
2 baths - beds |
show details | |

|
#18
Afton Pl
Hagerstown, MD 21740
|
4,560 sq. feet
|
4 baths - beds |
show details | |

|
#19
Noland Dr
Hagerstown, MD 21740
|
1,418 sq. feet
|
1 baths - beds |
show details | |

|
#20
Lindsay Ln
Hagerstown, MD 21742
|
1,932 sq. feet
|
3 baths - beds |
show details |
| Photo | Address | Area | Beds / Baths | Price | Details |
|---|---|---|---|---|---|

|
#21
Lincoln Hts
Hagerstown, MD 21740
|
2,323 sq. feet
|
2 baths - beds |
show details | |

|
#22
Cedarwood Dr
Hagerstown, MD 21742
|
1,260 sq. feet
|
1 baths - beds |
show details | |

|
#23
Woodlands Run
Hagerstown, MD 21742
|
1,039 sq. feet
|
2 baths - beds |
show details | |

|
#24
Jefferson Blvd
Hagerstown, MD 21742
|
2,154 sq. feet
|
3 baths - beds |
show details | |

|
#25
Jamestown Dr
Hagerstown, MD 21742
|
3,105 sq. feet
|
2 baths - beds |
show details | |

|
#26
Fairview Rd
Hagerstown, MD 21742
|
1,284 sq. feet
|
1 baths - beds |
show details | |

|
#27
Antietam Dr
Hagerstown, MD 21742
|
1,916 sq. feet
|
1 baths - beds |
show details | |

|
#28
Kellys Ln
Hagerstown, MD 21742
|
1,780 sq. feet
|
2 baths - beds |
show details | |

|
#29
Atlanta Ct
Hagerstown, MD 21740
|
1,832 sq. feet
|
2 baths - beds |
show details | |

|
#30
Summit Ave
Hagerstown, MD 21740
|
2,016 sq. feet
|
1 baths - beds |
show details |
| Photo | Address | Area | Beds / Baths | Price | Details |
|---|---|---|---|---|---|

|
#31
Beaver Creek Rd
Hagerstown, MD 21740
|
1,510 sq. feet
|
1 baths - beds |
show details | |

|
#32
Samuel Cir
Hagerstown, MD 21740
|
2,580 sq. feet
|
2 baths - beds |
show details | |

|
#33
N Cannon Ave
Hagerstown, MD 21740
|
971 sq. feet
|
1 baths - beds |
show details | |

|
#34
Essex Dr
Hagerstown, MD 21742
|
2,360 sq. feet
|
3 baths - beds |
show details | |

|
#35
Marbern Rd
Hagerstown, MD 21740
|
1,627 sq. feet
|
1 baths - beds |
show details | |

|
#36
Potter Bell Way
Hagerstown, MD 21740
|
1,770 sq. feet
|
2 baths - beds |
show details | |

|
#37
Peacock Trl
Hagerstown, MD 21742
|
1,712 sq. feet
|
2 baths - beds |
show details | |

|
#38
Lanvale St
Hagerstown, MD 21740
|
1,472 sq. feet
|
1 baths - beds |
show details | |

|
#39
Virginia Ave
Hagerstown, MD 21740
|
1,568 sq. feet
|
1 baths - beds |
show details | |

|
#40
Pheasant Trl
Hagerstown, MD 21742
|
1,348 sq. feet
|
1 baths - beds |
show details |
| Photo | Address | Area | Beds / Baths | Price | Details |
|---|---|---|---|---|---|

|
#41
Salem Ave
Hagerstown, MD 21740
|
1,560 sq. feet
|
2 baths - beds |
show details | |

|
#42
Lantern Ln
Hagerstown, MD 21740
|
2,358 sq. feet
|
3 baths - beds |
show details | |

|
#43
Jefferson Blvd
Hagerstown, MD 21742
|
1,632 sq. feet
|
2 baths - beds |
show details | |

|
#44
Gaywood Dr
Hagerstown, MD 21740
|
1,881 sq. feet
|
1 baths - beds |
show details | |

|
#45
Old National Pike
Hagerstown, MD 21740
|
2,004 sq. feet
|
1 baths - beds |
show details | |

|
#46
Babylon Ct
Hagerstown, MD 21742
|
3,684 sq. feet
|
4 baths - beds |
show details | |

|
#47
Timberlane
Hagerstown, MD 21740
|
2,144 sq. feet
|
2 baths - beds |
show details | |

|
#48
Petmar Cir
Hagerstown, MD 21742
|
2,072 sq. feet
|
2 baths - beds |
show details | |

|
#49
Cambridge Dr
Hagerstown, MD 21742
|
2,324 sq. feet
|
2 baths - beds |
show details | |

|
Check over 1 million property listings on Foreclosure.com!
|
browse all offers | |||

Latest news about housing in Hagerstown, MD collected exclusively by city-data.com from local newspapers, TV, and radio stations

 | Where to stay (Apartments) jobs in Hagerstown & Annapolis (7 replies) |
| 1400 haven road Hagerstown Maryland stone ridge apartments (0 replies) |
| Hagerstown - rowhouses, housing density, etc. (4 replies) |
| Living in the Core of Hagerstown (3 replies) |
| Hagerstown....what happened to ye? (15 replies) |
| Apartments to look at in Hagerstown (6 replies) |
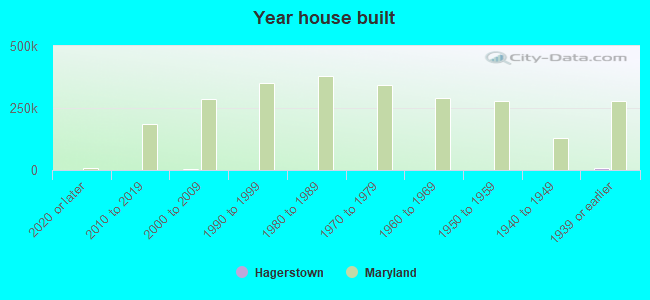
Median year apartment built: 1961
Household type by relationship:
Households: 43,639- Male householders: 8,009 (3,318 living alone), Female householders: 10,260 (3,495 living alone)
5,655 spouses (5,621 opposite-sex spouses), 1,837 unmarried partners, (1,756 opposite-sex unmarried partners), 12,171 children (11,090 natural, 224 adopted, 857 stepchildren), 1,347 grandchildren, 585 brothers or sisters, 519 parents, 30 foster children, 704 other relatives, 1,494 non-relatives
- In group quarters: 1,024
Size of family households: 3,735 2-persons, 2,303 3-persons, 1,689 4-persons, 1,058 5-persons, 478 6-persons, 173 7-or-more-persons.
Size of nonfamily households: 7,192 1-person, 1,593 2-persons, 68 3-persons, 109 4-persons, 13 5-persons, 65 7-or-more-persons.
4,380 married couples with children.
4,727 single-parent households (394 men, 4,333 women).
87.4% of residents of Hagerstown speak English at home.
6.8% of residents speak Spanish at home (63% speak English very well, 17% speak English well, 14% speak English not well, 5% don't speak English at all).
2.8% of residents speak other Indo-European language at home (80% speak English very well, 14% speak English well, 6% speak English not well, 1% don't speak English at all).
0.7% of residents speak Asian or Pacific Island language at home (97% speak English very well, 3% speak English not well).
1.7% of residents speak other language at home (92% speak English very well, 6% speak English well, 2% speak English not well).
Foreign born population: 2,992 (6.9%)
(51.3% of them are naturalized citizens)
| Here: | 6.2 |
| State: | 7.3 |
| Here: | 4.7 |
| State: | 4.2 |
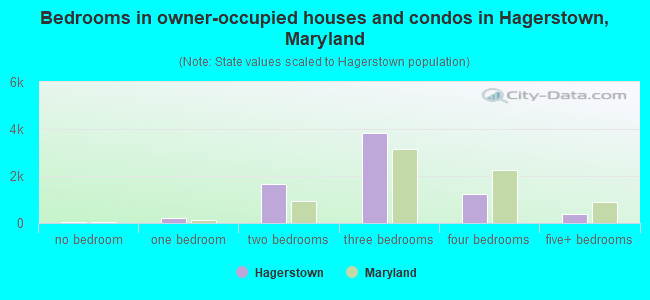
- Bedrooms in owner-occupied houses and condos in Hagerstown, Maryland
- 49no bedroom
- 2061 bedroom
- 1,6522 bedrooms
- 3,8253 bedrooms
- 1,2214 bedrooms
- 4005+ bedrooms
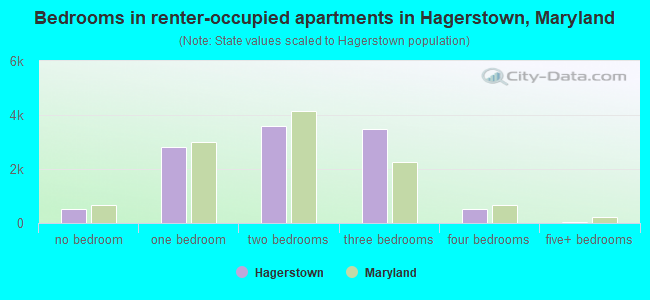
- Bedrooms in renter-occupied apartments in Hagerstown, Maryland
- 530no bedroom
- 2,8101 bedroom
- 3,5882 bedrooms
- 3,4743 bedrooms
- 5044 bedrooms
- 475+ bedrooms
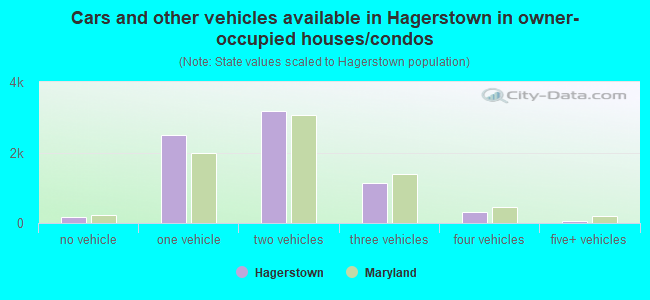
- Cars and other vehicles available in Hagerstown in owner-occupied houses/condos
- 178no vehicle
- 2,4961 vehicle
- 3,1822 vehicles
- 1,1263 vehicles
- 3214 vehicles
- 505+ vehicles
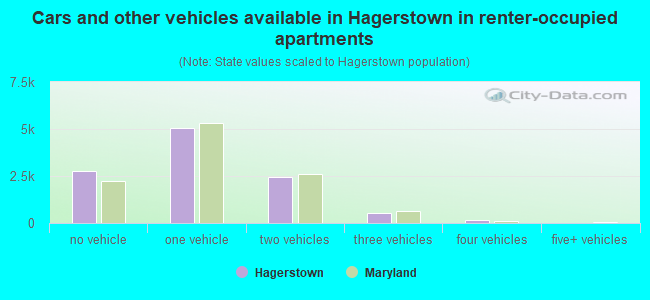
- Cars and other vehicles available in Hagerstown in renter-occupied apartments
- 2,782no vehicle
- 5,0391 vehicle
- 2,4252 vehicles
- 5363 vehicles
- 1714 vehicles
- 05+ vehicles
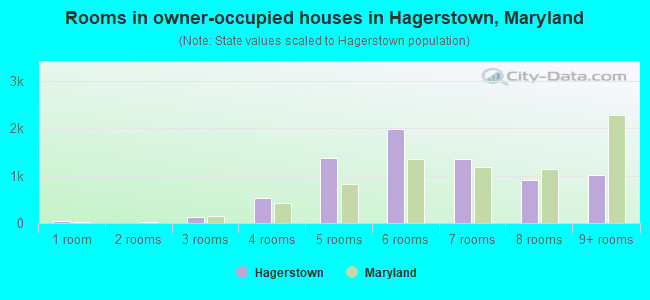
- Rooms in owner-occupied houses in Hagerstown, Maryland
- 491 room
- 32 rooms
- 1223 rooms
- 5234 rooms
- 1,3795 rooms
- 1,9916 rooms
- 1,3577 rooms
- 9108 rooms
- 1,0189+ rooms
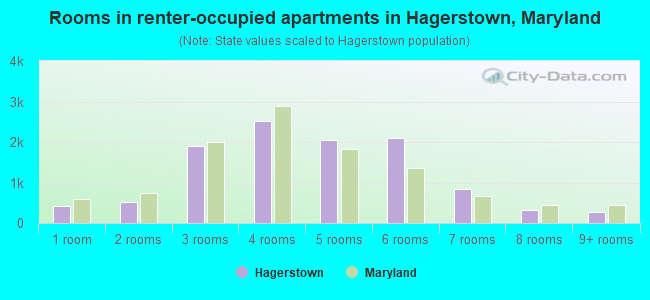
- Rooms in renter-occupied apartments in Hagerstown, Maryland
- 4291 room
- 5292 rooms
- 1,9003 rooms
- 2,5114 rooms
- 2,0485 rooms
- 2,0976 rooms
- 8467 rooms
- 3318 rooms
- 2619+ rooms
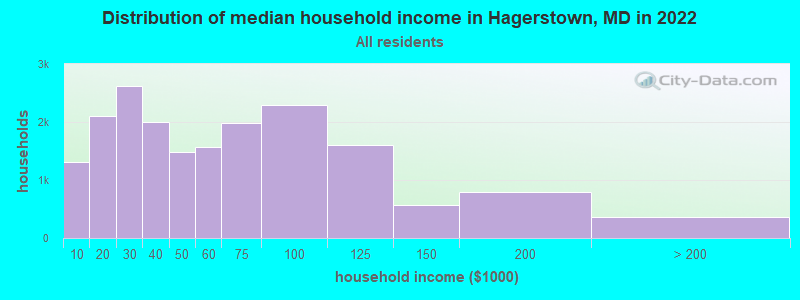
Hagerstown, MD household income distribution

- 1,311Less than $10,000
- 2,107$10,000 to $19,999
- 2,614$20,000 to $29,999
- 2,008$30,000 to $39,999
- 1,479$40,000 to $49,999
- 1,568$50,000 to $59,999
- 1,978$60,000 to $74,999
- 2,297$75,000 to $99,999
- 1,599$100,000 to $124,999
- 561$125,000 to $149,999
- 785$150,000 to $199,999
- 362$200,000 or more
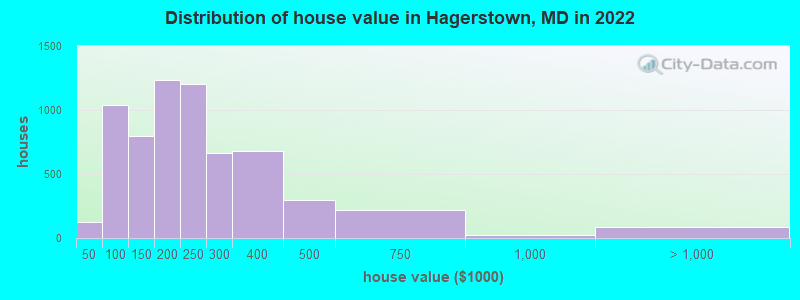
Home value of owner - occupied houses in 2022 in Hagerstown, MD
-
- 51Less than $10,000
- 11$10,000 to $14,999
- 56$15,000 to $19,999
- 3$25,000 to $29,999
- 82$50,000 to $59,999
- 80$60,000 to $69,999
- 438$70,000 to $79,999
- 122$80,000 to $89,999
- 312$90,000 to $99,999
- 346$100,000 to $124,999
- 453$125,000 to $149,999
- 720$150,000 to $174,999
- 510$175,000 to $199,999
- 1,205$200,000 to $249,999
- 662$250,000 to $299,999
- 680$300,000 to $399,999
- 293$400,000 to $499,999
- 218$500,000 to $749,999
- 26$750,000 to $999,999
- 88$1,000,000 to $1,499,999
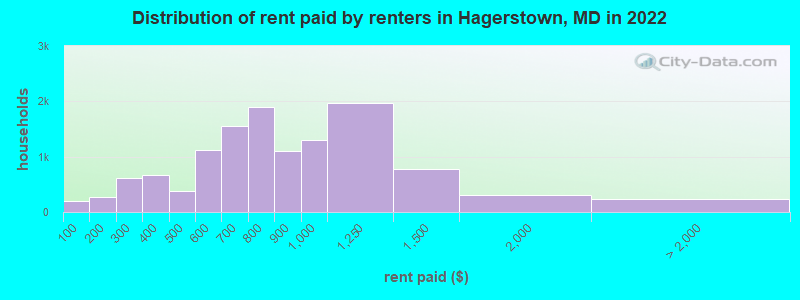
Rent paid by renters in 2022 in Hagerstown, MD
-
- 195Less than $100
- 71$100 to $149
- 192$150 to $199
- 280$200 to $249
- 336$250 to $299
- 439$300 to $349
- 233$350 to $399
- 171$400 to $449
- 204$450 to $499
- 359$500 to $549
- 755$550 to $599
- 860$600 to $649
- 690$650 to $699
- 990$700 to $749
- 900$750 to $799
- 1,106$800 to $899
- 1,294$900 to $999
- 1,960$1,000 to $1,249
- 784$1,250 to $1,499
- 313$1,500 to $1,999
- 38$2,000 to $2,499
- 32$2,500 to $2,999
- 18$3,500 or more
- 138No cash rent
Percentage of workers working in this county: 69.9%
Number of people working at home: 1,984 (10.8% of all workers)
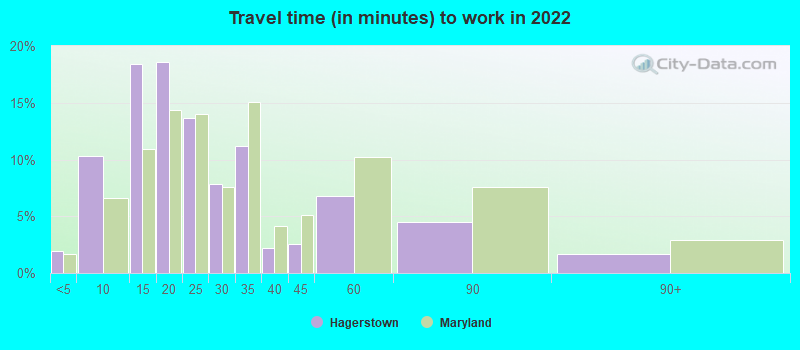
Travel time to work (commute)
- Less than 5 minutes: 469
- 5 to 9 minutes: 1,790
- 10 to 14 minutes: 2,959
- 15 to 19 minutes: 3,683
- 20 to 24 minutes: 1,717
- 25 to 29 minutes: 805
- 30 to 34 minutes: 1,437
- 35 to 39 minutes: 258
- 40 to 44 minutes: 538
- 45 to 59 minutes: 655
- 60 to 89 minutes: 1,139
- 90 or more minutes: 791
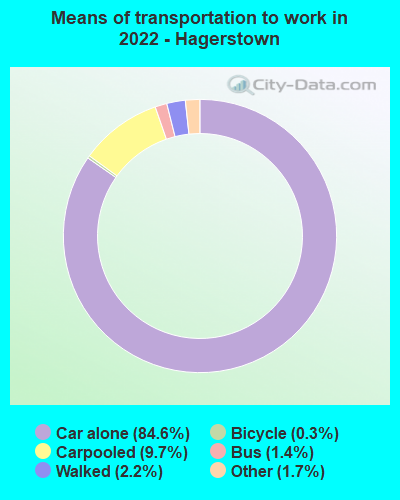
Means of transportation to work:
- Drove a car alone: 19,726 (75.3%)
- Carpooled: 2,416 (9.2%)
- Bus: 254 (1.0%)
- Ferryboat: 10 (0.0%)
- Taxi: 455 (1.7%)
- Bicycle: 91 (0.3%)
- Walked: 496 (1.9%)
- Worked at home: 1,984 (7.6%)
- Unemployment by race in 2022
- Unemployment rate for White non-Hispanic residents
- 3.0%Males
- 4.1%Females
- Unemployment rate for Black residents
- 14.5%Males
- 11.2%Females
- Unemployment rate for Asian residents
- 2.0%Males
- Unemployment rate for other race residents
- 2.6%Males
- 2.3%Females
- Unemployment rate for two or more race residents
- 12.7%Males
- 19.9%Females
- Unemployment rate for Hispanic or Latino residents
- 0.7%Males
- 16.3%Females
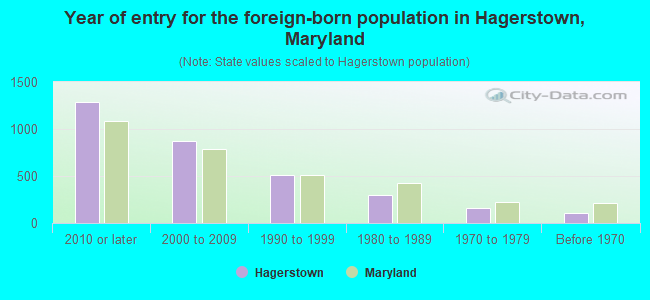
- Year of entry for the foreign-born population in Hagerstown, Maryland
- 1,2842010 or later
- 8692000 to 2009
- 5101990 to 1999
- 2941980 to 1989
- 1631970 to 1979
- 108Before 1970
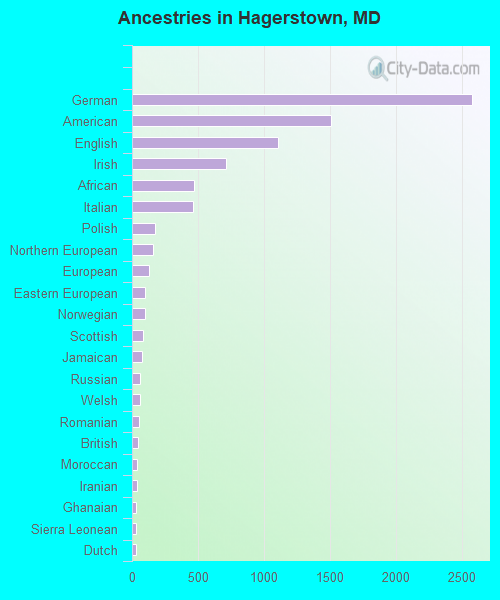
First ancestries reported:
- German: 2,578 (15.1%)
- American: 1,508 (8.8%)
- English: 1,110 (6.5%)
- Irish: 712 (4.2%)
- African: 472 (2.8%)
- Italian: 460 (2.7%)
- Polish: 176 (1.0%)
- Northern European: 161 (0.9%)
- European: 129 (0.8%)
- Eastern European: 97 (0.6%)
- Norwegian: 96 (0.6%)
- Scottish: 81 (0.5%)
- Jamaican: 75 (0.4%)
- Russian: 58 (0.3%)
- Welsh: 57 (0.3%)
- Romanian: 55 (0.3%)
- British: 42 (0.2%)
- Moroccan: 41 (0.2%)
- Iranian: 35 (0.2%)
- Ghanaian: 29 (0.2%)
- Sierra Leonean: 29 (0.2%)
- Dutch: 27 (0.2%)
- Scotch-Irish: 20 (0.1%)
- Danish: 19 (0.1%)
- Hungarian: 18 (0.1%)
- French: 17 (0.10%)
- Celtic: 16 (0.09%)
- Ukrainian: 16 (0.09%)
- Slavic: 14 (0.08%)
- Swedish: 13 (0.08%)
- Swiss: 10 (0.06%)
- Haitian: 10 (0.06%)
- West Indian: 10 (0.06%)
- Egyptian: 8 (0.05%)
- Canadian: 7 (0.04%)
- Lithuanian: 6 (0.04%)
- Czechoslovakian: 5 (0.03%)
- Australian: 3 (0.02%)
- Austrian: 2 (0.01%)
- Scandinavian: 2 (0.01%)
Most common places of birth for foreign-born residents (%):
| Hagerstown: | 9.6% (305) |
| Maryland: | 1.4% (13,947) |
| Hagerstown: | 8.3% (263) |
| Maryland: | 0.8% (8,109) |
| Hagerstown: | 8.1% (259) |
| Maryland: | 3.5% (34,065) |
| Hagerstown: | 5.0% (159) |
| Maryland: | 2.5% (24,026) |
| Hagerstown: | 4.5% (143) |
| Maryland: | 12.0% (115,412) |
| Hagerstown: | 4.5% (143) |
| Maryland: | 0.5% (4,689) |
| Hagerstown: | 4.2% (134) |
| Maryland: | 0.9% (8,603) |
| Hagerstown: | 4.0% (127) |
| Maryland: | 6.4% (61,725) |
| Hagerstown: | 3.8% (122) |
| Maryland: | 2.5% (23,969) |
| Hagerstown: | 3.7% (117) |
| Maryland: | 1.8% (17,774) |
| Hagerstown: | 3.6% (113) |
| Maryland: | 0.7% (6,724) |
| Hagerstown: | 3.2% (103) |
| Maryland: | 1.1% (10,233) |
| Hagerstown: | 3.1% (99) |
| Maryland: | 1.8% (17,037) |
| Hagerstown: | 2.8% (88) |
| Maryland: | 0.5% (4,901) |
| Hagerstown: | 2.3% (72) |
| Maryland: | 2.8% (27,444) |
| Hagerstown: | 2.0% (65) |
| Maryland: | 0.7% (6,326) |
| Hagerstown: | 2.0% (63) |
| Maryland: | 4.4% (42,350) |
| Hagerstown: | 2.0% (63) |
| Maryland: | 3.8% (36,698) |
| Hagerstown: | 1.9% (60) |
| Maryland: | 4.6% (44,742) |
| Hagerstown: | 1.5% (49) |
| Maryland: | 1.2% (11,980) |
Place of birth for U.S.-born residents:
- This state: 26,038
- Other state: 13,677
- Northeast: 4,680
- Midwest: 959
- South: 7,036
- West: 1,119
87.6% of Hagerstown residents lived in the same house 1 years ago.
Out of people who lived in different houses, 40.7% lived in this county.
Out of people who lived in different counties, 57.6% lived in Maryland.
| Hagerstown: | 87.6% |
| State average: | 88.5% |
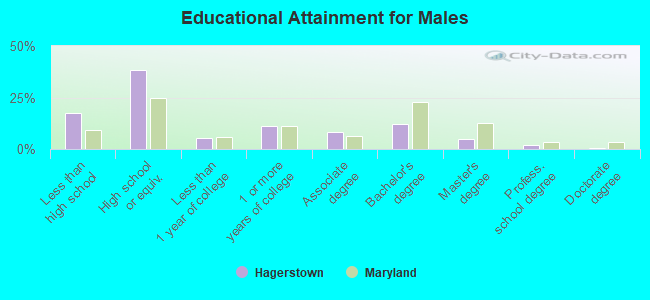
Education attainment for males 25 years and older:
- No schooling: 638
- Nursery to 4th grade: 0
- 5th and 6th grade: 100
- 7th and 8th grade: 425
- 9th grade: 364
- 10th grade: 349
- 11th grade: 257
- 12th grade, no diploma: 262
- High school graduate (or equivalency): 5,215
- Less than 1 year of college: 736
- Some college more than 1 year, no degree: 1,500
- Associate degree: 1,103
- Bachelor's degree: 1,652
- Master's degree: 687
- Professional school degree: 242
- Doctorate degree: 68
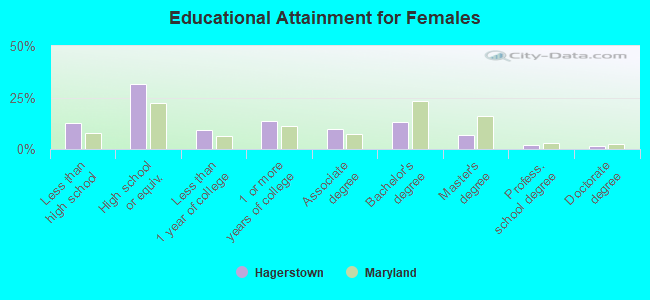
Education attainment for females 25 years and older:
- No schooling: 467
- Nursery to 4th grade: 84
- 5th and 6th grade: 50
- 7th and 8th grade: 69
- 9th grade: 457
- 10th grade: 280
- 11th grade: 200
- 12th grade, no diploma: 330
- High school graduate (or equivalency): 4,858
- Less than 1 year of college: 1,434
- Some college more than 1 year, no degree: 2,055
- Associate degree: 1,476
- Bachelor's degree: 1,970
- Master's degree: 1,074
- Professional school degree: 313
- Doctorate degree: 193
Housing units in structures:
- One, detached: 6,111
- One, attached: 6,377
- Two: 1,253
- 3 or 4: 1,699
- 5 to 9: 1,619
- 10 to 19: 1,708
- 20 to 49: 533
- 50 or more: 720
- Mobile homes: 37
Housing units lacking complete kitchen facilities in 2022: 2.3%
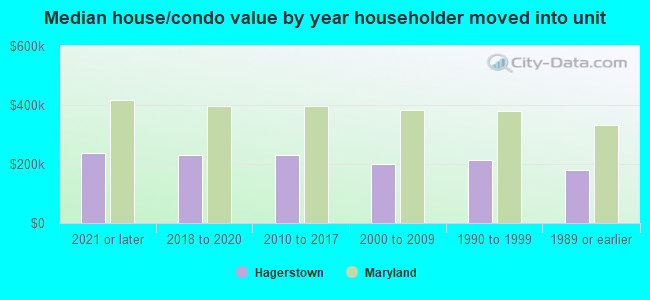
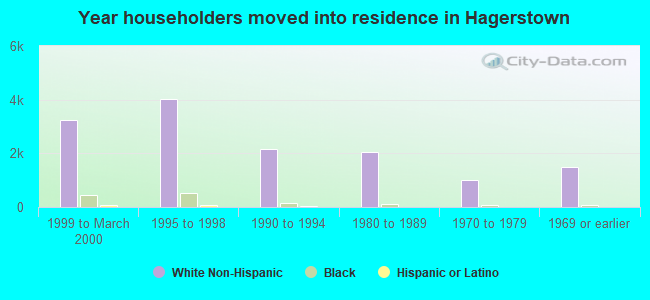
House/condo owner moved in on average 12 years ago
Renter moved in on average 3 years ago
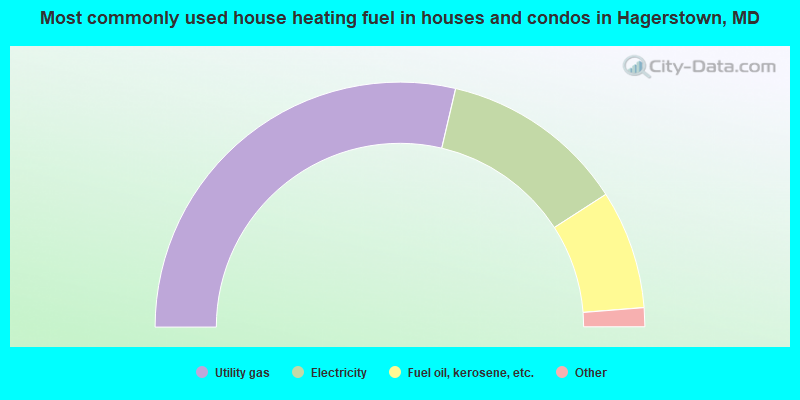
- 57.3%Utility gas
- 24.5%Electricity
- 15.7%Fuel oil, kerosene, etc.
- 1.1%Wood
- 0.9%Bottled, tank, or LP gas
- 0.5%No fuel used
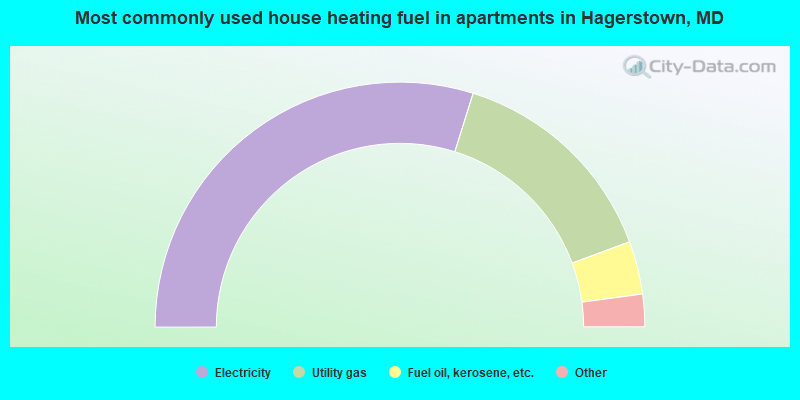
- 59.6%Electricity
- 29.0%Utility gas
- 7.0%Fuel oil, kerosene, etc.
- 2.5%Bottled, tank, or LP gas
- 1.1%No fuel used
- 0.7%Other fuel
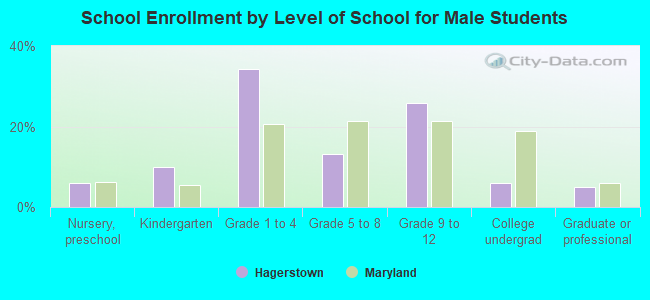
Private vs. public school enrollment:
| Here: | 7.6% |
| Maryland: | 15.2% |
| Here: | 11.9% |
| Maryland: | 14.4% |
| Here: | 19.1% |
| Maryland: | 20.2% |