Housing density: 1,156 houses/condos per square mile
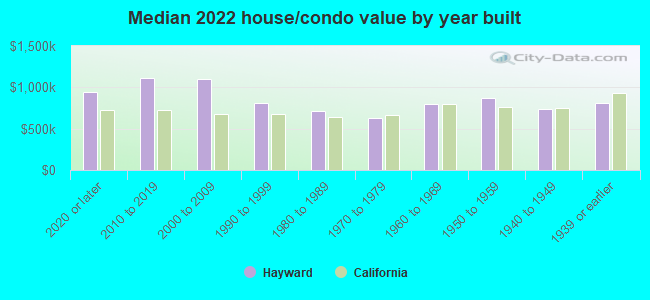
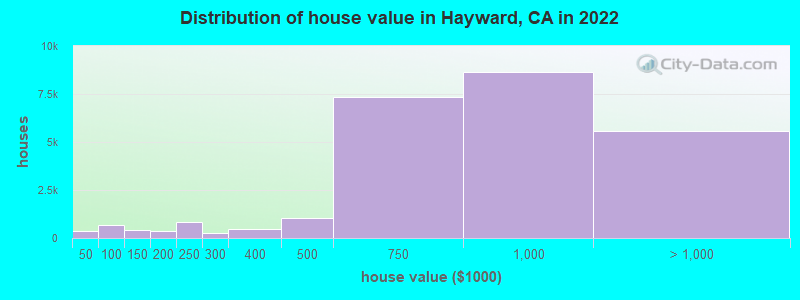
Median price asked for vacant for-sale houses and condos in 2022: $840,726.
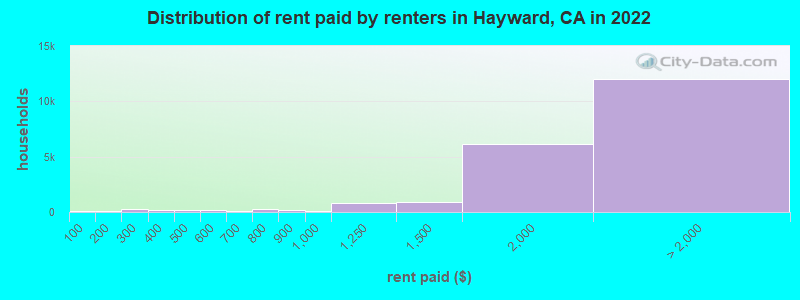
Median contract rent in 2022: $1,986 (lower quartile is $1,607, upper quartile is over $2,000)
Median rent asked for vacant for-rent units in 2022: $723
Median gross rent in Hayward, CA in 2022: over $2,000
Housing units in Hayward with a mortgage: 19,074 (1,912 second mortgage, 142 home equity loan, 1,605 both second mortgage and home equity loan) Houses without a mortgage: 339
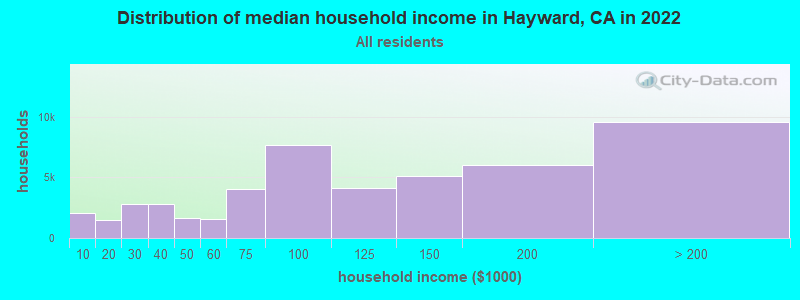
Median household income for houses/condos with a mortgage: $163,235
Median household income for apartments without a mortgage: $89,380
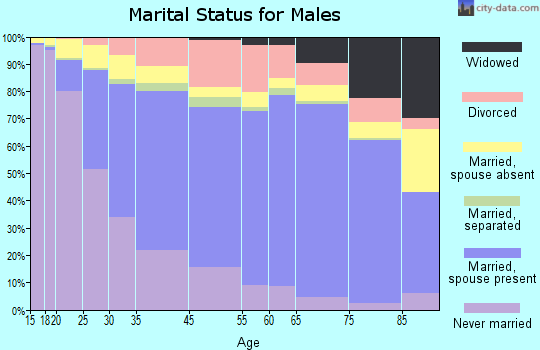
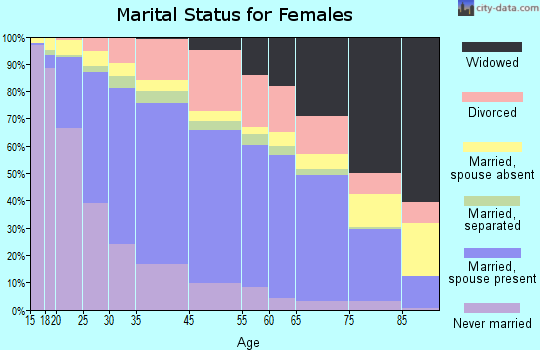
17,572 married couples with children.
7,694 single-parent households (3,152 men, 4,542 women).
40.2% of residents of Hayward speak English at home.
31.8% of residents speak Spanish at home (53% speak English very well, 23% speak English well, 16% speak English not well, 9% don't speak English at all).
7.5% of residents speak other Indo-European language at home (77% speak English very well, 16% speak English well, 6% speak English not well, 2% don't speak English at all).
19.8% of residents speak Asian or Pacific Island language at home (53% speak English very well, 29% speak English well, 13% speak English not well, 5% don't speak English at all).
0.8% of residents speak other language at home (62% speak English very well, 7% speak English well, 31% speak English not well).
Foreign born population: 67,025 (42.8%)
(54.4% of them are naturalized citizens)
Percentage of workers working in this county: 73.8% Number of people working at home: 10,542 (13.4% of all workers)
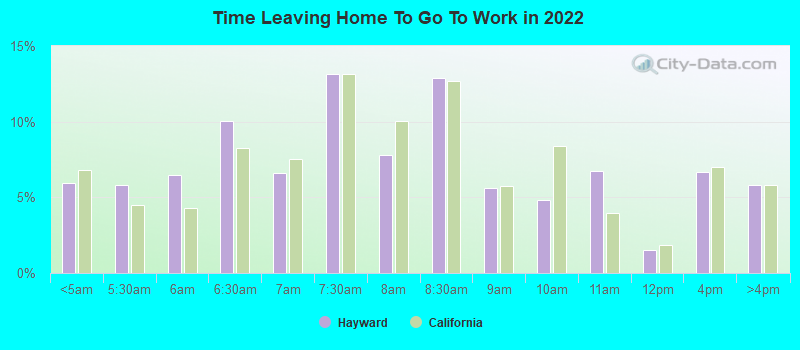
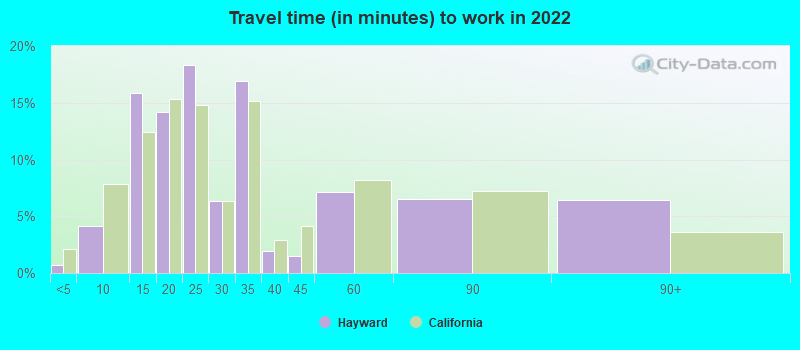
Travel time to work (commute)
Less than 5 minutes: 634
5 to 9 minutes: 1,842
10 to 14 minutes: 6,956
15 to 19 minutes: 8,328
20 to 24 minutes: 10,122
25 to 29 minutes: 2,866
30 to 34 minutes: 13,914
35 to 39 minutes: 2,748
40 to 44 minutes: 4,563
45 to 59 minutes: 10,842
60 to 89 minutes: 4,400
90 or more minutes: 892
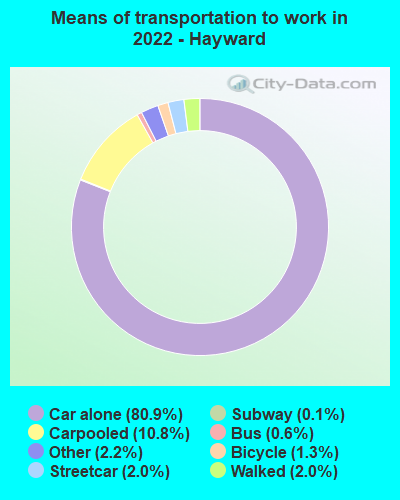
Means of transportation to work:
Drove a car alone: 44,353 (67.9%)
Carpooled: 5,942 (9.1%)
Bus: 307 (0.5%)
Subway or elevated rail: 1,118 (1.7%)
Long-distance train or commuter rail: 82 (0.1%)
Taxi: 1,224 (1.9%)
Bicycle: 696 (1.1%)
Walked: 1,071 (1.6%)
Worked at home: 10,542 (16.1%)
Unemployment by race in 2022
Unemployment rate for White non-Hispanic residents
3.9%Males
6.4%Females
Unemployment rate for Black residents
11.2%Males
18.7%Females
Unemployment rate for American Indian and Alaska Native residents
4.0%Males
12.6%Females
Unemployment rate for Asian residents
2.1%Males
1.8%Females
Unemployment rate for other race residents
4.4%Males
6.0%Females
Unemployment rate for two or more race residents
12.0%Males
4.2%Females
Unemployment rate for Hispanic or Latino residents
5.8%Males
6.4%Females
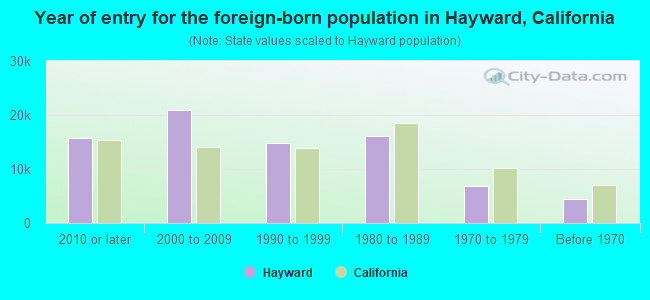
Year of entry for the foreign-born population in Hayward, California
15,6972010 or later
20,9872000 to 2009
14,8181990 to 1999
16,1721980 to 1989
6,8441970 to 1979
4,410Before 1970
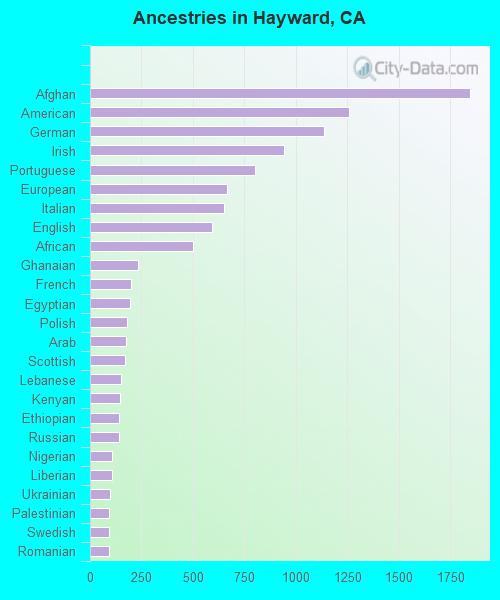
First ancestries reported:
Afghan: 1,847 (1.8%)
American: 1,258 (1.2%)
German: 1,135 (1.1%)
Irish: 944 (0.9%)
Portuguese: 800 (0.8%)
European: 665 (0.6%)
Italian: 652 (0.6%)
English: 594 (0.6%)
African: 499 (0.5%)
Ghanaian: 235 (0.2%)
French: 199 (0.2%)
Egyptian: 193 (0.2%)
Polish: 182 (0.2%)
Arab: 173 (0.2%)
Scottish: 171 (0.2%)
Lebanese: 149 (0.1%)
Kenyan: 146 (0.1%)
Ethiopian: 141 (0.1%)
Russian: 141 (0.1%)
Nigerian: 108 (0.1%)
Liberian: 107 (0.1%)
Ukrainian: 96 (0.09%)
Palestinian: 94 (0.09%)
Swedish: 93 (0.09%)
Romanian: 91 (0.09%)
British: 87 (0.08%)
Scotch-Irish: 86 (0.08%)
Norwegian: 81 (0.08%)
Scandinavian: 77 (0.07%)
Jordanian: 63 (0.06%)
Northern European: 57 (0.06%)
Finnish: 52 (0.05%)
Dutch: 52 (0.05%)
Hungarian: 51 (0.05%)
Bulgarian: 50 (0.05%)
Belgian: 43 (0.04%)
Brazilian: 40 (0.04%)
Iranian: 39 (0.04%)
Turkish: 37 (0.04%)
Swiss: 35 (0.03%)
British West Indian: 33 (0.03%)
Croatian: 30 (0.03%)
Greek: 23 (0.02%)
Jamaican: 21 (0.02%)
Armenian: 21 (0.02%)
Slavic: 19 (0.02%)
Danish: 19 (0.02%)
Czech: 19 (0.02%)
Lithuanian: 18 (0.02%)
French Canadian: 18 (0.02%)
Slovak: 15 (0.01%)
Cape Verdean: 15 (0.01%)
Eastern European: 14 (0.01%)
Guyanese: 9 (0.01%)
Maltese: 8 (0.01%)
Sierra Leonean: 8 (0.01%)
Assyrian: 7 (0.01%)
Czechoslovakian: 6 (0.01%)
Canadian: 6 (0.01%)
Most common places of birth for foreign-born residents (%):
Mexico
Hayward:
27.4% (17,985)
California:
37.2% (3,881,193)
Philippines
Hayward:
18.1% (11,835)
California:
7.8% (818,297)
India
Hayward:
8.4% (5,514)
California:
5.2% (539,184)
China, excluding Hong Kong and Taiwan
Hayward:
7.5% (4,949)
California:
6.6% (684,672)
Vietnam
Hayward:
4.9% (3,211)
California:
4.9% (512,335)
El Salvador
Hayward:
4.3% (2,825)
California:
4.2% (440,287)
Guatemala
Hayward:
3.5% (2,278)
California:
2.8% (290,436)
Afghanistan
Hayward:
3.1% (2,000)
California:
0.5% (53,260)
Fiji
Hayward:
2.6% (1,722)
California:
0.3% (33,937)
Hong Kong
Hayward:
2.3% (1,522)
California:
1.0% (105,215)
Nicaragua
Hayward:
2.1% (1,380)
California:
0.6% (58,161)
Peru
Hayward:
1.5% (988)
California:
0.7% (74,025)
Place of birth for U.S.-born residents:
This state: 73,856
Other state: 11,903
Northeast: 2,528
Midwest: 1,908
South: 4,271
West: 3,196
91.5% of Hayward residents lived in the same house 1 years ago. Out of people who lived in different houses, 35.2% lived in this county. Out of people who lived in different counties, 80.5% lived in California.
Hayward:
91.5%
State average:
88.9%
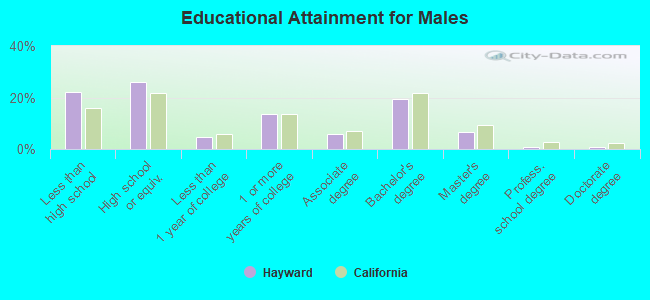
Education attainment for males 25 years and older:
No schooling: 4,535
Nursery to 4th grade: 1,291
5th and 6th grade: 1,239
7th and 8th grade: 1,245
9th grade: 1,058
10th grade: 395
11th grade: 398
12th grade, no diploma: 2,239
High school graduate (or equivalency): 14,536
Less than 1 year of college: 2,720
Some college more than 1 year, no degree: 7,586
Associate degree: 3,167
Bachelor's degree: 10,807
Master's degree: 3,746
Professional school degree: 542
Doctorate degree: 535
Education attainment for females 25 years and older:
No schooling: 3,369
Nursery to 4th grade: 657
5th and 6th grade: 1,721
7th and 8th grade: 870
9th grade: 1,298
10th grade: 302
11th grade: 203
12th grade, no diploma: 1,142
High school graduate (or equivalency): 11,885
Less than 1 year of college: 2,968
Some college more than 1 year, no degree: 8,311
Associate degree: 4,648
Bachelor's degree: 13,397
Master's degree: 4,973
Professional school degree: 1,074
Doctorate degree: 493
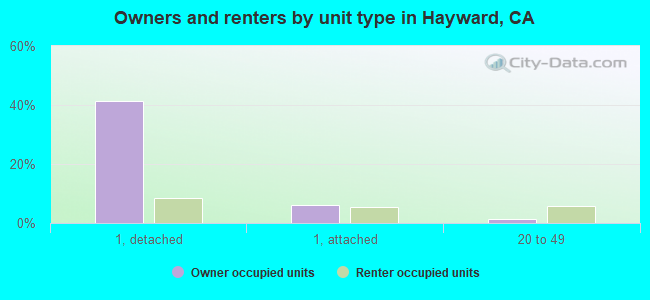
Housing units in structures:
One, detached: 25,040
One, attached: 6,017
Two: 564
3 or 4: 3,250
5 to 9: 2,150
10 to 19: 2,396
20 to 49: 3,617
50 or more: 5,893
Mobile homes: 2,114
Boats, RVs, vans, etc.: 205
Median worth of mobile homes: $215,000
Housing units lacking complete plumbing facilities in 2022: 0.5%
Housing units lacking complete kitchen facilities in 2022: 1.4%
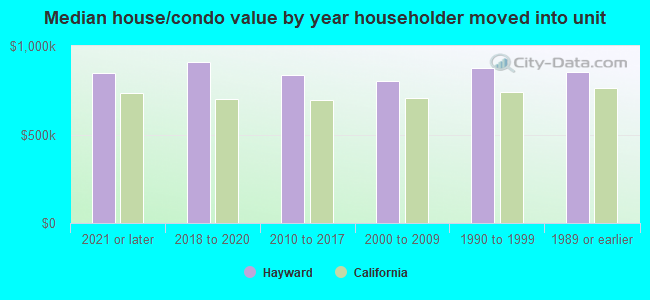
House/condo owner moved in on average 10 years ago