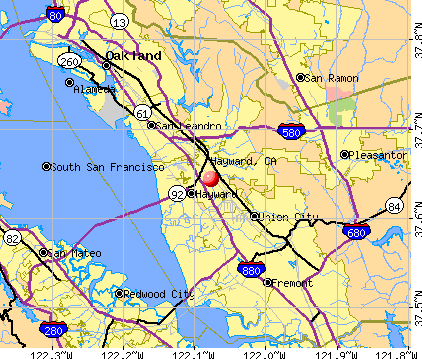
Hayward, California
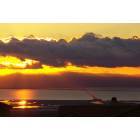
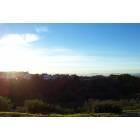
Hayward: View from Hayward Hilss to San Mateo Bridge
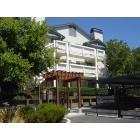
Hayward: 26851 Hayward Boulevard- Top floor w/vaulted ceilings, 1 Mstrs suite, 2nd bdrm, hallway bath, granite kitchen & bath counter tops, Shows beautifully and great location above Cal State!
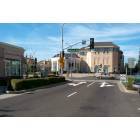
Hayward: View of the new City Hall from B street
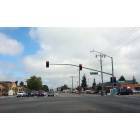
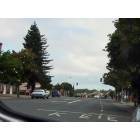
Hayward: Hayward Hesperian Blvd at West A Street
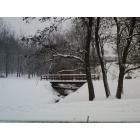
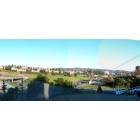
Hayward: Neighborhood view Hayward hills
Hayward
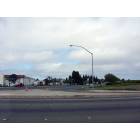
Hayward: Hayward Hesperian at West Winton near airport
Hayward: View of the Entrace to Hayward from Hiway 580 near 238,
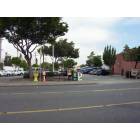
Hayward: Hayward downtown parking lot on A St. almost at Foothill.
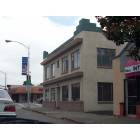
Hayward: Hayward downtown A street at 2nd St.
Hayward: Hayward downtown A Street almost at Foothill toward Main St.
- add
your


Submit your own pictures of this city and show them to the world
- OSM Map
- General Map
- Google Map
- MSN Map
Population change since 2000: +11.9%
 |
| Males: 78,244 | |
| Females: 78,510 |
| Median resident age: | 38.7 years |
| California median age: | 37.9 years |
Zip codes: 94544, 94545, 94586, 94587, 94588.
Hayward Zip Code Map| Hayward: | $101,199 |
| CA: | $91,551 |
Estimated per capita income in 2022: $41,206 (it was $19,695 in 2000)
Hayward city income, earnings, and wages data
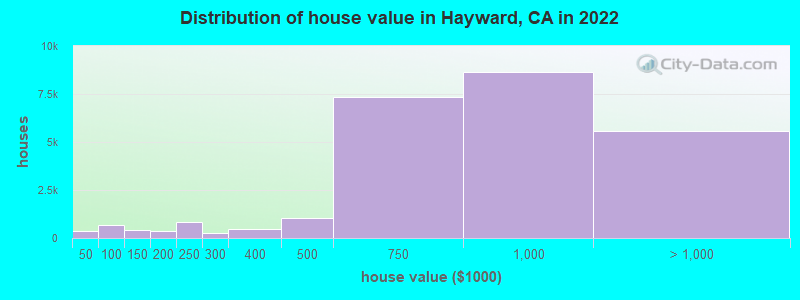
Estimated median house or condo value in 2022: $850,400 (it was $223,800 in 2000)
| Hayward: | $850,400 |
| CA: | $715,900 |
Mean prices in 2022: all housing units: $852,852; detached houses: $943,651; townhouses or other attached units: $840,709; in 3-to-4-unit structures: $604,907; in 5-or-more-unit structures: $495,180; mobile homes: $186,464
Median gross rent in 2022: $2,227.
(11.2% for White Non-Hispanic residents, 13.4% for Black residents, 18.6% for Hispanic or Latino residents, 7.5% for American Indian residents, 10.8% for Native Hawaiian and other Pacific Islander residents, 16.6% for other race residents, 12.0% for two or more races residents)
Detailed information about poverty and poor residents in Hayward, CA


Compare current foreclosures in Hayward, CA:
| Photo | Address | Area | Beds / Baths | Price | Details |
|---|---|---|---|---|---|

|
#1
Joyce St
Hayward, CA 94544
|
1,000 sq. feet
|
1 baths 3 beds |
show details | |

|
#2
Tribune Ave
Hayward, CA 94542
|
2,234 sq. feet
|
2 baths 4 beds |
show details | |

|
#3
3rd St
Hayward, CA 94541
|
1,324 sq. feet
|
1 baths 2 beds |
show details | |

|
#4
Prospect St
Hayward, CA 94541
|
3,038 sq. feet
|
5 baths 10 beds |
show details | |

|
#5
Waverly Ave
Hayward, CA 94541
|
1,182 sq. feet
|
1 baths 3 beds |
show details | |

|
#6
E 11th St
Hayward, CA 94544
|
1,785 sq. feet
|
2 baths 3 beds |
show details | |

|
#7
Mandarin Ave
Hayward, CA 94544
|
1,264 sq. feet
|
2 baths 3 beds |
show details | |

|
#8
Ormond Ave
Hayward, CA 94544
|
1,000 sq. feet
|
2 baths 3 beds |
show details | |

|
#9
La Porte Ave
Hayward, CA 94545
|
1,719 sq. feet
|
2 baths 3 beds |
show details | |

|
#10
Colette St
Hayward, CA 94544
|
951 sq. feet
|
1 baths 3 beds |
show details |
| Photo | Address | Area | Beds / Baths | Price | Details |
|---|---|---|---|---|---|

|
#11
Dickens Ave
Hayward, CA 94544
|
1,765 sq. feet
|
2 baths 4 beds |
show details | |

|
#12
Perlita Ct
Hayward, CA 94541
|
1,617 sq. feet
|
2 baths 3 beds |
show details | |

|
#13
Lori Way
Hayward, CA 94541
|
1,960 sq. feet
|
3 baths 4 beds |
show details | |

|
#14
Western Blvd
Hayward, CA 94541
|
1,230 sq. feet
|
1 baths 3 beds |
show details | |

|
#15
Laurel Ave Apt 4
Hayward, CA 94541
|
1,050 sq. feet
|
2 baths 3 beds |
show details | |

|
#16
Cherry Way
Hayward, CA 94541
|
1,116 sq. feet
|
1 baths 2 beds |
show details | |

|
#17
Meek Ave
Hayward, CA 94541
|
3,420 sq. feet
|
4 baths 6 beds |
show details | |

|
#18
Donald Ave
Hayward, CA 94544
|
1,500 sq. feet
|
2 baths 3 beds |
show details | |

|
#19
Adrian Ave
Hayward, CA 94545
|
1,244 sq. feet
|
2 baths 3 beds |
show details | |

|
#20
Hillview St
Hayward, CA 94544
|
1,763 sq. feet
|
3 baths 4 beds |
show details |
| Photo | Address | Area | Beds / Baths | Price | Details |
|---|---|---|---|---|---|

|
#21
Sandcreek Dr
Hayward, CA 94545
|
2,600 sq. feet
|
3 baths 5 beds |
show details | |

|
#22
Mattox Rd
Hayward, CA 94541
|
1,081 sq. feet
|
1 baths 2 beds |
show details | |

|
#23
Kay Ave Apt 301
Hayward, CA 94545
|
1,152 sq. feet
|
1 baths 1 beds |
show details | |

|
#24
Thorup Ln
Hayward, CA 94542
|
1,845 sq. feet
|
3 baths 3 beds |
show details | |

|
#25
Bishop Ave
Hayward, CA 94544
|
1,085 sq. feet
|
1 baths 3 beds |
show details | |

|
#26
B St # B204
Hayward, CA 94541
|
1,080 sq. feet
|
2 baths 2 beds |
show details | |

|
#27
Magnolia St
Hayward, CA 94545
|
2,019 sq. feet
|
3 baths 5 beds |
show details | |

|
#28
Flamingo Ave
Hayward, CA 94544
|
1,041 sq. feet
|
1 baths 3 beds |
show details | |

|
#29
170th Ave
Hayward, CA 94541
|
1,319 sq. feet
|
1 baths 4 beds |
show details | |

|
#30
Stromberg Ct
Hayward, CA 94545
|
1,254 sq. feet
|
1 baths 3 beds |
show details |
| Photo | Address | Area | Beds / Baths | Price | Details |
|---|---|---|---|---|---|

|
#31
Orion St
Hayward, CA 94541
|
1,114 sq. feet
|
1 baths 3 beds |
show details | |

|
#32
Linden St
Hayward, CA 94541
|
972 sq. feet
|
1 baths 2 beds |
show details | |

|
#33
Hillview St
Hayward, CA 94544
|
1,763 sq. feet
|
3 baths 4 beds |
show details | |

|
#34
Sandcreek Dr
Hayward, CA 94545
|
2,600 sq. feet
|
3 baths 5 beds |
show details | |

|
#35
Hibiscus Dr
Hayward, CA 94545
|
2,344 sq. feet
|
3 baths 6 beds |
show details | |

|
#36
Roanoke St
Hayward, CA 94544
|
1,056 sq. feet
|
1 baths 3 beds |
show details | |

|
#37
Marin Ave
Hayward, CA 94541
|
1,582 sq. feet
|
2 baths 3 beds |
show details | |

|
#38
170th Ave
Hayward, CA 94541
|
1,197 sq. feet
|
1 baths 2 beds |
show details | |

|
#39
Star Ridge Rd
Hayward, CA 94542
|
1,865 sq. feet
|
2 baths 3 beds |
show details | |

|
#40
Hurley Dr # Inlawadu
Hayward, CA 94544
|
1,601 sq. feet
|
2 baths 4 beds |
show details |
| Photo | Address | Area | Beds / Baths | Price | Details |
|---|---|---|---|---|---|

|
#41
Beatron Way
Hayward, CA 94544
|
1,115 sq. feet
|
2 baths 3 beds |
show details | |

|
#42
Bailey Ranch Rd
Hayward, CA 94542
|
3,705 sq. feet
|
4 baths 7 beds |
show details | |

|
#43
Kelly St
Hayward, CA 94541
|
1,374 sq. feet
|
2 baths 4 beds |
show details | |

|
#44
Nina St
Hayward, CA 94541
|
2,364 sq. feet
|
3 baths 5 beds |
show details | |

|
#45
Beckham Way
Hayward, CA 94541
|
2,811 sq. feet
|
3 baths 5 beds |
show details | |

|
#46
Anderly Ct
Hayward, CA 94541
|
940 sq. feet
|
2 baths 2 beds |
show details | |

|
#47
Lafayette Ave
Hayward, CA 94544
|
1,031 sq. feet
|
1 baths 3 beds |
show details | |

|
#48
Prestwick Ave
Hayward, CA 94544
|
1,134 sq. feet
|
2 baths 3 beds |
show details | |

|
#49
China Ct
Hayward, CA 94542
|
3,517 sq. feet
|
3 baths 3 beds |
show details | |

|
Check over 1 million property listings on Foreclosure.com!
|
browse all offers | |||


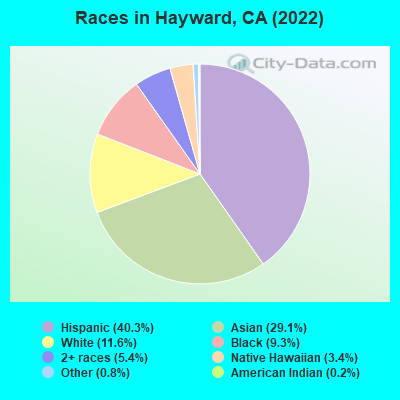
- 63,15440.3%Hispanic
- 45,68229.1%Asian alone
- 18,19111.6%White alone
- 14,5209.3%Black alone
- 8,4885.4%Two or more races
- 5,2533.4%Native Hawaiian and Other
Pacific Islander alone - 1,2270.8%Other race alone
- 2580.2%American Indian alone
According to our research of California and other state lists, there were 260 registered sex offenders living in Hayward, California as of May 08, 2024.
The ratio of all residents to sex offenders in Hayward is 611 to 1.
The ratio of registered sex offenders to all residents in this city is near the state average.
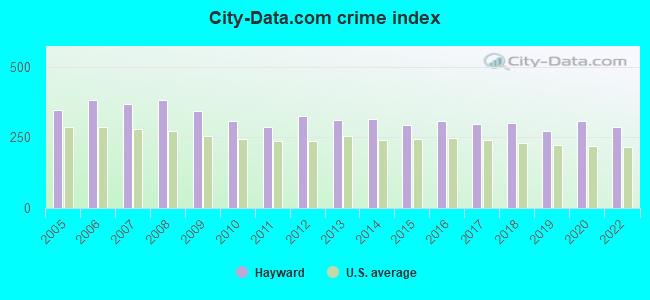
The City-Data.com crime index weighs serious crimes and violent crimes more heavily. Higher means more crime, U.S. average is 246.1. It adjusts for the number of visitors and daily workers commuting into cities.
- means the value is smaller than the state average.- means the value is about the same as the state average.
- means the value is bigger than the state average.
- means the value is much bigger than the state average.
Crime rate in Hayward detailed stats: murders, rapes, robberies, assaults, burglaries, thefts, arson
Full-time law enforcement employees in 2021, including police officers: 282 (170 officers - 153 male; 17 female).
| Officers per 1,000 residents here: | 1.07 |
| California average: | 2.30 |
 Recent articles from our blog. Our writers, many of them Ph.D. graduates or candidates, create easy-to-read articles on a wide variety of topics.


 | Hayward public school closures (8 replies) |
| Commute Estimate between Oakland and Hayward (5 replies) |
| San Leandro / Hayward - $650 to $750K SFH? (12 replies) |
| Hayward - Harder/Tennyson? (43 replies) |
| Gentrification in Hayward (136 replies) |
| Hayward, Fremont, Union City - best areas for amenities I need? (11 replies) |
Latest news from Hayward, CA collected exclusively by city-data.com from local newspapers, TV, and radio stations
Ancestries: Afghan (1.5%), American (1.5%), Portuguese (1.2%), German (1.1%).
Current Local Time: PST time zone
Land area: 44.3 square miles.
Population density: 3,536 people per square mile (average).
65,554 residents are foreign born (20.6% Asia, 16.2% Latin America).
| This city: | 41.7% |
| California: | 26.5% |
Median real estate property taxes paid for housing units with mortgages in 2022: $7,016 (0.8%)
Median real estate property taxes paid for housing units with no mortgage in 2022: $3,550 (0.5%)
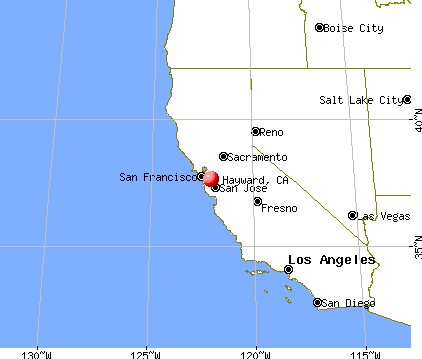
Nearest city with pop. 200,000+: Fremont, CA  (8.7 miles , pop. 203,413).
Nearest city with pop. 1,000,000+: Los Angeles, CA (321.8 miles , pop. 3,694,820).
Nearest cities:
), ), ), Latitude: 37.64 N, Longitude: 122.08 W
Daytime population change due to commuting: -13,314 (-8.5%)
Workers who live and work in this city: 24,705 (31.4%)
Area code: 510
Hayward tourist attractions:
Hayward, California accommodation & food services, waste management - Economy and Business Data
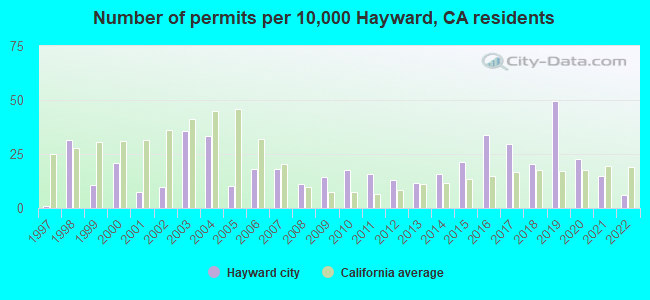
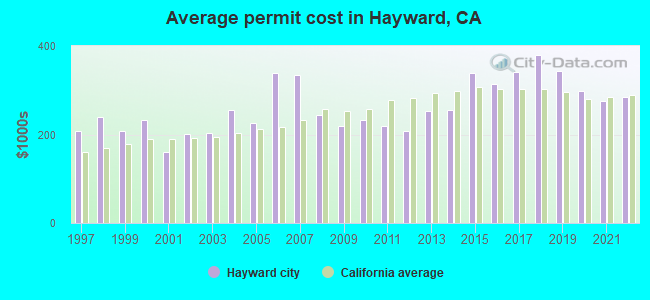
Single-family new house construction building permits:
- 2022: 86 buildings, average cost: $284,200
- 2021: 209 buildings, average cost: $274,800
- 2020: 320 buildings, average cost: $298,900
- 2019: 695 buildings, average cost: $343,900
- 2018: 284 buildings, average cost: $380,200
- 2017: 414 buildings, average cost: $342,200
- 2016: 474 buildings, average cost: $314,400
- 2015: 301 buildings, average cost: $337,900
- 2014: 222 buildings, average cost: $254,800
- 2013: 161 buildings, average cost: $252,400
- 2012: 183 buildings, average cost: $208,200
- 2011: 223 buildings, average cost: $219,700
- 2010: 248 buildings, average cost: $232,000
- 2009: 204 buildings, average cost: $220,300
- 2008: 157 buildings, average cost: $244,800
- 2007: 255 buildings, average cost: $334,000
- 2006: 253 buildings, average cost: $339,600
- 2005: 140 buildings, average cost: $225,100
- 2004: 468 buildings, average cost: $255,600
- 2003: 496 buildings, average cost: $203,800
- 2002: 134 buildings, average cost: $202,400
- 2001: 101 buildings, average cost: $159,500
- 2000: 294 buildings, average cost: $232,700
- 1999: 151 buildings, average cost: $208,200
- 1998: 442 buildings, average cost: $240,000
- 1997: 16 buildings, average cost: $208,500
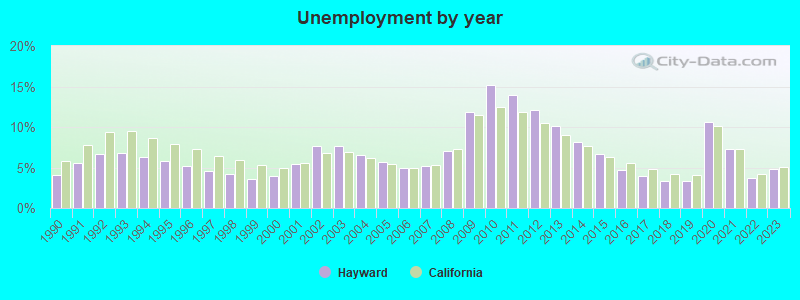
| Here: | 4.8% |
| California: | 5.1% |
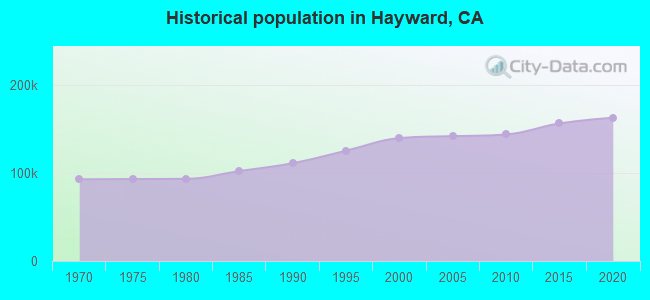
Population change in the 1990s: +25,031 (+21.8%).
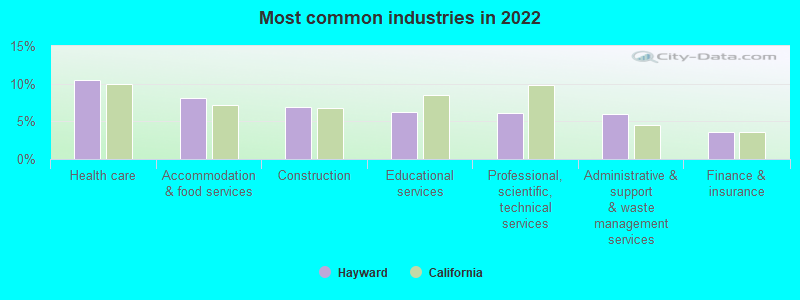
- Health care (10.5%)
- Accommodation & food services (8.1%)
- Construction (6.9%)
- Educational services (6.3%)
- Professional, scientific, technical services (6.1%)
- Administrative & support & waste management services (6.0%)
- Finance & insurance (3.5%)
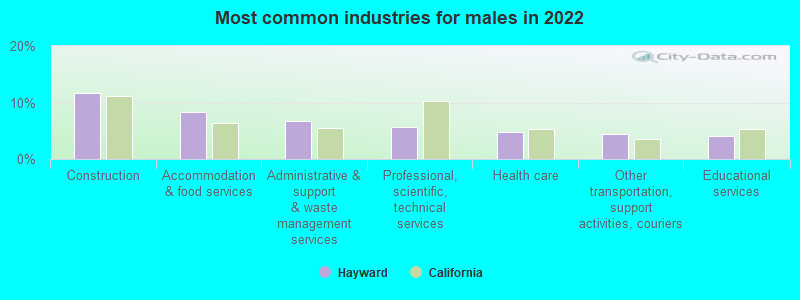
- Construction (11.8%)
- Accommodation & food services (8.3%)
- Administrative & support & waste management services (6.8%)
- Professional, scientific, technical services (5.7%)
- Health care (4.7%)
- Other transportation, support activities, couriers (4.3%)
- Educational services (4.1%)
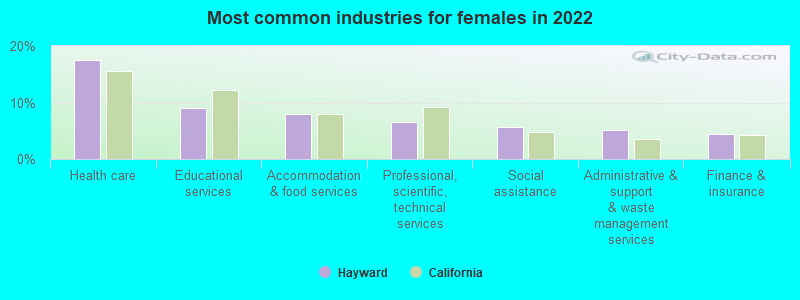
- Health care (17.4%)
- Educational services (9.0%)
- Accommodation & food services (7.9%)
- Professional, scientific, technical services (6.5%)
- Social assistance (5.7%)
- Administrative & support & waste management services (5.1%)
- Finance & insurance (4.4%)
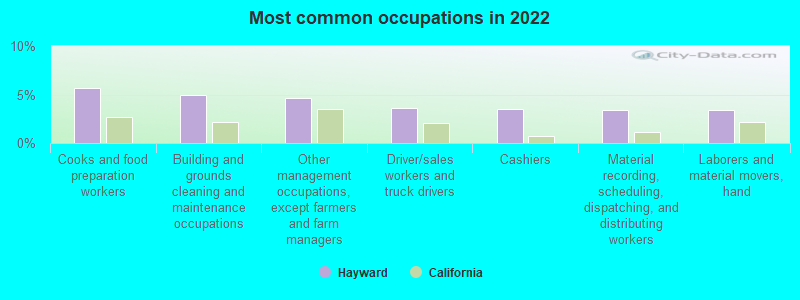
- Cooks and food preparation workers (5.6%)
- Building and grounds cleaning and maintenance occupations (4.9%)
- Other management occupations, except farmers and farm managers (4.6%)
- Driver/sales workers and truck drivers (3.6%)
- Cashiers (3.5%)
- Material recording, scheduling, dispatching, and distributing workers (3.4%)
- Laborers and material movers, hand (3.4%)
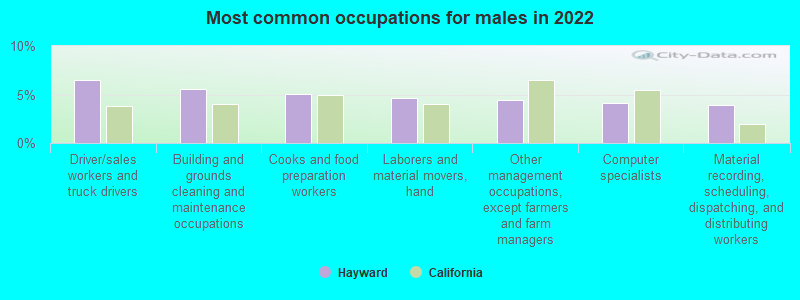
- Driver/sales workers and truck drivers (6.4%)
- Building and grounds cleaning and maintenance occupations (5.5%)
- Cooks and food preparation workers (5.1%)
- Laborers and material movers, hand (4.7%)
- Other management occupations, except farmers and farm managers (4.5%)
- Computer specialists (4.1%)
- Material recording, scheduling, dispatching, and distributing workers (3.9%)
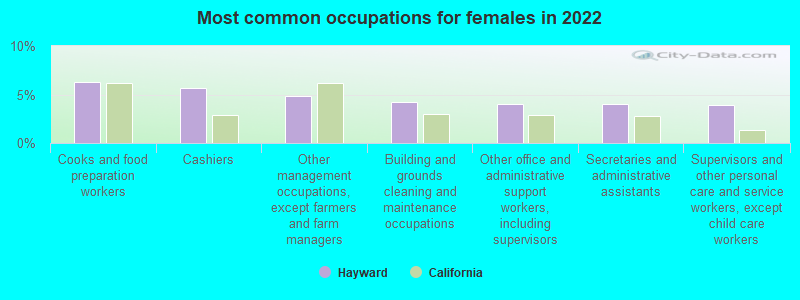
- Cooks and food preparation workers (6.3%)
- Cashiers (5.6%)
- Other management occupations, except farmers and farm managers (4.9%)
- Building and grounds cleaning and maintenance occupations (4.2%)
- Other office and administrative support workers, including supervisors (4.0%)
- Secretaries and administrative assistants (4.0%)
- Supervisors and other personal care and service workers, except child care workers (4.0%)
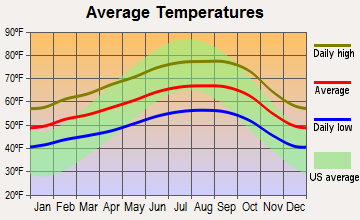
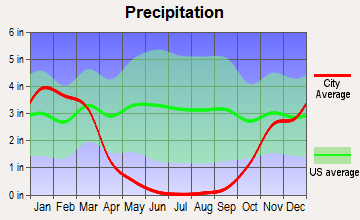
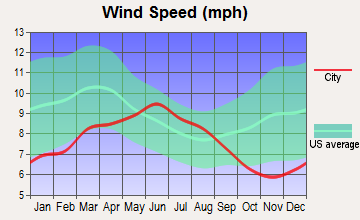
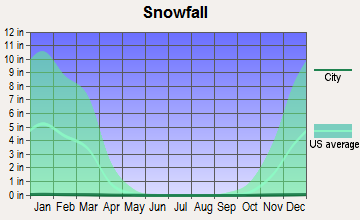
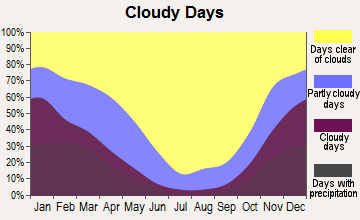
Average climate in Hayward, California
Based on data reported by over 4,000 weather stations

|
|

(lower is better)
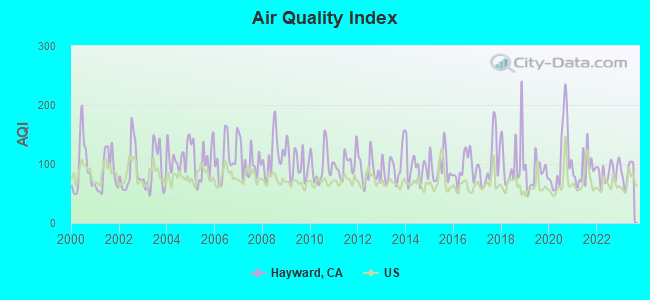
Air Quality Index (AQI) level in 2023 was 85.6. This is about average.
| City: | 85.6 |
| U.S.: | 72.6 |

Carbon Monoxide (CO) [ppm] level in 2023 was 0.321. This is worse than average. Closest monitor was 8.6 miles away from the city center.
| City: | 0.321 |
| U.S.: | 0.251 |
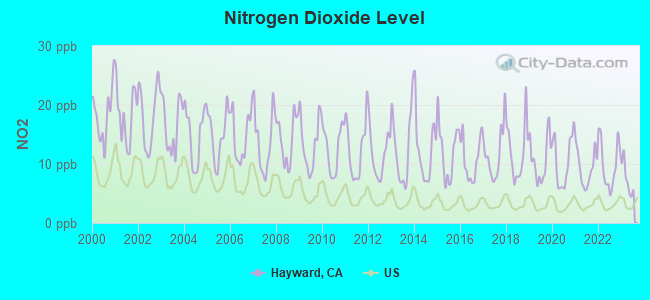
Nitrogen Dioxide (NO2) [ppb] level in 2023 was 7.46. This is significantly worse than average. Closest monitor was 8.6 miles away from the city center.
| City: | 7.46 |
| U.S.: | 5.11 |
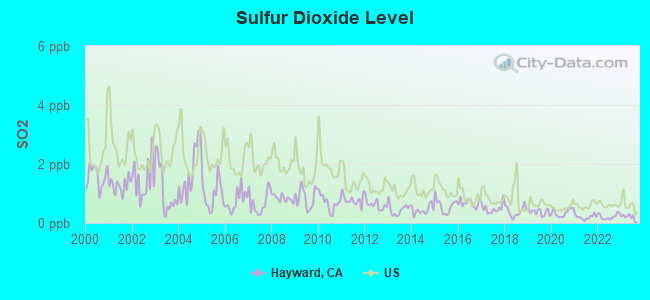
Sulfur Dioxide (SO2) [ppb] level in 2023 was 0.235. This is significantly better than average. Closest monitor was 10.3 miles away from the city center.
| City: | 0.235 |
| U.S.: | 1.515 |
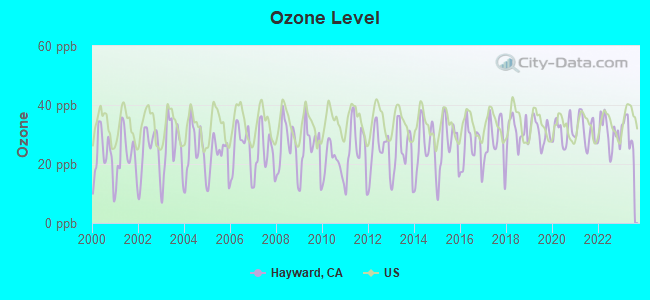
Ozone [ppb] level in 2023 was 31.2. This is about average. Closest monitor was 2.6 miles away from the city center.
| City: | 31.2 |
| U.S.: | 33.3 |
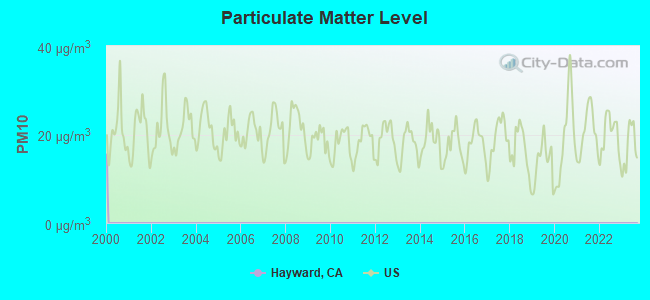
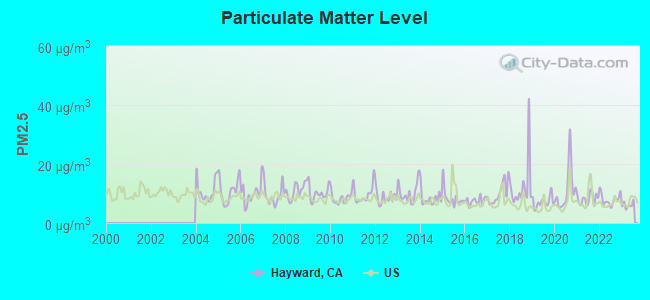
Particulate Matter (PM2.5) [µg/m3] level in 2023 was 6.07. This is better than average. Closest monitor was 8.6 miles away from the city center.
| City: | 6.07 |
| U.S.: | 8.11 |
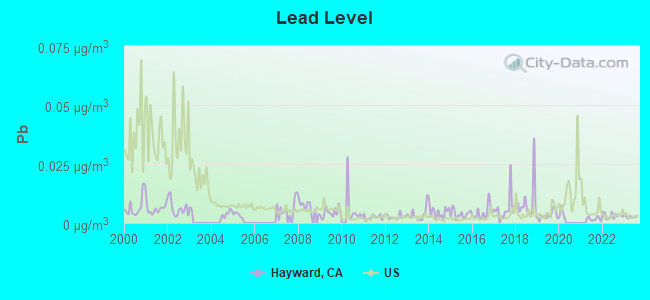
Lead (Pb) [µg/m3] level in 2023 was 0.00263. This is significantly better than average. Closest monitor was 9.8 miles away from the city center.
| City: | 0.00263 |
| U.S.: | 0.00931 |
Earthquake activity:
Hayward-area historical earthquake activity is significantly above California state average. It is 7623% greater than the overall U.S. average.On 4/18/1906 at 13:12:21, a magnitude 7.9 (7.9 UK, Class: Major, Intensity: VIII - XII) earthquake occurred 56.1 miles away from Hayward center, causing $524,000,000 total damage
On 10/18/1989 at 00:04:15, a magnitude 7.1 (6.5 MB, 7.1 MS, 6.9 MW, 7.0 ML) earthquake occurred 40.6 miles away from the city center, causing 62 deaths (62 shaking deaths) and 3757 injuries, causing $1,305,032,704 total damage
On 11/4/1927 at 13:51:53, a magnitude 7.5 (7.5 UK) earthquake occurred 197.5 miles away from the city center
On 7/21/1952 at 11:52:14, a magnitude 7.7 (7.7 UK) earthquake occurred 250.6 miles away from the city center, causing $50,000,000 total damage
On 1/31/1922 at 13:17:28, a magnitude 7.6 (7.6 UK) earthquake occurred 281.8 miles away from the city center
On 4/25/1992 at 18:06:04, a magnitude 7.2 (6.3 MB, 7.1 MS, 7.2 MW, 7.1 MW, Depth: 9.4 mi) earthquake occurred 215.6 miles away from the city center, causing $75,000,000 total damage
Magnitude types: body-wave magnitude (MB), local magnitude (ML), surface-wave magnitude (MS), moment magnitude (MW)
Natural disasters:
The number of natural disasters in Alameda County (20) is greater than the US average (15).Major Disasters (Presidential) Declared: 14
Emergencies Declared: 2
Causes of natural disasters: Floods: 13, Storms: 7, Mudslides: 6, Winter Storms: 6, Landslides: 4, Fires: 2, Drought: 1, Earthquake: 1, Freeze: 1, Hurricane: 1, Tornado: 1, Other: 1 (Note: some incidents may be assigned to more than one category).
Main business address for: Solexa, Inc. (MEDICINAL CHEMICALS & BOTANICAL PRODUCTS), KOSAN BIOSCIENCES INC (SERVICES-COMMERCIAL PHYSICAL & BIOLOGICAL RESEARCH), IMPAX LABORATORIES INC (PHARMACEUTICAL PREPARATIONS), ARADIGM CORP (ELECTROMEDICAL & ELECTROTHERAPEUTIC APPARATUS), CHOLESTECH CORPORATION (ELECTROMEDICAL & ELECTROTHERAPEUTIC APPARATUS).
Hospitals in Hayward:
- ELENA'S ICF/DD-H #3 (1162 MERRITT LANE)
- GENESIS DEVELOPMENTAL SVS-MAIN (21860 MAIN STREET)
- GRAN CARE HOSPICE (19682 HESPERIAN BLVD #200)
- LOYOLA ICF/DD-H (27680 LOYOLA AVENUE)
- MEEKLAND ICF-DDH (20774 MEEKLAND AVENUE)
- NEAL'S HOME (25247 CALAROGA AVENUE)
- PERLITA HOUSE (2627 PERLITA COURT)
- PORTSMOUTH ICF/DDH (27695 PORTSMOUTH AVENUE)
- RUUS ICF-DD-H (27489 PORTSMOUTH AVENUE)
- ST ROSE HOSPITAL (Voluntary non-profit - Church, 27200 CALAROGA AVE)
Airports located in Hayward:
- Hayward Executive Airport (HWD) (Runways: 3, Commercial Ops: 11, Air Taxi Ops: 3,807, Itinerant Ops: 51,862, Local Ops: 46,946, Military Ops: 1,098)
Colleges/Universities in Hayward:
- California State University-East Bay (Full-time enrollment: 12,956; Location: 25800 Carlos Bee Blvd; Public; Website: www.csueastbay.edu; Offers Doctor's degree)
- Chabot College (Full-time enrollment: 7,610; Location: 25555 Hesperian Blvd; Public; Website: www.chabotcollege.edu)
- Heald College-Hayward (Full-time enrollment: 1,513; Location: 25500 Industrial Blvd.; Private, for-profit; Website: www.Heald.edu)
- Everest College-Hayward (Full-time enrollment: 306; Location: 22336 Main Street; Private, for-profit; Website: www.bryman.edu)
- NCP College of Nursing-Hayward (Full-time enrollment: 128; Location: 21615 Hesperian Boulevard; Private, for-profit; Website: ncpcollegeofnursing.edu)
- Life Chiropractic College West (Location: 25001 Industrial Blvd; Private, not-for-profit; Website: www.lifewest.edu; Offers Doctor's degree)
Other colleges/universities with over 2000 students near Hayward:
- Merritt College (about 12 miles; Oakland, CA; Full-time enrollment: 2,842)
- Ohlone College (about 12 miles; Fremont, CA; FT enrollment: 6,153)
- Saint Mary's College of California (about 14 miles; Moraga, CA; FT enrollment: 4,200)
- Laney College (about 15 miles; Oakland, CA; FT enrollment: 5,668)
- College of Alameda (about 15 miles; Alameda, CA; FT enrollment: 3,071)
- Wyotech-Fremont (about 15 miles; Fremont, CA; FT enrollment: 2,383)
- Las Positas College (about 16 miles; Livermore, CA; FT enrollment: 5,112)
Biggest public high schools in Hayward:
- MT. EDEN HIGH (Students: 1,387, Location: 2300 PANAMA ST., Grades: 9-12)
- HAYWARD HIGH (Students: 1,153, Location: 1633 E. AVE., Grades: 9-12)
- TENNYSON HIGH (Students: 1,060, Location: 27035 WHITMAN RD., Grades: 9-12)
- IMPACT ACADEMY OF ARTS & TECHNOLOGY (Students: 223, Location: 2560 DARWIN ST., Grades: 9-12, Charter school)
- EAST BAY ARTS HIGH (Students: 82, Location: 20450 ROYAL AVE., Grades: 9-12)
- BRENKWITZ HIGH (Students: 41, Location: 22100 PRINCETON ST., Grades: 9-12)
- CORE LEARNING ACADEMY AT CONLEY-CARABALLO HIGH (Students: 26, Location: 541 BLANCHE ST., Grades: 9-12)
- ROYAL SUNSET (CONTINUATION) (Students: 23, Location: 20450 ROYAL AVE., Grades: 7-12)
- ALAMEDA COUNTY COMMUNITY (Students: 18, Location: 313 W. WINTON AVE., Grades: KG-12)
- ALTERNATIVE LEARNING ACADEMY AT CONLEY-CARABALLO H (Students: 12, Location: 541 BLANCHE ST., Grades: 9-12)
Biggest public elementary/middle schools in Hayward:
- ANTHONY W. OCHOA MIDDLE (Students: 637, Location: 2121 DEPOT RD., Grades: 7-8)
- CESAR CHAVEZ MIDDLE (Students: 567, Location: 27845 WHITMAN RD., Grades: 7-8)
- BRET HARTE MIDDLE (Students: 564, Location: 1047 E ST., Grades: 7-8)
- CHERRYLAND ELEMENTARY (Students: 530, Location: 585 WILLOW AVE., Grades: KG-6)
- MARTIN LUTHER KING, JR. MIDDLE (Students: 500, Location: 26890 HOLLY HILL AVE., Grades: 7-8)
- RUUS ELEMENTARY (Students: 485, Location: 28027 DICKENS AVE., Grades: KG-6)
- TYRRELL ELEMENTARY (Students: 484, Location: 27000 TYRRELL AVE., Grades: KG-6)
- HARDER ELEMENTARY (Students: 478, Location: 495 WYETH RD., Grades: KG-6)
- LONGWOOD ELEMENTARY (Students: 445, Location: 850 LONGWOOD AVE., Grades: KG-6)
- PALMA CEIA ELEMENTARY (Students: 443, Location: 27679 MELBOURNE AVE., Grades: KG-6)
Private elementary/middle schools in Hayward:
- ST JOACHIM SCHOOL (Students: 351, Location: 21250 HESPERIAN BLVD, Grades: PK-8)
- ST CLEMENT SCHOOL (Students: 262, Location: 790 CALHOUN ST, Grades: KG-8)
- ST BEDE SCHOOL (Students: 225, Location: 26910 PATRICK AVE, Grades: KG-8)
- ALL SAINTS CATHOLIC SCHOOL (Students: 218, Location: 22870 2ND ST, Grades: KG-8)
- WOODROE WOODS SCHOOL (Students: 123, Location: 22502 WOODROE AVE, Grades: PK-2)
- LEA'S CHRISTIAN SCHOOL (Students: 101, Location: 26236 ADRIAN AVE, Grades: PK-4)
- ELMHURST LEARNING CENTER (Students: 53, Location: 380 ELMHURST ST, Grades: PK-3)
- BAYSIDE SDA CHRISTIAN SCHOOL (Students: 38, Location: 26400 GADING RD, Grades: KG-8)
User-submitted facts and corrections:
- Please add KCRH radio at 89.9fm. This is the Chabot College radio station. Thanks.
Points of interest:
Notable locations in Hayward: Hayward Golf Course (A), Haywood Motorcycle Club (B), Southern Alameda Yard (C), Mount Eden Station (D), Haywards Station (E), Skywest Golf Course (F), Veterans Memorial Building (G), Hayward City Hall (H), Hayward Public Library (I), George Weeks Branch Hayward Public Library (J), Centennial Hall (K), Alameda County Building (L), Westmed Ambulance (M), Hayward Fire Department Station 7 (N), Hayward Fire Department Station 6 (O), Hayward Fire Department Station 5 (P), Hayward Fire Department Station 4 (Q), Hayward Fire Department Station 3 (R), Hayward Fire Department Station 2 (S), Hayward Fire Department Station 1 (T). Display/hide their locations on the map
Shopping Centers: Fairway Park Shopping Center (1), Oliver Corners Shopping Center (2), Gateway Plaza Shopping Center (3), Jackson-Amador Shopping Center (4), Southland Mall Shopping Center (5), Winton Shopping Center (6). Display/hide their locations on the map
Main business address in Hayward include: Solexa, Inc. (A), KOSAN BIOSCIENCES INC (B), IMPAX LABORATORIES INC (C), ARADIGM CORP (D), CHOLESTECH CORPORATION (E). Display/hide their locations on the map
Churches in Hayward include: Pentecostal Church (A), Four Square Church (B), First Christian Church (C), The Church of Jesus Christ of Latter Day Saints (D), Church of Christ (E), Bethel Assembly of God Church (F), All Saints Roman Catholic Church (G), Westminster Hills Church (H), Victory Outreach Church (I). Display/hide their locations on the map
Cemeteries: Holy Sepulchre Cemetery (1), Mount Eden Cemetery (2), All Saints Cemetery (3). Display/hide their locations on the map
Creeks: Mount Eden Creek (A), North Creek (B), Coyote Creek (C), Zeile Creek (D), Ward Creek (E), Sulphur Creek (F), Patterson Creek (G). Display/hide their locations on the map
Parks in Hayward include: John F Kennedy Park (1), Tennyson Park (2), Valle Vista Park (3), Weekes Community Park (4), Ruus Park (5), Sorensdale Park (6), Canyon View Park (7), Centennial Center Botany Grounds (8), Centennial Park (9). Display/hide their locations on the map
Tourist attraction: Chalk It Up (22540 Foothill Boulevard) (1). Display/hide its approximate location on the map
Hotel: Best Western Inn of Hayward (360 West A Street) (1). Display/hide its approximate location on the map
Courts: Alameda County Offices - Court Appointed Special Advocates- Hayward- Juve (24405 Amador Street) (1), Alameda County Offices - Superior Court Of California County Of Alameda- Hayward Hall Of Jus (24405 Amador Street) (2), Alameda County Offices - Superior Court Of California County Of Ala (24405 Amador Street) (3), Alameda County Offices - Court Appointed Special Advocates- Other Offices- Public Defe (24085 Amador Street) (4), Alameda County Offices - Court Appointed Special Advocates- Hayward- Marriage Lice (24405 Amador Street) (5). Display/hide their approximate locations on the map
Birthplace of: Dwayne Johnson - Professional wrestler, Kristi Yamaguchi - Figure skater, Brian Patterson - Bicycle motocross rider, John Beck (American football) - Football player, Shawn Stasiak - Professional wrestler, Amobi Okugo - Soccer player, Claudia Kolb - Olympic medalist in swimming in the 1960's, Davone Bess - Football player, Forrest Fezler - Professional golfer, France Silva - Marine Corps Medal of Honor recipient.
Drinking water stations with addresses in Hayward and their reported violations in the past:
MORNING STAR OUTREACH (Population served: 100, Groundwater):Past monitoring violations:
- One routine major monitoring violation
- One minor monitoring violation
- One regular monitoring violation
Drinking water stations with addresses in Hayward that have no violations reported:
- WILDERNESS UNLIMITED (Population served: 25, Primary Water Source Type: Groundwater)
| This city: | 3.1 people |
| California: | 2.9 people |
| This city: | 71.8% |
| Whole state: | 68.7% |
| This city: | 7.6% |
| Whole state: | 7.2% |
Likely homosexual households (counted as self-reported same-sex unmarried-partner households)
- Lesbian couples: 0.5% of all households
- Gay men: 0.4% of all households
People in group quarters in Hayward in 2010:
- 1,076 people in college/university student housing
- 723 people in nursing facilities/skilled-nursing facilities
- 341 people in group homes intended for adults
- 222 people in other noninstitutional facilities
- 147 people in workers' group living quarters and job corps centers
- 119 people in residential treatment centers for adults
- 49 people in emergency and transitional shelters (with sleeping facilities) for people experiencing homelessness
- 30 people in in-patient hospice facilities
- 11 people in residential treatment centers for juveniles (non-correctional)
- 6 people in group homes for juveniles (non-correctional)
People in group quarters in Hayward in 2000:
- 751 people in nursing homes
- 636 people in college dormitories (includes college quarters off campus)
- 525 people in other noninstitutional group quarters
- 63 people in homes for the mentally retarded
- 49 people in homes for the mentally ill
- 38 people in homes or halfway houses for drug/alcohol abuse
- 29 people in religious group quarters
- 26 people in other nonhousehold living situations
- 13 people in other group homes
- 4 people in halfway houses
- 4 people in homes for the physically handicapped
Banks with most branches in Hayward (2011 data):
- U.S. Bank National Association: Hesperian Branch, Fairway Park Branch, California State University - East B, B Street Branch, Hayward Branch. Info updated 2012/01/30: Bank assets: $330,470.8 mil, Deposits: $236,091.5 mil, headquarters in Cincinnati, OH, positive income, 3121 total offices, Holding Company: U.S. Bancorp
- JPMorgan Chase Bank, National Association: Mission Blvd And A St Lucky Branch, 22370 Foothill Blvd Branch, 24333 Southland Dr Branch, Jackson And Amador Branch. Info updated 2011/11/10: Bank assets: $1,811,678.0 mil, Deposits: $1,190,738.0 mil, headquarters in Columbus, OH, positive income, International Specialization, 5577 total offices, Holding Company: Jpmorgan Chase & Co.
- Bank of America, National Association: Mission-Sorenson Branch, Hayward Main Branch, Hesperian-La Playa Branch. Info updated 2009/11/18: Bank assets: $1,451,969.3 mil, Deposits: $1,077,176.8 mil, headquarters in Charlotte, NC, positive income, 5782 total offices, Holding Company: Bank Of America Corporation
- Wells Fargo Bank, National Association: Southland Branch at 950 Southland Drive, branch established on 1961/03/20; Hayward Branch at 1172 A Street, branch established on 1957/01/28. Info updated 2011/04/05: Bank assets: $1,161,490.0 mil, Deposits: $905,653.0 mil, headquarters in Sioux Falls, SD, positive income, 6395 total offices, Holding Company: Wells Fargo & Company
- Fremont Bank: Www.Fremontbank.com Branch at 25151 Clawiter Rd, branch established on 2002/07/01; Hayward Branch at 1679 Industrial Parkway West, branch established on 2004/03/01. Info updated 2006/11/03: Bank assets: $2,367.9 mil, Deposits: $1,975.1 mil, headquarters in Fremont, CA, positive income, Commercial Lending Specialization, 19 total offices, Holding Company: Fremont Bancorporation
- Bank of the West: Hayward Branch at 1058 B Street, branch established on 1964/06/26; Hayward Southland Branch at 24299 Southland Drive, branch established on 1968/04/22. Info updated 2009/11/16: Bank assets: $62,408.3 mil, Deposits: $43,995.2 mil, headquarters in San Francisco, CA, positive income, 647 total offices, Holding Company: Bnp Paribas
- Citibank, National Association: 22548 Second Street Branch at 22548 Second Street, branch established on 1936/02/01. Info updated 2012/01/10: Bank assets: $1,288,658.0 mil, Deposits: $882,541.0 mil, headquarters in Sioux Falls, SD, positive income, International Specialization, 1048 total offices, Holding Company: Citigroup Inc.
- Comerica Bank: Hayward Banking Center Branch at 858 B Street, branch established on 2009/04/29. Info updated 2011/07/29: Bank assets: $60,970.5 mil, Deposits: $48,300.9 mil, headquarters in Dallas, TX, positive income, Commercial Lending Specialization, 497 total offices, Holding Company: Comerica Incorporated
- California Bank & Trust: Hayward Branch at 785 Southland Drive, branch established on 1973/07/03. Info updated 2009/07/20: Bank assets: $10,894.1 mil, Deposits: $9,193.9 mil, headquarters in San Diego, CA, positive income, Commercial Lending Specialization, 109 total offices, Holding Company: Zions Bancorporation
For population 15 years and over in Hayward:
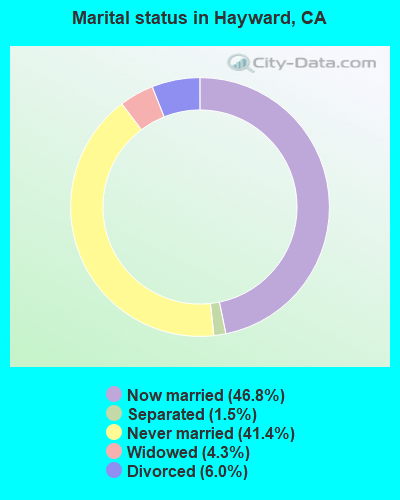
- Never married: 41.4%
- Now married: 46.8%
- Separated: 1.5%
- Widowed: 4.3%
- Divorced: 6.0%
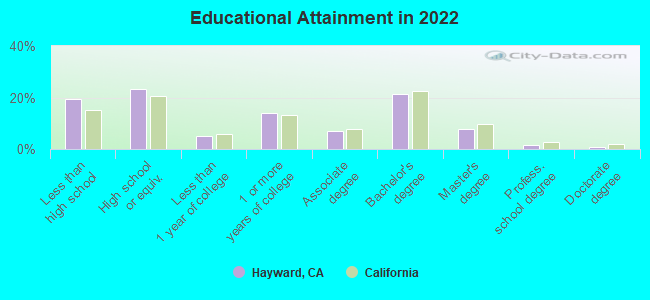
For population 25 years and over in Hayward:
- High school or higher: 80.6%
- Bachelor's degree or higher: 31.4%
- Graduate or professional degree: 10.0%
- Unemployed: 6.3%
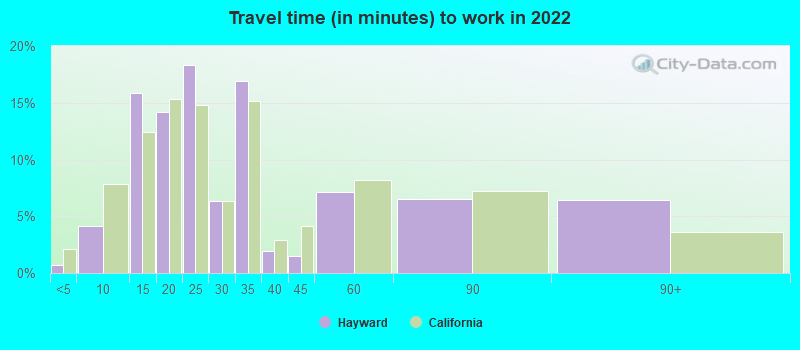
- Mean travel time to work (commute): 26.0 minutes
| Here: | 18.3 |
| California average: | 15.5 |
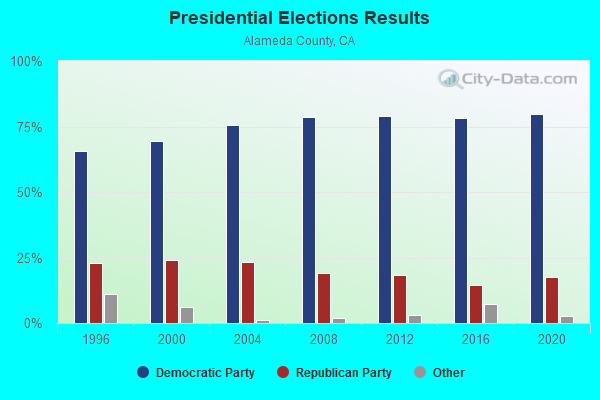
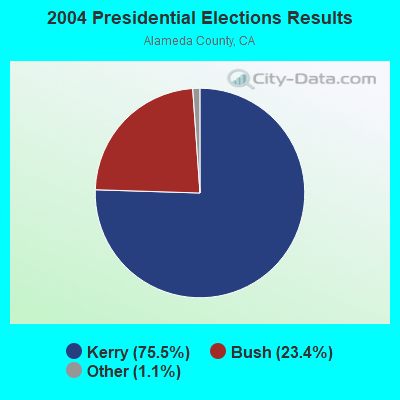
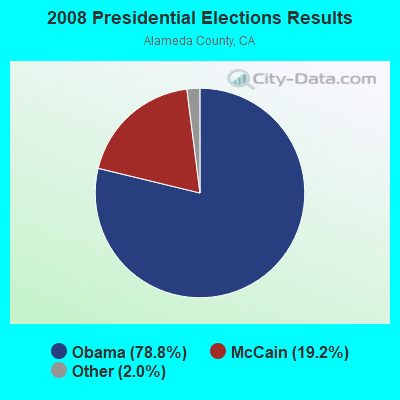

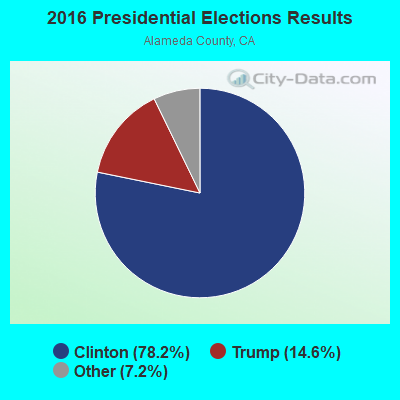
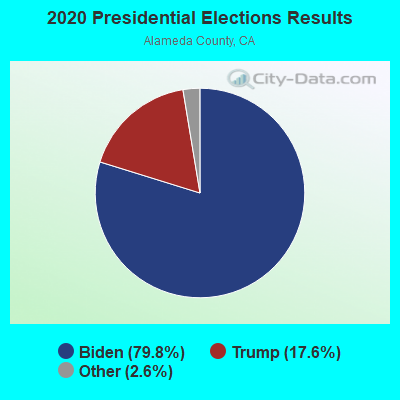
Graphs represent county-level data. Detailed 2008 Election Results
Neighborhoods in Hayward:
(Hayward, California Neighborhood Map)Religion statistics for Hayward, CA (based on Alameda County data)
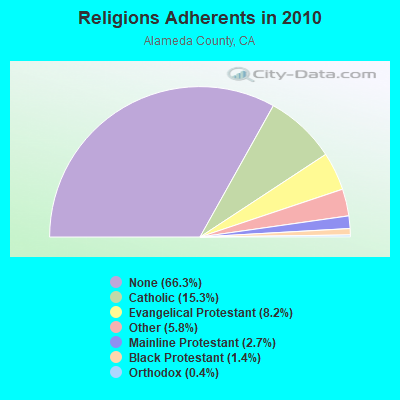
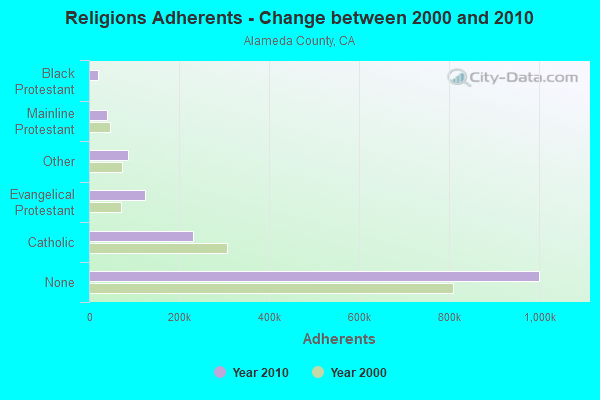
| Religion | Adherents | Congregations |
|---|---|---|
| Catholic | 231,500 | 53 |
| Evangelical Protestant | 123,422 | 538 |
| Other | 87,110 | 227 |
| Mainline Protestant | 40,185 | 181 |
| Black Protestant | 20,716 | 76 |
| Orthodox | 6,640 | 16 |
| None | 1,000,698 | - |
Food Environment Statistics:
| Alameda County: | 2.50 / 10,000 pop. |
| California: | 2.14 / 10,000 pop. |
| Here: | 0.03 / 10,000 pop. |
| California: | 0.04 / 10,000 pop. |
| Alameda County: | 0.67 / 10,000 pop. |
| State: | 0.62 / 10,000 pop. |
| Here: | 1.60 / 10,000 pop. |
| State: | 1.49 / 10,000 pop. |
| Here: | 8.94 / 10,000 pop. |
| State: | 7.42 / 10,000 pop. |
| Alameda County: | 6.9% |
| California: | 7.3% |
| This county: | 19.3% |
| California: | 21.3% |
| This county: | 16.6% |
| State: | 17.9% |
Health and Nutrition:
| Hayward: | 49.6% |
| California: | 49.4% |
| This city: | 47.8% |
| State: | 48.0% |
| Hayward: | 28.0 |
| California: | 28.1 |
| Hayward: | 19.4% |
| California: | 20.2% |
| Hayward: | 13.4% |
| California: | 11.2% |
| Hayward: | 6.8 |
| California: | 6.8 |
| Here: | 30.0% |
| State: | 31.5% |
| This city: | 56.2% |
| California: | 56.4% |
| Hayward: | 81.7% |
| California: | 80.9% |
More about Health and Nutrition of Hayward, CA Residents
| Local government employment and payroll (March 2022) | |||||
| Function | Full-time employees | Monthly full-time payroll | Average yearly full-time wage | Part-time employees | Monthly part-time payroll |
|---|---|---|---|---|---|
| Police Protection - Officers | 195 | $2,790,688 | $171,735 | 1 | $885 |
| Firefighters | 123 | $2,254,616 | $219,963 | 0 | $0 |
| Other and Unallocable | 101 | $960,314 | $114,097 | 0 | $0 |
| Police - Other | 82 | $771,787 | $112,944 | 10 | $30,101 |
| Sewerage | 53 | $532,813 | $120,637 | 0 | $0 |
| Water Supply | 51 | $479,808 | $112,896 | 0 | $0 |
| Other Government Administration | 48 | $474,038 | $118,510 | 5 | $20,287 |
| Financial Administration | 43 | $446,715 | $124,665 | 2 | $2,411 |
| Local Libraries | 24 | $204,172 | $102,086 | 27 | $76,972 |
| Housing and Community Development (Local) | 19 | $196,330 | $123,998 | 0 | $0 |
| Streets and Highways | 14 | $142,504 | $122,146 | 1 | $5,882 |
| Airports | 11 | $99,520 | $108,567 | 0 | $0 |
| Judicial and Legal | 9 | $126,812 | $169,083 | 0 | $0 |
| Fire - Other | 8 | $103,977 | $155,966 | 1 | $5,474 |
| Solid Waste Management | 5 | $42,132 | $101,117 | 0 | $0 |
| Totals for Government | 786 | $9,626,225 | $146,965 | 47 | $142,012 |
Hayward government finances - Expenditure in 2021 (per resident):
- Construction - Regular Highways: $40,669,000 ($259.44)
Local Fire Protection: $17,848,000 ($113.86)
Water Utilities: $4,075,000 ($26.00)
General - Other: $2,373,000 ($15.14)
Libraries: $2,080,000 ($13.27)
Sewerage: $1,727,000 ($11.02)
Police Protection: $727,000 ($4.64)
Air Transportation: $464,000 ($2.96)
Parks and Recreation: $43,000 ($0.27)
- Current Operations - Police Protection: $77,364,000 ($493.54)
Local Fire Protection: $49,853,000 ($318.03)
Water Utilities: $46,228,000 ($294.91)
Central Staff Services: $19,209,000 ($122.54)
Sewerage: $18,808,000 ($119.98)
Regular Highways: $12,771,000 ($81.47)
Libraries: $7,830,000 ($49.95)
Housing and Community Development: $5,826,000 ($37.17)
Financial Administration: $4,845,000 ($30.91)
Protective Inspection and Regulation - Other: $4,306,000 ($27.47)
General - Other: $2,873,000 ($18.33)
Air Transportation: $2,452,000 ($15.64)
Health - Other: $1,992,000 ($12.71)
Transit Utilities: $1,334,000 ($8.51)
Solid Waste Management: $1,228,000 ($7.83)
Parks and Recreation: $1,092,000 ($6.97)
- General - Interest on Debt: $6,080,000 ($38.79)
- Other Capital Outlay - General - Other: $2,547,000 ($16.25)
Police Protection: $1,021,000 ($6.51)
General Public Building: $1,021,000 ($6.51)
Local Fire Protection: $739,000 ($4.71)
Water Utilities: $684,000 ($4.36)
Regular Highways: $271,000 ($1.73)
Libraries: $7,000 ($0.04)
- Water Utilities - Interest on Debt: $74,000 ($0.47)
Hayward government finances - Revenue in 2021 (per resident):
- Charges - Sewerage: $33,778,000 ($215.48)
Other: $10,931,000 ($69.73)
Air Transportation: $3,611,000 ($23.04)
Housing and Community Development: $244,000 ($1.56)
Solid Waste Management: $58,000 ($0.37)
- Federal Intergovernmental - Housing and Community Development: $4,188,000 ($26.72)
Other: $3,402,000 ($21.70)
- Local Intergovernmental - Other: $10,618,000 ($67.74)
- Miscellaneous - General Revenue - Other: $42,831,000 ($273.24)
Interest Earnings: $8,564,000 ($54.63)
Sale of Property: $3,390,000 ($21.63)
Fines and Forfeits: $2,275,000 ($14.51)
Donations From Private Sources: $147,000 ($0.94)
Rents: $106,000 ($0.68)
- Revenue - Water Utilities: $61,842,000 ($394.52)
Transit Utilities: $6,000 ($0.04)
- State Intergovernmental - Other: $10,755,000 ($68.61)
Highways: $6,490,000 ($41.40)
General Local Government Support: $221,000 ($1.41)
- Tax - Property: $62,006,000 ($395.56)
General Sales and Gross Receipts: $61,859,000 ($394.62)
Public Utilities Sales: $28,443,000 ($181.45)
Documentary and Stock Transfer: $17,120,000 ($109.22)
Other License: $7,494,000 ($47.81)
Other: $7,484,000 ($47.74)
Occupation and Business License - Other: $2,677,000 ($17.08)
Other Selective Sales: $2,161,000 ($13.79)
Hayward government finances - Debt in 2021 (per resident):
- Long Term Debt - Beginning Outstanding - Unspecified Public Purpose: $151,246,000 ($964.86)
Outstanding Unspecified Public Purpose: $133,676,000 ($852.78)
Retired Unspecified Public Purpose: $22,271,000 ($142.08)
Issue, Unspecified Public Purpose: $4,701,000 ($29.99)
Hayward government finances - Cash and Securities in 2021 (per resident):
- Bond Funds - Cash and Securities: $45,513,000 ($290.35)
- Other Funds - Cash and Securities: $169,148,000 ($1079.07)
- Sinking Funds - Cash and Securities: $10,691,000 ($68.20)
6.77% of this county's 2021 resident taxpayers lived in other counties in 2020 ($121,106 average adjusted gross income)
| Here: | 6.77% |
| California average: | 5.19% |
0.01% of residents moved from foreign countries ($76 average AGI)
Alameda County: 0.01% California average: 0.03%
Top counties from which taxpayers relocated into this county between 2020 and 2021:
| from Santa Clara County, CA | |
| from San Francisco County, CA | |
| from Contra Costa County, CA |
8.96% of this county's 2020 resident taxpayers moved to other counties in 2021 ($131,786 average adjusted gross income)
| Here: | 8.96% |
| California average: | 6.14% |
0.01% of residents moved to foreign countries ($103 average AGI)
Alameda County: 0.01% California average: 0.02%
Top counties to which taxpayers relocated from this county between 2020 and 2021:
| to Contra Costa County, CA | |
| to Santa Clara County, CA | |
| to San Francisco County, CA |
| Businesses in Hayward, CA | ||||
| Name | Count | Name | Count | |
|---|---|---|---|---|
| 24 Hour Fitness | 1 | Kohl's | 1 | |
| 7-Eleven | 6 | Kroger | 1 | |
| 99 Cents Only Stores | 1 | La Quinta | 1 | |
| Ace Hardware | 1 | Lane Furniture | 1 | |
| Applebee's | 1 | LensCrafters | 1 | |
| AutoZone | 1 | Little Caesars Pizza | 1 | |
| Bakers | 1 | Macy's | 1 | |
| Bally Total Fitness | 1 | MainStay | 1 | |
| Baskin-Robbins | 2 | Marriott | 1 | |
| Bath & Body Works | 1 | MasterBrand Cabinets | 2 | |
| Best Western | 1 | McDonald's | 6 | |
| Big O Tires | 1 | Motel 6 | 1 | |
| Blockbuster | 1 | Motherhood Maternity | 2 | |
| Budget Car Rental | 1 | New Balance | 2 | |
| Burger King | 4 | New York & Co | 1 | |
| Burlington Coat Factory | 1 | Nike | 7 | |
| CVS | 2 | Nissan | 1 | |
| Carl\s Jr. | 2 | Office Depot | 1 | |
| Catherines | 1 | Olive Garden | 1 | |
| Chuck E. Cheese's | 1 | Panda Express | 4 | |
| Church's Chicken | 1 | Panera Bread | 1 | |
| Cinnabon | 1 | Payless | 3 | |
| Cold Stone Creamery | 2 | Penske | 1 | |
| Comfort Inn | 1 | Pizza Hut | 2 | |
| Costco | 2 | Popeyes | 1 | |
| DHL | 1 | Quiznos | 5 | |
| Dairy Queen | 1 | RadioShack | 2 | |
| Days Inn | 2 | Rite Aid | 2 | |
| Dennys | 1 | Ryder Rental & Truck Leasing | 1 | |
| Domino's Pizza | 3 | SAS Shoes | 1 | |
| El Pollo Loco | 1 | SONIC Drive-In | 1 | |
| Famous Footwear | 1 | Safeway | 2 | |
| FedEx | 19 | Sears | 4 | |
| Finish Line | 1 | Sprint Nextel | 2 | |
| Firestone Complete Auto Care | 2 | Starbucks | 9 | |
| Foot Locker | 1 | Subway | 14 | |
| Forever 21 | 1 | Super 8 | 1 | |
| GNC | 1 | T-Mobile | 7 | |
| GameStop | 3 | Taco Bell | 4 | |
| Goodwill | 3 | Target | 2 | |
| H&R Block | 5 | The Room Place | 2 | |
| Haworth | 1 | Toyota | 1 | |
| Hilton | 1 | Toys"R"Us | 1 | |
| Home Depot | 1 | True Value | 1 | |
| HomeTown Buffet | 1 | U-Haul | 7 | |
| Honda | 1 | UPS | 13 | |
| IHOP | 1 | Vans | 4 | |
| JCPenney | 1 | Victoria's Secret | 1 | |
| Jack In The Box | 6 | Volkswagen | 1 | |
| Jamba Juice | 2 | Vons | 2 | |
| Jones New York | 1 | Walgreens | 5 | |
| KFC | 2 | Wendy's | 1 | |
| Kmart | 1 | YMCA | 1 | |
Strongest AM radio stations in Hayward:
- KFAX (1100 AM; 50 kW; SAN FRANCISCO, CA; Owner: GOLDEN GATE BROADCASTING CO, INC.)
- KTCT (1050 AM; 50 kW; SAN MATEO, CA; Owner: SUSQUEHANNA RADIO CORP.)
- KGO (810 AM; 50 kW; SAN FRANCISCO, CA; Owner: KGO-AM RADIO, INC.)
- KNBR (680 AM; 50 kW; SAN FRANCISCO, CA; Owner: KNBR LICO, INC.)
- KYCY (1550 AM; 50 kW; SAN FRANCISCO, CA; Owner: INFINITY BROADCASTING OPERATIONS, INC.)
- KTRB (860 AM; 50 kW; MODESTO, CA; Owner: PAPPAS RADIO OF CALIFORNIA, A CALIFORNIA LIMITED PARTNERSHIP)
- KIQI (1010 AM; 35 kW; SAN FRANCISCO, CA; Owner: RADIO UNICA OF SAN FRANCISCO LICENSE CORP.)
- KLOK (1170 AM; 50 kW; SAN JOSE, CA; Owner: ENTRAVISION HOLDINGS, LLC)
- KNEW (910 AM; 20 kW; OAKLAND, CA; Owner: AMFM RADIO LICENSES, L.L.C.)
- KCBS (740 AM; 50 kW; SAN FRANCISCO, CA; Owner: INFINITY BROADCASTING OPERATIONS, INC.)
- KSFB (1220 AM; 5 kW; PALO ALTO, CA; Owner: SCA-PALO ALTO, LLC)
- KSFO (560 AM; 5 kW; SAN FRANCISCO, CA; Owner: KGO-AM RADIO, INC.)
- KFRC (610 AM; 5 kW; SAN FRANCISCO, CA; Owner: INFINITY BROADCASTING CORPORATION OF LOS ANGELES)
Strongest FM radio stations in Hayward:
- KZBR-FM2 (95.7 FM; LIVERMORE, ETC., CA; Owner: BONNEVILLE HOLDING COMPANY)
- KKSF-FM1 (103.7 FM; PLEASANTON, ETC., CA; Owner: AMFM RADIO LICENSES, L.L.C.)
- KFRC-FM3 (99.7 FM; WALNUT CREEK, CA; Owner: INFINITY KFRC-FM, INC.)
- KZBR-FM1 (95.7 FM; WALNUT CREEK, CA; Owner: BONNEVILLE HOLDING COMPANY)
- KBLX-FM2 (102.9 FM; PLEASANTON, CA; Owner: ICBC BROADCAST HOLDINGS -CA, INC.)
- KSOL-FM3 (98.9 FM; PLEASANTON, CA; Owner: TMS LICENSE CALIFORNIA, INC)
- KISQ-FM3 (98.1 FM; CONCORD, CA; Owner: AMFM RADIO LICENSES, L.L.C.)
- KMEL-FM1 (106.1 FM; CONCORD, CA; Owner: AMFM RADIO LICENSES, L.L.C.)
- KFJC (89.7 FM; LOS ALTOS, CA; Owner: FOOTHILL-DE ANZA COMM. COLLEGE DIST.)
- KLLC (97.3 FM; SAN FRANCISCO, CA; Owner: INFINITY BROADCASTING OPERATIONS, INC.)
- KOIT-FM (96.5 FM; SAN FRANCISCO, CA; Owner: BONNEVILLE HOLDING COMPANY)
- KKSF (103.7 FM; SAN FRANCISCO, CA; Owner: AMFM RADIO LICENSES, L.L.C.)
- KFOG (104.5 FM; SAN FRANCISCO, CA; Owner: KFFG LICO, INC)
- KYLD (94.9 FM; SAN FRANCISCO, CA; Owner: AMFM RADIO LICENSES, L.L.C.)
- KFRC-FM (99.7 FM; SAN FRANCISCO, CA; Owner: INFINITY KFRC-FM, INC.)
- KBLX-FM (102.9 FM; BERKELEY, CA; Owner: ICBC BROADCAST HOLDINGS - CA, INC.)
- KZBR (95.7 FM; SAN FRANCISCO, CA; Owner: BONNEVILLE HOLDING COMPANY)
- KMEL (106.1 FM; SAN FRANCISCO, CA; Owner: AMFM RADIO LICENSES, L.L.C.)
- KFJO (92.1 FM; WALNUT CREEK, CA; Owner: CHASE RADIO PROPERTIES, L.L.C.)
- KSAN (107.7 FM; SAN MATEO, CA; Owner: SUSQUEHANNA RADIO CORP.)
TV broadcast stations around Hayward:
- KQED (Channel 9; SAN FRANCISCO, CA; Owner: KQED, INC.)
- KGO-TV (Channel 7; SAN FRANCISCO, CA; Owner: KGO TELEVISION, INC.)
- KPIX-TV (Channel 5; SAN FRANCISCO, CA; Owner: CBS BROADCASTING INC.)
- KTVU (Channel 2; OAKLAND, CA; Owner: KTVU PARTNERSHIP)
- KBIT-CA (Channel 28; SAN FRANCISCO, ETC., CA; Owner: POLAR BROADCASTING, INC.)
- KRON-TV (Channel 4; SAN FRANCISCO, CA; Owner: YOUNG BROADCASTING OF SAN FRANCISCO, INC.)
- KICU-TV (Channel 36; SAN JOSE, CA; Owner: KTVU PARTNERSHIP)
- KMTP-TV (Channel 32; SAN FRANCISCO, CA; Owner: MINORITY TELEVISION PROJECT)
- KBHK-TV (Channel 44; SAN FRANCISCO, CA; Owner: VIACOM TELEVISION STATIONS GROUP OF SAN FRANCISCO INC.)
- KBWB (Channel 20; SAN FRANCISCO, CA; Owner: KBWB LICENSE, INC.)
- KFSF (Channel 66; VALLEJO, CA; Owner: TELEFUTURA SAN FRANCISCO LLC)
- KCSM-TV (Channel 60; SAN MATEO, CA; Owner: SAN MATEO COUNTY COMMUNITY COLLEGE DISTRICT)
- KTEH (Channel 54; SAN JOSE, CA; Owner: KTEH FOUNDATION)
- KCNS (Channel 38; SAN FRANCISCO, CA; Owner: WRAY, INC.)
- KDTV (Channel 14; SAN FRANCISCO, CA; Owner: KDTV LICENSE PARTNERSHIP, G.P.)
- KSTS (Channel 48; SAN JOSE, CA; Owner: TELEMUNDO OF NORTHERN CALIFORNIA LICENSE CORP.)
- KOVR (Channel 13; STOCKTON, CA; Owner: SCI - SACRAMENTO LICENSEE, LLC)
- KXTV (Channel 10; SACRAMENTO, CA; Owner: KXTV, INC.)
- KCRA-TV (Channel 3; SACRAMENTO, CA; Owner: KCRA HEARST-ARGYLE TELEVISION, INC.)
- KSPX (Channel 29; SACRAMENTO, CA; Owner: PAXSON SACRAMENTO LICENSE, INC.)
- KUVS (Channel 19; MODESTO, CA; Owner: KUVS LICENSE PARTNERSHIP, G.P.)
- KTXL (Channel 40; SACRAMENTO, CA; Owner: CHANNEL 40, INC.)
- KQCA (Channel 58; STOCKTON, CA; Owner: KCRA HEARST-ARGYLE TELEVISION, INC.)
- KVIE (Channel 6; SACRAMENTO, CA; Owner: KVIE, INC.)
- KMAX-TV (Channel 31; SACRAMENTO, CA; Owner: UPN STATIONS GROUP INC.)
- National Bridge Inventory (NBI) Statistics
- 81Number of bridges
- 741ft / 226mTotal length
- 5,004,175Total average daily traffic
- 376,236Total average daily truck traffic
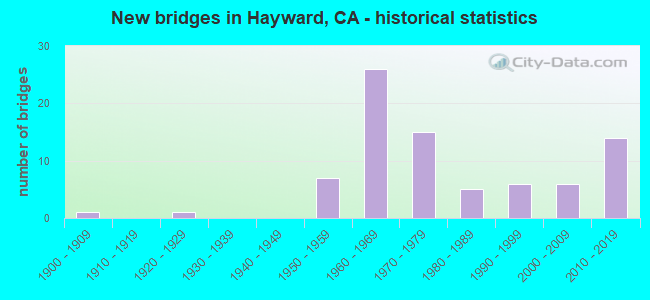
- New bridges - historical statistics
- 11900-1909
- 11920-1929
- 71950-1959
- 261960-1969
- 151970-1979
- 51980-1989
- 61990-1999
- 62000-2009
- 142010-2019
FCC Registered Private Land Mobile Towers: 2 (See the full list of FCC Registered Private Land Mobile Towers in Hayward, CA)
FCC Registered Broadcast Land Mobile Towers: 99 (See the full list of FCC Registered Broadcast Land Mobile Towers)
FCC Registered Microwave Towers: 106 (See the full list of FCC Registered Microwave Towers in this town)
FCC Registered Paging Towers: 7 (See the full list of FCC Registered Paging Towers)
FCC Registered Maritime Coast & Aviation Ground Towers: 8 (See the full list of FCC Registered Maritime Coast & Aviation Ground Towers)
FCC Registered Amateur Radio Licenses: 677 (See the full list of FCC Registered Amateur Radio Licenses in Hayward)
FAA Registered Aircraft Manufacturers and Dealers: 7 (See the full list of FAA Registered Manufacturers and Dealers in Hayward)
FAA Registered Aircraft: 115 (See the full list of FAA Registered Aircraft)
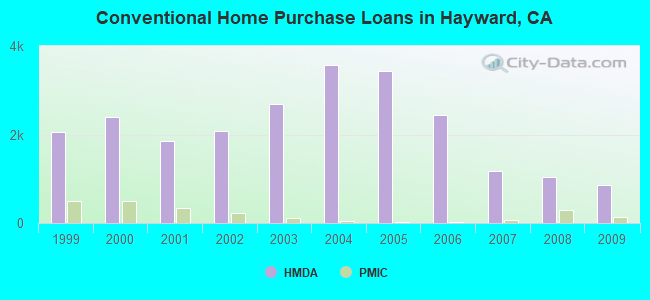
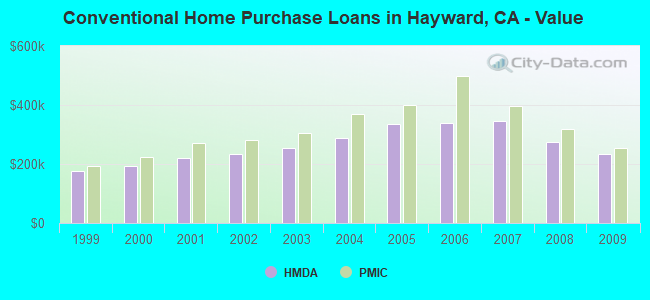
| Home Mortgage Disclosure Act Aggregated Statistics For Year 2009 (Based on 22 full and 11 partial tracts) | ||||||||||||||
| A) FHA, FSA/RHS & VA Home Purchase Loans | B) Conventional Home Purchase Loans | C) Refinancings | D) Home Improvement Loans | E) Loans on Dwellings For 5+ Families | F) Non-occupant Loans on < 5 Family Dwellings (A B C & D) | G) Loans On Manufactured Home Dwelling (A B C & D) | ||||||||
|---|---|---|---|---|---|---|---|---|---|---|---|---|---|---|
| Number | Average Value | Number | Average Value | Number | Average Value | Number | Average Value | Number | Average Value | Number | Average Value | Number | Average Value | |
| LOANS ORIGINATED | 594 | $281,394 | 867 | $235,252 | 1,537 | $264,254 | 67 | $168,680 | 6 | $1,724,388 | 225 | $196,282 | 24 | $96,042 |
| APPLICATIONS APPROVED, NOT ACCEPTED | 75 | $268,541 | 134 | $240,592 | 194 | $298,785 | 9 | $160,928 | 0 | $0 | 33 | $210,512 | 11 | $89,389 |
| APPLICATIONS DENIED | 162 | $264,429 | 280 | $214,587 | 821 | $310,137 | 64 | $129,493 | 4 | $889,505 | 117 | $186,283 | 49 | $80,480 |
| APPLICATIONS WITHDRAWN | 105 | $301,576 | 145 | $256,118 | 385 | $286,291 | 23 | $143,336 | 0 | $0 | 42 | $244,447 | 3 | $81,333 |
| FILES CLOSED FOR INCOMPLETENESS | 31 | $267,058 | 48 | $234,892 | 133 | $298,858 | 6 | $123,330 | 0 | $0 | 11 | $175,836 | 4 | $125,250 |
Detailed mortgage data for all 33 tracts in Hayward, CA
| Private Mortgage Insurance Companies Aggregated Statistics For Year 2009 (Based on 22 full and 11 partial tracts) | ||||
| A) Conventional Home Purchase Loans | B) Refinancings | |||
|---|---|---|---|---|
| Number | Average Value | Number | Average Value | |
| LOANS ORIGINATED | 145 | $255,382 | 12 | $314,094 |
| APPLICATIONS APPROVED, NOT ACCEPTED | 73 | $279,810 | 19 | $375,403 |
| APPLICATIONS DENIED | 26 | $242,937 | 8 | $333,834 |
| APPLICATIONS WITHDRAWN | 13 | $266,807 | 3 | $293,843 |
| FILES CLOSED FOR INCOMPLETENESS | 4 | $233,418 | 0 | $0 |
2005 - 2018 National Fire Incident Reporting System (NFIRS) incidents
- Fire incident types reported to NFIRS in Hayward, CA
- 25746.6%Structure Fires
- 18433.4%Outside Fires
- 10318.7%Mobile Property/Vehicle Fires
- 71.3%Other
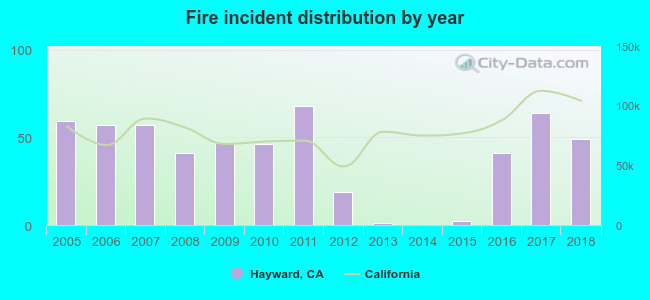 According to the data from the years 2005 - 2018 the average number of fires per year is 39. The highest number of reported fire incidents - 68 took place in 2011, and the least - 0 in 2014. The data has a decreasing trend.
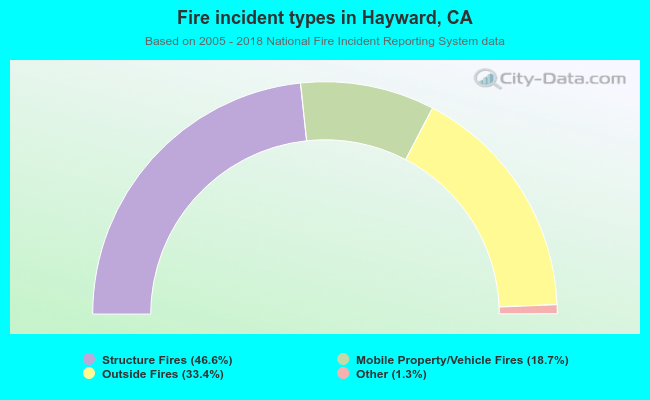 When looking into fire subcategories, the most reports belonged to: Structure Fires (46.6%), and Outside Fires (33.4%).
Fire-safe hotels and motels in Hayward, California:
- Comfort Inn, 24997 Mission Blvd, Hayward, California 94544 , Phone: (510) 538-4466, Fax: (510) 581-8029
- Best Western Plus Inn Of Hayward, 360 W A St, Hayward, California 94541 , Phone: (510) 785-8700, Fax: (510) 782-0850
- Ramada Limited, 21598 Foothill Blvd, Hayward, California 94541 , Phone: (510) 538-4380, Fax: (510) 889-0728
- Mainstay Suites, 835 W A St, Hayward, California 94541 , Phone: (510) 731-3571, Fax: (510) 731-3572
- Vagabond Inn Executive Hayward, 500 W A St, Hayward, California 94541 , Phone: (510) 786-0417, Fax: (510) 785-9142
- La Quinta Inn & Suites, 20777 Hesperian Blvd, Hayward, California 94541 , Phone: (800) 553-5083, Fax: (510) 783-2265
- Fairfield Inn & Suites By Marriott Oakland Hayward, 25921 Industrial Blvd, Hayward, California 94545 , Phone: (510) 782-5000, Fax: (510) 782-5222
- Days Inn & Suites, 24400 Mission Blvd, Hayward, California 94544 , Phone: (510) 537-5404, Fax: (510) 537-7531
- 4 other hotels and motels
| Most common first names in Hayward, CA among deceased individuals | ||
| Name | Count | Lived (average) |
|---|---|---|
| John | 846 | 72.9 years |
| Mary | 773 | 79.9 years |
| William | 600 | 73.1 years |
| Robert | 508 | 69.6 years |
| Joseph | 437 | 73.7 years |
| James | 426 | 69.7 years |
| Frank | 414 | 75.9 years |
| George | 386 | 74.5 years |
| Charles | 338 | 74.2 years |
| Helen | 318 | 78.5 years |
| Most common last names in Hayward, CA among deceased individuals | ||
| Last name | Count | Lived (average) |
|---|---|---|
| Smith | 246 | 74.0 years |
| Johnson | 195 | 74.3 years |
| Silva | 173 | 77.1 years |
| Williams | 168 | 72.5 years |
| Brown | 138 | 74.2 years |
| Garcia | 123 | 73.3 years |
| Davis | 118 | 73.1 years |
| Martin | 113 | 75.3 years |
| Martinez | 112 | 69.6 years |
| Perry | 111 | 74.8 years |
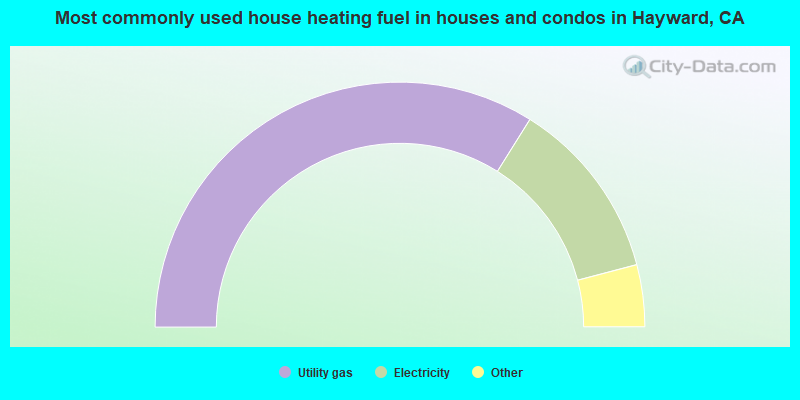
- 67.9%Utility gas
- 24.0%Electricity
- 3.1%No fuel used
- 2.3%Bottled, tank, or LP gas
- 2.1%Solar energy
- 0.3%Other fuel
- 0.3%Fuel oil, kerosene, etc.
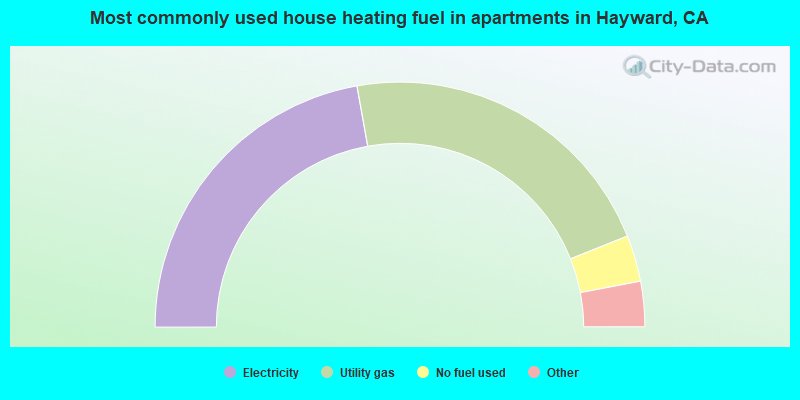
- 44.4%Electricity
- 43.5%Utility gas
- 6.1%No fuel used
- 3.6%Bottled, tank, or LP gas
- 1.8%Solar energy
- 0.6%Fuel oil, kerosene, etc.
Hayward compared to California state average:
- Unemployed percentage below state average.
- Black race population percentage above state average.
- Foreign-born population percentage above state average.
Hayward, CA compared to other similar cities:
Hayward on our top lists:
- #19 on the list of "Top 101 cities with the highest number of auto thefts per 100,000 residents, excludes tourist destinations and others with a lot of outsiders visiting based on city industries data (population 50,000+)"
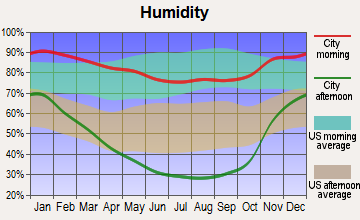
- #23 on the list of "Top 101 cities with the largest differences between morning and afternoon humidity (population 50,000+)"
- #23 on the list of "Top 101 cities with the largest humidity differences during a year (population 50,000+)"
- #23 on the list of "Top 100 most racially diverse cities (pop. 50,000+)"
- #25 on the list of "Top 101 cities with largest percentage of males in industries: transportation and warehousing (population 50,000+)"
- #27 on the list of "Top 101 cities with the most residents born in Other South Eastern Asia (population 500+)"
- #29 on the list of "Top 101 cities with the largest racial income disparity between any two races with at least 2,000 householders"
- #49 on the list of "Top 101 cities with largest percentage of males in occupations: transportation occupations (population 50,000+)"
- #50 on the list of "Top 101 cities with the largest city-data.com crime index increase from 2011 to 2012 (population 50,000+)"
- #55 on the list of "Top 101 cities with the highest maximum monthly sunshine amount (population 50,000+)"
- #55 on the list of "Top 100 cities with highest percentage of foreign-born residents (pop. 50,000+)"
- #60 on the list of "Top 101 cities with the most cars per house, population 50,000+"
- #67 on the list of "Top 101 cities with the highest average sunshine amount (population 50,000+)"
- #70 on the list of "Top 101 cities with the largest sunshine amount differences during a year (population 50,000+)"
- #70 on the list of "Top 101 cities with the most residents born in Oceania (population 500+)"
- #73 on the list of "Top 101 cities with largest percentage of females in occupations: healthcare support occupations (population 50,000+)"
- #73 on the list of "Top 101 cities with the most residents born in Afghanistan (population 500+)"
- #80 on the list of "Top 101 cities with the lowest percentage of English-only speaking households, population 50,000+"
- #84 on the list of "Top 101 cities with largest percentage of females in occupations: material moving occupations (population 50,000+)"
- #94 on the list of "Top 101 cities with the highest number of days clear of clouds (population 50,000+)"
- #68 (94588) on the list of "Top 101 zip codes with the most big companies in 2005 (at least 1000 employees)"
- #81 (94588) on the list of "Top 101 zip codes with the most medium-big companies in 2005 (at least 100 employees)"
- #96 (94544) on the list of "Top 101 zip codes with the largest percentage of Portuguese first ancestries (pop 5,000+)"
- #11 on the list of "Top 101 counties with the lowest Ozone (1-hour) air pollution readings in 2012 (ppm)"
- #17 on the list of "Top 101 counties with highest percentage of residents voting for Obama (Democrat) in the 2012 Presidential Election (pop. 50,000+)"
- #18 on the list of "Top 101 counties with the most Other congregations"
- #21 on the list of "Top 101 counties with the highest surface withdrawal of fresh water for public supply (pop. 50,000+)"
- #22 on the list of "Top 101 counties with the highest percentage of residents that exercised in the past month"

|
|
Total of 2295 patent applications in 2008-2024.