This comparison of life and living conditions in Sacramento, CA, and Hayward, CA covers a variety of aspects including crime and safety, weather, living costs, education quality, economy and job outlook, transportation, taxes, culture and food, sports, geography, and healthcare. Both are favored relocation and vacation destinations in California. While Sacramento is the state capital and has a somewhat higher cost of living, Hayward is part of the bustling San Francisco Bay Area.
Distance between
Sacramento, CA and
Hayward, CA : 71.2 miles
Sacramento's population is larger by 229%. Its population has grown by 118,023 people (29.0%) since 2000. The population of Hayward has grown by 19,797 people (14.1%) during that time.
Crime rates are a major factor to consider when relocating. Both Sacramento and Hayward have crime rates higher than the national average, with Hayward slightly higher than Sacramento. However, both cities are actively investing in community programs to reduce crime and maintain public safety. For tourists, it's important to stay aware of your surroundings in both cities, especially at night.
City-data.com crime index counts serious crimes and violent crime more heavily. It adjusts for the number of visitors and daily workers commuting into cities. (higher means more crime, U.S. average = 301.1)
City-data.com crime index counts serious crimes and violent crime more heavily. It adjusts for the number of visitors and daily workers commuting into cities. (higher means more crime, U.S. average = 301.1)
Sex Offenders
According to our data, there are 2,168 registered sex offenders living in Sacramento and 260 registered sex offenders living in . The ratio of residents to sex offenders in Sacramento is 228 to 1; the ratio in Hayward is 611 to 1. The number of registered sex offenders compared to the number of residents is much larger in Sacramento than that in Hayward.
Cost of Living
Living in California is generally more expensive compared to other states, and this applies to both Sacramento and Hayward. However, Hayward, being part of the Bay Area, has a considerably higher cost of living than Sacramento, particularly concerning housing costs.
Income Tax
Both cities abide by California state's progressive income tax system – the taxes progressively increase with higher income levels.
Property Tax
Property taxes in both cities adhere to California’s statewide rules, but they can be significantly higher in Hayward due to its higher housing costs.
Sales Tax
Sales tax in Sacramento is relatively high at 8.75%, but not significantly different from Hayward's sales tax rate of 9.25% - both are inclusive of the California state sales tax rate of 7.25%.
Income
Type
Sacramento
Hayward
Estimated median household income
$75,311
$96,386
Estimated per capita income
$37,916
$39,334
Cost of living index (U.S. average is 100)
102.9
122.9
If you make $50,000 in Sacramento, you will have to make $59,718 in Hayward to maintain the same standard of living.
Geographical Conditions
Sacramento is located in the Central Valley and is fairly flat, surrounded by areas of agriculture. Meanwhile, Hayward is located on the east side of the San Francisco Bay and features more diverse terrain including hills and shoreline.
Both cities boast of quality education systems. Sacramento, being the state capital, hosts several reputed public and private schools and colleges, including California State University, Sacramento. Hayward is served by Hayward Unified School District and also hosts California State University, East Bay.
Sacramento's economy is diverse, with government, healthcare, and education being significant sectors. In contrast, Hayward is a part of the tech-rich Bay Area, with many residents commuting to tech and IT jobs. The employment growth rates are good in both cities, but Hayward may offer a competitive edge for job seekers in tech fields.
Biggest Employers
In Sacramento, the State of California, Sacramento County, and healthcare organizations like Sutter Health are the biggest employers. For Hayward, the largest employers include Hayward Unified School District, the City of Hayward, and major manufacturing and distribution companies like PepsiCo.
There were 1,004 building permits issued in Sacramento in 2012 (943 more than in 2011) compared to 209 building permits issued in Hayward in 2012 (14 less than in 2011).
In Sacramento (Sacramento County), 58.1% voted for Democrats and 39.1% for Republicans in 2012 Presidential Election. In Hayward (Alameda County), 78.9% voted for Democrats and 18.2% for Republicans.
Elections
Type
Democrats
Republicans
Other
Year
Sacramento
Hayward
Sacramento
Hayward
Sacramento
Hayward
2020
61.4%
79.8%
36.1%
17.6%
2.5%
2.6%
2016
58.0%
78.2%
33.8%
14.6%
8.3%
7.2%
2012
58.1%
78.9%
39.1%
18.2%
2.8%
3.0%
2008
58.4%
78.8%
39.4%
19.3%
2.2%
2.0%
2004
49.8%
75.5%
49.6%
23.4%
0.6%
1.1%
2000
49.4%
69.6%
45.4%
24.2%
5.2%
6.2%
1996
49.8%
65.8%
40.8%
23.1%
9.4%
11.2%
Breakdown of population affiliated with a religious congregation
Type
Adherents
Congregations
Religion
Sacramento
Hayward
Sacramento
Hayward
CATHOLIC CHURCH
16.2%
15.3%
5.1%
4.9%
SOUTHERN BAPTIST CONVENTION
1.7%
1.5%
8.6%
10.9%
MUSLIM ESTIMATE
0.9%
2.0%
1.3%
2.5%
NORTH AMERICAN BAPTIST CONFERENCE
0.6%
0.0%
2.2%
0.1%
SEVENTH DAY ADVENTIST CHURCH
0.6%
0.3%
2.1%
1.4%
EVANGELICAL LUTHERAN CHURCH IN AMERICA
0.5%
0.3%
1.8%
2.3%
AMERICAN BAPTIST CHURCHES IN THE USA
0.4%
0.5%
1.7%
2.5%
EPISCOPAL CHURCH
0.3%
0.3%
1.4%
1.7%
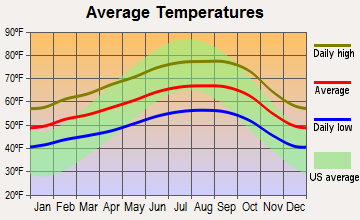
Weather
The weather in both cities is typical of California, with mild, wet winters and hot, dry summers. Sacramento often experiences higher temperatures during summer, frequently crossing 90 degrees. Hayward, being closer to the bay, enjoys a more moderate climate, with cooler summers and somewhat warmer winters.
Weather and climate
Type
Sacramento
Hayward
Temperature - Average
62.2°F
59°F
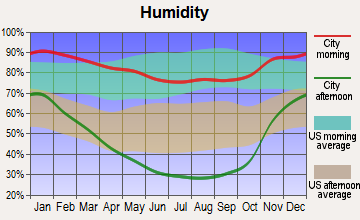
Humidity - Average morning or afternoon humidity
66.8%
83.5%
Humidity - Differences between morning and afternoon humidity
58%
29.1%
Humidity - Maximum monthly morning or afternoon humidity
87%
89.9%
Humidity - Minimum monthly morning or afternoon humidity
29%
60.8%
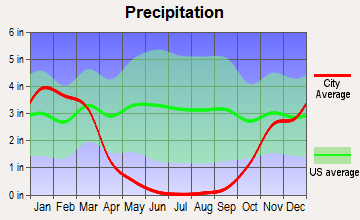
Precipitation - Yearly average
19 in
19.7 in
Snowfall - Yearly average
0 in
0 in
Clouds - Number of days clear of clouds
31.5%
26.9%
Sunshine amount - Average
83.6%
73.1%
Sunshine amount - Differences during a year
52%
22.1%
Sunshine amount - Maximum monthly
97%
77%
Sunshine amount - Minimum monthly
45%
54.9%
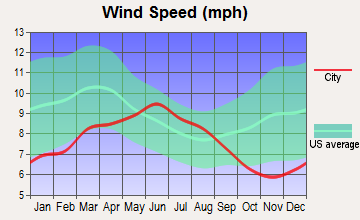
Wind speed - Average
6.8 mph
11.3 mph
Average climate in Sacramento, California
Average climate in Hayward, California
Air pollution
Type
AQI
CO
NO2
OZONE
PB
PM10
PM25
SO2
Year
Sacramento
Hayward
Sacramento
Hayward
Sacramento
Hayward
Sacramento
Hayward
Sacramento
Hayward
Sacramento
Sacramento
Hayward
Sacramento
Hayward
2018
121
106
0.32
0.45
9.7
12.0
24.7
30.9
0.002
0.009
28.9
N/A
12.7
12.5
N/A
0.4
2017
117
102
0.33
0.44
9.0
11.7
25.2
27.6
0.002
0.007
22.1
N/A
8.8
10.1
N/A
0.5
2016
103
94
0.44
0.38
8.0
10.8
25.3
25.7
0.002
0.004
14.0
N/A
9.0
7.5
N/A
0.7
2015
105
96
0.25
0.39
9.7
12.2
24.9
26.3
0.002
0.004
16.2
N/A
10.9
8.5
N/A
0.6
2014
99
93
0.24
0.37
10.2
12.3
24.9
25.8
0.002
0.005
15.6
N/A
9.6
8.2
N/A
0.4
2013
102
98
0.29
0.36
11.1
12.8
23.2
24.0
0.002
0.004
21.3
N/A
11.9
10.3
N/A
0.5
2012
107
89
0.31
0.35
10.5
11.6
25.2
24.9
0.002
0.003
15.2
N/A
7.9
8.6
N/A
0.6
2011
106
100
0.29
0.34
11.2
12.4
24.0
25.4
0.002
0.002
17.7
N/A
10.8
9.8
N/A
0.8
2010
109
97
0.29
0.32
11.2
12.6
22.8
20.5
N/A
0.006
16.9
N/A
9.3
8.4
0.5
0.7
2009
118
101
0.40
0.33
12.4
13.4
23.3
25.5
0.003
0.004
20.6
N/A
11.4
10.1
0.5
0.9
2008
130
115
0.40
0.38
14.9
14.2
25.4
26.4
N/A
0.007
24.3
N/A
13.6
11.0
0.5
0.8
2007
129
104
0.39
0.45
14.8
13.8
23.7
23.9
0.005
0.006
19.9
N/A
13.5
9.5
0.6
0.7
2006
124
110
0.49
0.51
15.4
14.8
22.7
25.7
N/A
N/A
23.7
N/A
13.0
10.0
0.5
0.8
2005
125
105
0.42
0.49
15.9
14.9
20.0
22.6
N/A
N/A
22.1
N/A
13.5
11.0
0.6
1.0
2004
119
113
0.49
0.46
15.8
15.0
19.1
24.6
N/A
0.004
22.7
N/A
13.3
11.0
0.6
1.7
2003
119
89
0.47
0.57
16.8
16.6
20.3
25.3
N/A
N/A
23.1
N/A
N/A
N/A
0.9
1.1
2002
114
90
0.50
0.63
18.1
18.3
21.2
24.5
0.004
0.006
25.1
N/A
N/A
N/A
1.5
1.4
2001
111
86
0.43
0.63
18.0
18.3
21.2
22.9
0.004
0.006
20.7
N/A
N/A
N/A
1.4
1.3
2000
107
94
0.55
0.68
17.9
18.4
19.5
22.3
0.004
0.007
19.1
N/A
N/A
N/A
1.4
1.6
Natural disasters
Type
Sacramento
Hayward
Tornado activity compared to U.S. average
8.8%
9.3%
Earthquake activity compared to U.S. average
7,798.9%
7,722.6%
Natural disasters compared to U.S. average
18%
20%
Transportation
Both Sacramento and Hayward offer public transit systems, and both cities are commuter-friendly with highway access and commuter rail services. Hayward, however, has more commuting traffic due to its proximity to the Bay Area.
Transport
Type
Sacramento
Hayward
Amtrak stations
1
1
Amtrak stations nearby
3
3
FAA registered aircraft
414
115
FAA registered aircraft manufacturers and dealers
20
7
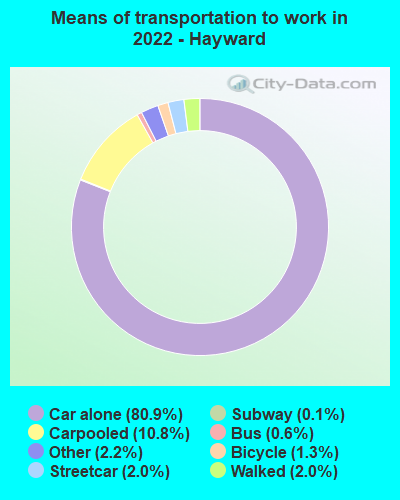
Means of transportation to work
Type
Sacramento
Hayward
Bicycle
1.1%
0.6%
Bus
1%
2.4%
Carpooled
12%
9.4%
Car alone
80%
83.9%
Motorcycle
0.2%
0.4%
Railroad
0.4%
0.4%
Streetcar
0.1%
0.3%
Taxicab
0.1%
0.1%
Walked
2.8%
2.1%
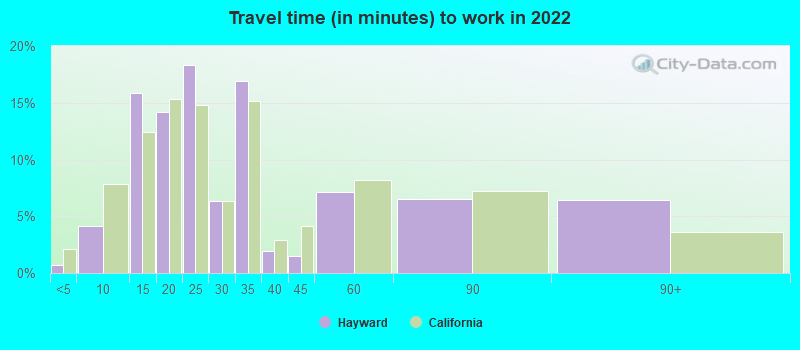
Average travel time to work
Type
Sacramento
Hayward
Average
28.5 min
32.2 min
Other means
22.8 min
31.2 min
Public transportation
39 min
53.5 min
Private vehicle occupancy
Type
Sacramento
Hayward
Average
1.2
1.2
Drove alone
88.5%
87.1%
In 2 person carpool
9.4%
9.1%
In 3 person carpool
1.2%
2.3%
In 4 person carpool
0.4%
1.2%
In 5-6 person carpool
0.5%
0.3%
How many people usually rode to work in the car, truck or van.
Real Estate
Real estate market trends differ in both cities. Housing in Hayward is pricier than in Sacramento due to its proximity to the Bay Area and Silicon Valley. Sacramento’s real estate market, whilst more affordable, is also active and competitive.
Neighborhoods
Both cities have a range of neighborhoods to suit different lifestyles. Sacramento has vibrant areas like Downtown, Midtown, and East Sacramento. In Hayward, neighborhoods like the Downtown area, Fairview, and Hayward Highland are popular.
Houses and residents
Type
Sacramento
Hayward
Houses
210,715
50,777
Average household size (people)
2.6
3.1
Median year apartment built
1977
1973
Median year house/condo built
1978
1969
Length of stay in the house since moving in
12.8 years
14.7 years
Houses occupied
202,093 (95.9%)
48,619 (95.8%)
Houses occupied by owners
103,994 (51.5%)
26,763 (55%)
Houses occupied by renters
98,099 (48.5%)
21,856 (45%)
Median rent asked for vacant for-rent units
$976.09
$2,202
Median monthly housing costs
$1,558
$2,105
Median price asked for vacant for-sale houses and condos
$398,191
$1,086,575
Estimated median house or condo value
$449,600
$735,000
Median numbers of rooms
5
4.5
Median number of rooms in apartments
4.1
3.8
Median number of rooms in houses and condos
5.8
5.3
Median house price - detached houses
$496,462
$843,259
Median house price - in 3-to-4-unit structures
$205,310
$579,620
Median house price - in 5 or more unit structures
$382,635
$511,365
Median house price - mobile homes
$104,325
$188,864
Median house price - Townhouses or other attached units
$463,571
$597,802
Median house price - All housing units
$481,210
$738,708
Median house age
44
50
Renting percentage
50.6%
47.2%
Housing density (houses/condos per square mile)
2,168.8
1,145.3
House value disparities
25.5%
22.6%
Household income disparities
44%
42.2%
Median household income for houses/condes with a mortgage
$109,432
$145,865
Median household income for apartments without a mortgage
$82,443
$78,438
Housing units without a mortgage
1,166 (1.6%)
117 (0.6%)
Housing units with both a second mortgage and home equity loan
4,385 (6.1%)
934 (5.1%)
Housing units with a mortgage
70,415 (98.4%)
18,244 (99.4%)
Housing units with a home equity loan
204 (0.3%)
39 (0.2%)
Housing units with a second mortgage
5,362 (7.5%)
1,419 (7.7%)
House/condo owner moved in on average (years ago)
10
12
House/condo renter moved in on average (years ago)
3
4
Housing units lacking complete kitchen facilities
1.2%
1.7%
Housing units lacking complete plumbing facilities
0.3%
0.6%
Housing units in structures
Housing units in structures
Sacramento
Hayward
One, detached
61.7%
52.4%
One, attached
6.8%
11.4%
Two
1.8%
1.2%
3 or 4
4.8%
4.0%
5 to 9
6.9%
6.1%
10 to 19
4.9%
2.9%
20 to 49
3.5%
4.4%
50 or more
7.6%
12.2%
Mobile homes
1.9%
5.0%
Boats, RVs, vans, etc.
0.0%
0.4%
Median real estate property taxes paid for housing units
Self-employed workers in own not incorporated business
12,891
4,187
State government workers
40,274
1,803
Unpaid family workers
755
65
Industries and Occupations
Sacramento has a robust service industry with many opportunities in the government, healthcare, and education sectors. In contrast, Hayward is closely tied to Silicon Valley and sees a lot of employment in the tech and IT fields.
Both cities have access to excellent healthcare facilities, including top-rated hospitals and clinics. Sacramento, being larger, has a wider range of healthcare options while Hayward residents often avail top-tier healthcare services in the nearby San Francisco Bay Area.
Health (county statistics)
Type
Sacramento
Hayward
General health status score of residents in this county from 1 (poor) to 5 (excellent)
Being the state capital, Sacramento has well-developed infrastructure, including high-speed internet, excellent city services, and facilities. Hayward also boasts good infrastructure, with recent investments in infrastructure development due to its proximity to Silicon Valley and San Francisco.
Infrastructure
Type
Sacramento
Hayward
Hospitals
17
14
TV stations
23
28
Arenas or stadiums
1
1
Bank branches located here
127
22
Bank institutions located here
31
10
Main business address for public companies
5
5
Drinking water stations with no reported violations in the past
26
1
Drinking water stations with reported violations in the past
HMDA - Conventional home purchase loans - Applications denied
Year
Sacramento
Hayward
1999
1,003
541
2000
1,155
621
2001
983
484
2002
1,197
516
2003
2,258
721
2004
3,872
1,068
2005
4,610
1,282
2006
4,276
1,276
2007
2,386
815
2008
1,381
433
2009
647
280
Culture and Food
Sacramento, known as the “Farm-to-Fork Capital”, boasts a vibrant food scene with a focus on locally sourced foods. Hayward, owing to its diverse population, has a multi-cultural food scene with cuisines from around the world.
Sports Teams
Sacramento hosts the NBA's Sacramento Kings, while Hayward doesn't host any major sports teams but is closely located to the Bay Area, which hosts teams like the Golden State Warriors (NBA), San Francisco Giants (MLB), and others.


 Sacramento, CA
 Hayward, CA