Hillsboro, IL (Illinois) Houses and Residents
| Hillsboro: | $112,489 |
| Illinois: | $251,600 |
Mean price in 2022:
Detached houses: $144,657
Here: $144,657 State: $310,164
Total population: 6,089 (Urban population: 4,114 (all inside urban clusters), Rural population: 158 (all nonfarm))
Houses: 1,773 (1,663 occupied: 1,230 owner occupied, 454 renter occupied)
| % of renters here: | 27% |
| State: | 33% |
Housing density: 494 houses/condos per square mile
Median price asked for vacant for-sale houses and condos in 2022 in this county: $59,087.
Median contract rent in 2022: $489 (lower quartile is $235, upper quartile is $631)
Median rent asked for vacant for-rent units in 2022: $604
Median gross rent in Hillsboro, IL in 2022: $670
Housing units in Hillsboro with a mortgage: 738 (27 second mortgage, 0 home equity loan, 28 both second mortgage and home equity loan)
Houses without a mortgage: 0
Median household income for houses/condos with a mortgage: $80,881
Median household income for apartments without a mortgage: $63,715
Median monthly housing costs: $702
Compare current foreclosures near Hillsboro, IL:
| Photo | Address | Area | Beds / Baths | Price | Details |
|---|---|---|---|---|---|

|
#1
W Fairground Ave
Hillsboro, IL 62049
|
1,520 sq. feet
|
1 baths 3 beds |
show details | |

|
#2
Miller Ave
Hillsboro, IL 62049
|
1,324 sq. feet
|
- baths - beds |
show details | |

|
#3
S Hamilton St Apt 6
Hillsboro, IL 62049
|
- sq. feet
|
- baths - beds |
show details | |

|
#4
Independence Dr
Hillsboro, IL 62049
|
- sq. feet
|
- baths - beds |
show details | |

|
#5
N Illinois Ave
Litchfield, IL 62056
|
1,943 sq. feet
|
2 baths 3 beds |
$42,500
|
show details |

|
#6
Ash St
Hillsboro, IL 62049
|
- sq. feet
|
- baths - beds |
show details | |

|
#7
School St
Hillsboro, IL 62049
|
- sq. feet
|
- baths - beds |
show details | |

|
#8
Donnell Ave
Donnellson, IL 62019
|
- sq. feet
|
2 baths 3 beds |
show details | |

|
#9
N State St
Litchfield, IL 62056
|
1,548 sq. feet
|
1 baths 3 beds |
show details | |

|
#10
Illinois Route 16
Litchfield, IL 62056
|
- sq. feet
|
1 baths 3 beds |
show details |
| Photo | Address | Area | Beds / Baths | Price | Details |
|---|---|---|---|---|---|

|
#11
Cleveland Ave
Panama, IL 62077
|
- sq. feet
|
1 baths 3 beds |
show details | |

|
#12
N Madison St
Litchfield, IL 62056
|
- sq. feet
|
2 baths 3 beds |
show details | |

|
#13
Old Route 66
Mount Olive, IL 62069
|
- sq. feet
|
- baths - beds |
show details | |

|
#14
E Water St
Litchfield, IL 62056
|
- sq. feet
|
- baths - beds |
show details | |

|
#15
S Central St
Coffeen, IL 62017
|
2,128 sq. feet
|
- baths - beds |
show details | |

|
#16
N Elm St
Nokomis, IL 62075
|
- sq. feet
|
- baths - beds |
show details | |

|
#17
Johnson Ln
Raymond, IL 62560
|
- sq. feet
|
- baths - beds |
show details | |

|
#18
N North St
Raymond, IL 62560
|
- sq. feet
|
- baths - beds |
show details | |

|
#19
S Harrison St
Litchfield, IL 62056
|
- sq. feet
|
- baths - beds |
show details | |

|
#20
W Hauser St
Litchfield, IL 62056
|
- sq. feet
|
- baths - beds |
show details |
| Photo | Address | Area | Beds / Baths | Price | Details |
|---|---|---|---|---|---|

|
#21
N Monroe St
Litchfield, IL 62056
|
- sq. feet
|
- baths - beds |
show details | |

|
#22
Longbridge Trl
Walshville, IL 62091
|
- sq. feet
|
- baths - beds |
show details | |

|
#23
Fox Hunt Trl
Walshville, IL 62091
|
- sq. feet
|
- baths - beds |
show details | |

|
#24
S Montgomery Ave
Litchfield, IL 62056
|
- sq. feet
|
- baths - beds |
show details | |

|
#25
Pinewood Rd
Litchfield, IL 62056
|
- sq. feet
|
- baths - beds |
show details | |

|
#26
E 3100 Ave
Ramsey, IL 62080
|
- sq. feet
|
- baths - beds |
show details | |

|
Check over 1 million property listings on Foreclosure.com!
|
browse all offers | |||

Latest news about housing in Hillsboro, IL collected exclusively by city-data.com from local newspapers, TV, and radio stations

 | Chicago Housing Market 2022 (216 replies) |
| Looking to purchase home in the Aurora/West Suburbs?? (25 replies) |
| need help! for hillsboro (25 replies) |

Median year apartment built: 1963
Household type by relationship:
Households: 5,594- Male householders: 1,047 (347 living alone), Female householders: 585 (264 living alone)
603 spouses (603 opposite-sex spouses), 107 unmarried partners, (107 opposite-sex unmarried partners), 1,010 children (922 natural, 27 adopted, 61 stepchildren), 120 grandchildren, 40 brothers or sisters, 0 parents, 0 foster children, 47 other relatives, 128 non-relatives
- In group quarters: 1,903
Size of family households: 485 2-persons, 95 3-persons, 123 4-persons, 101 5-persons, 12 6-persons, 83 7-or-more-persons.
Size of nonfamily households: 644 1-person, 148 2-persons.
484 married couples with children.
298 single-parent households (245 men, 53 women).
94.5% of residents of Hillsboro speak English at home.
4.5% of residents speak Spanish at home (87% speak English very well, 13% speak English well).
0.5% of residents speak other Indo-European language at home (72% speak English very well, 28% speak English not well).
0.1% of residents speak other language at home (50% speak English well, 50% speak English not well).
Foreign born population: 78 (1.4%)
(67.9% of them are naturalized citizens)
| Here: | 6.3 |
| State: | 6.4 |
| Here: | 4.6 |
| State: | 4.1 |

- Bedrooms in owner-occupied houses and condos in Hillsboro, Illinois
- 42no bedroom
- 411 bedroom
- 3122 bedrooms
- 5663 bedrooms
- 2374 bedrooms
- 335+ bedrooms

- Bedrooms in renter-occupied apartments in Hillsboro, Illinois
- 13no bedroom
- 1481 bedroom
- 2252 bedrooms
- 693 bedrooms
- 04 bedrooms
- 05+ bedrooms

- Cars and other vehicles available in Hillsboro in owner-occupied houses/condos
- 89no vehicle
- 3151 vehicle
- 4562 vehicles
- 2443 vehicles
- 1034 vehicles
- 235+ vehicles

- Cars and other vehicles available in Hillsboro in renter-occupied apartments
- 77no vehicle
- 1901 vehicle
- 1032 vehicles
- 843 vehicles
- 04 vehicles
- 05+ vehicles

- Rooms in owner-occupied houses in Hillsboro, Illinois
- 01 room
- 422 rooms
- 03 rooms
- 04 rooms
- 2085 rooms
- 4476 rooms
- 2097 rooms
- 1428 rooms
- 1839+ rooms

- Rooms in renter-occupied apartments in Hillsboro, Illinois
- 131 room
- 162 rooms
- 783 rooms
- 914 rooms
- 1305 rooms
- 1026 rooms
- 247 rooms
- 08 rooms
- 09+ rooms


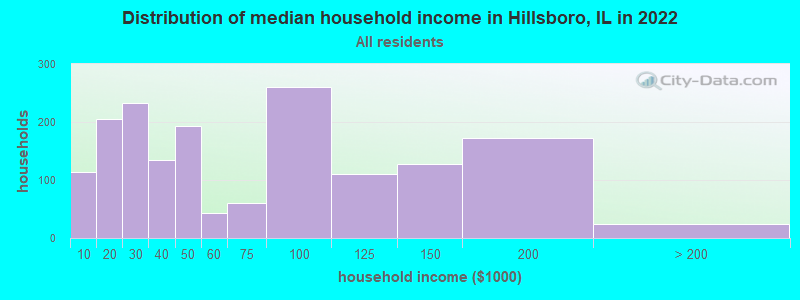
Hillsboro, IL household income distribution

- 114Less than $10,000
- 205$10,000 to $19,999
- 233$20,000 to $29,999
- 135$30,000 to $39,999
- 193$40,000 to $49,999
- 43$50,000 to $59,999
- 60$60,000 to $74,999
- 261$75,000 to $99,999
- 110$100,000 to $124,999
- 127$125,000 to $149,999
- 172$150,000 to $199,999
- 25$200,000 or more
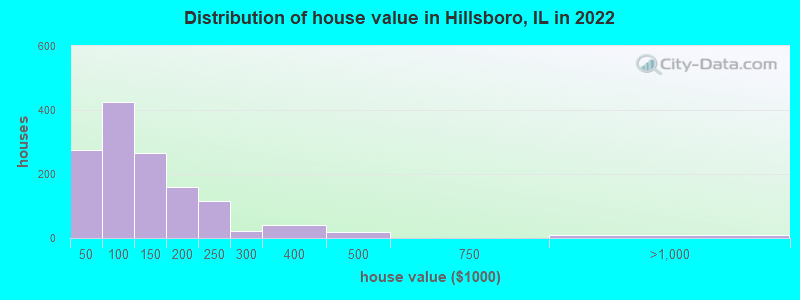
Home value of owner - occupied houses in 2022 in Hillsboro, IL
-
- 11$15,000 to $19,999
- 24$25,000 to $29,999
- 50$30,000 to $34,999
- 29$35,000 to $39,999
- 159$40,000 to $49,999
- 23$50,000 to $59,999
- 105$60,000 to $69,999
- 15$70,000 to $79,999
- 62$80,000 to $89,999
- 59$90,000 to $99,999
- 161$100,000 to $124,999
- 104$125,000 to $149,999
- 96$150,000 to $174,999
- 63$175,000 to $199,999
- 114$200,000 to $249,999
- 22$250,000 to $299,999
- 41$300,000 to $399,999
- 19$400,000 to $499,999
- 8$750,000 to $999,999
Rent paid by renters in 2022 in Hillsboro, IL
-
- 17Less than $100
- 19$100 to $149
- 33$150 to $199
- 35$200 to $249
- 15$300 to $349
- 13$350 to $399
- 61$450 to $499
- 60$500 to $549
- 80$600 to $649
- 44$650 to $699
- 24$700 to $749
- 15$3,500 or more
- 43No cash rent


Percentage of workers working in this county: 64.6%
Number of people working at home: 47 (3.5% of all workers)
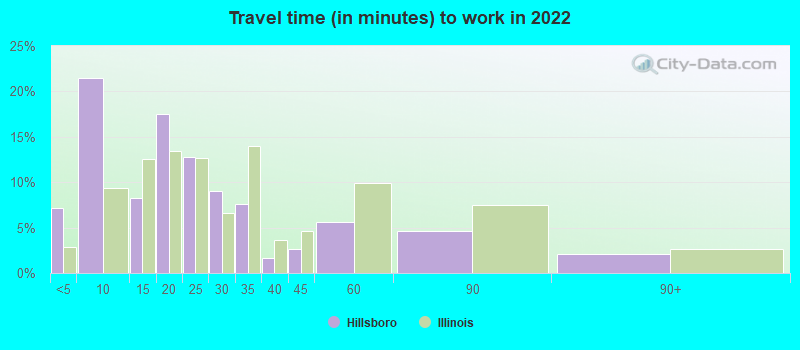
Travel time to work (commute)
- Less than 5 minutes: 243
- 5 to 9 minutes: 332
- 10 to 14 minutes: 78
- 15 to 19 minutes: 69
- 20 to 24 minutes: 83
- 25 to 29 minutes: 28
- 30 to 34 minutes: 14
- 35 to 39 minutes: 14
- 40 to 44 minutes: 0
- 45 to 59 minutes: 104
- 60 to 89 minutes: 190
- 90 or more minutes: 85
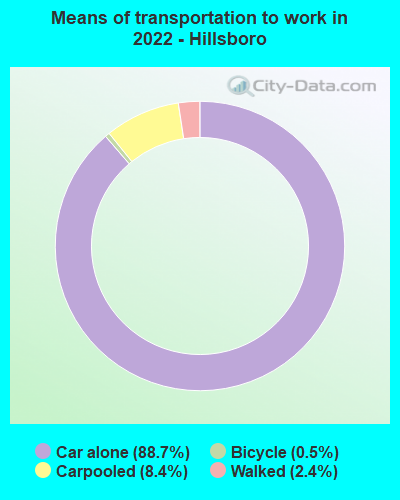
Means of transportation to work:
- Drove a car alone: 2,065 (84.1%)
- Carpooled: 209 (8.5%)
- Bicycle: 13 (0.5%)
- Walked: 56 (2.3%)
- Worked at home: 47 (1.9%)

- Unemployment by race in 2022
- Unemployment rate for White non-Hispanic residents
- 3.8%Males
- 4.5%Females

- Year of entry for the foreign-born population in Hillsboro, Illinois
- 02010 or later
- 02000 to 2009
- 431990 to 1999
- 181980 to 1989
- 01970 to 1979
- 25Before 1970

First ancestries reported:
- German: 692 (25.5%)
- American: 484 (17.8%)
- English: 326 (12.0%)
- Irish: 239 (8.8%)
- Italian: 81 (3.0%)
- Scottish: 44 (1.6%)
- Dutch: 41 (1.5%)
- Polish: 27 (1.0%)
- African: 23 (0.8%)
- European: 20 (0.7%)
- Czech: 18 (0.7%)
- Greek: 17 (0.6%)
- Swiss: 11 (0.4%)
- British: 9 (0.3%)
- Czechoslovakian: 9 (0.3%)
- Slovak: 9 (0.3%)
- French: 7 (0.3%)
- Welsh: 7 (0.3%)
- Norwegian: 6 (0.2%)
Most common places of birth for foreign-born residents (%):
| Hillsboro: | 53.8% (42) |
| Illinois: | 34.7% (626,958) |
| Hillsboro: | 32.1% (25) |
| Illinois: | 0.9% (16,308) |
| Hillsboro: | 5.1% (4) |
| Illinois: | 1.0% (18,753) |
| Hillsboro: | 2.6% (2) |
| Illinois: | 0.4% (6,611) |
Place of birth for U.S.-born residents:
- This state: 4,453
- Other state: 1,021
- Northeast: 42
- Midwest: 420
- South: 374
- West: 179
79.3% of Hillsboro residents lived in the same house 1 years ago.
Out of people who lived in different houses, 19.8% lived in this county.
Out of people who lived in different counties, 90.3% lived in Illinois.
| Hillsboro: | 79.3% |
| State average: | 88.3% |
Education attainment for males 25 years and older:
- No schooling: 60
- Nursery to 4th grade: 0
- 5th and 6th grade: 0
- 7th and 8th grade: 109
- 9th grade: 99
- 10th grade: 161
- 11th grade: 142
- 12th grade, no diploma: 2
- High school graduate (or equivalency): 932
- Less than 1 year of college: 318
- Some college more than 1 year, no degree: 663
- Associate degree: 78
- Bachelor's degree: 210
- Master's degree: 86
- Professional school degree: 5
- Doctorate degree: 18

Education attainment for females 25 years and older:
- No schooling: 0
- Nursery to 4th grade: 10
- 5th and 6th grade: 0
- 7th and 8th grade: 27
- 9th grade: 0
- 10th grade: 10
- 11th grade: 17
- 12th grade, no diploma: 40
- High school graduate (or equivalency): 429
- Less than 1 year of college: 6
- Some college more than 1 year, no degree: 272
- Associate degree: 164
- Bachelor's degree: 137
- Master's degree: 219
- Professional school degree: 8
- Doctorate degree: 0


Housing units in structures:
- One, detached: 1,393
- One, attached: 41
- Two: 101
- 3 or 4: 46
- 5 to 9: 64
- 20 to 49: 50
- 50 or more: 23
- Mobile homes: 53
House/condo owner moved in on average 9 years ago
Renter moved in on average 3 years ago

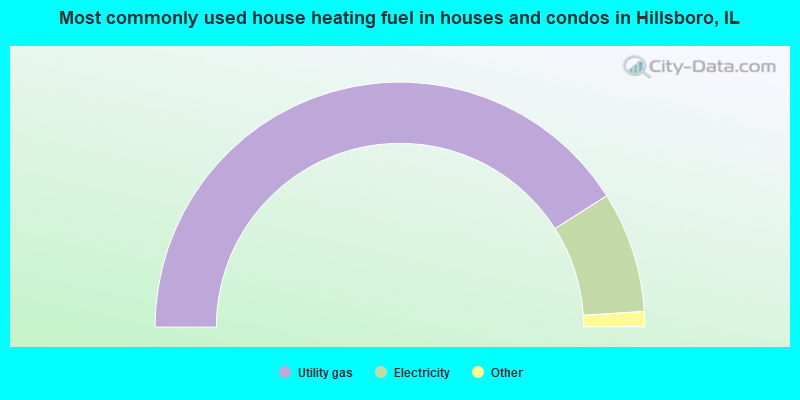
- 82.1%Utility gas
- 16.0%Electricity
- 1.1%Wood
- 0.8%Bottled, tank, or LP gas
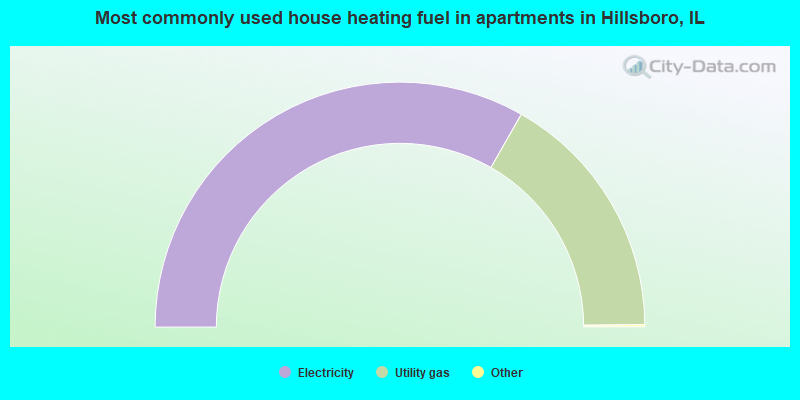
- 66.7%Electricity
- 33.3%Utility gas
Private vs. public school enrollment:
| Here: | 0.0% |
| Illinois: | 13.3% |
| Here: | 0.0% |
| Illinois: | 9.9% |
| Here: | 0.0% |
| Illinois: | 27.4% |


