Horse Cave, KY (Kentucky) Houses and Residents
| Horse Cave: | $87,725 |
| Kentucky: | $196,300 |
Mean price in 2022:
Detached houses: $113,049
Here: $113,049 State: $256,452 Mobile homes: $71,132
Here: $71,132 State: $84,635
Total population: 2,360 (Urban population: 2,143 (all inside urban clusters), Rural population: 88 (all nonfarm))
Houses: 1,213 (1,025 occupied: 604 owner occupied, 442 renter occupied)
| % of renters here: | 42% |
| State: | 31% |
Housing density: 408 houses/condos per square mile
Median price asked for vacant for-sale houses and condos in 2022: $797,793.
Median contract rent in 2022: $415 (lower quartile is $330, upper quartile is $614)
Median rent asked for vacant for-rent units in 2022: $474
Median gross rent in Horse Cave, KY in 2022: $633
Housing units in Horse Cave with a mortgage: 288 (54 second mortgage, 0 home equity loan, 39 both second mortgage and home equity loan)
Houses without a mortgage: 0
Median household income for houses/condos with a mortgage: $55,780
Median household income for apartments without a mortgage: $48,464
Median monthly housing costs: $620
Compare current foreclosures near Horse Cave, KY:
| Photo | Address | Area | Beds / Baths | Price | Details |
|---|---|---|---|---|---|

|
#1
Vial St
Horse Cave, KY 42749
|
3,136 sq. feet
|
2 baths 4 beds |
show details | |

|
#2
New St
Horse Cave, KY 42749
|
1,765 sq. feet
|
2 baths 3 beds |
show details | |

|
#3
Comer Ave
Horse Cave, KY 42749
|
1,089 sq. feet
|
1 baths 2 beds |
show details | |

|
#4
Waterloo Rd
Horse Cave, KY 42749
|
- sq. feet
|
- baths - beds |
show details | |

|
#5
Pioneer Rd
Horse Cave, KY 42749
|
- sq. feet
|
- baths - beds |
show details | |

|
#6
L And N Turnpike Rd
Horse Cave, KY 42749
|
- sq. feet
|
- baths - beds |
show details | |

|
#7
W Main St Apt D
Horse Cave, KY 42749
|
- sq. feet
|
- baths - beds |
show details | |

|
#8
E Main St
Horse Cave, KY 42749
|
- sq. feet
|
- baths - beds |
show details | |

|
#9
Pritchardsville Rd
Glasgow, KY 42141
|
1,287 sq. feet
|
1 baths 3 beds |
show details | |

|
#10
Brownsville Rd
Park City, KY 42160
|
1,950 sq. feet
|
1 baths 2 beds |
show details |
| Photo | Address | Area | Beds / Baths | Price | Details |
|---|---|---|---|---|---|

|
#11
Virginia Ave
Glasgow, KY 42141
|
1,040 sq. feet
|
1 baths 3 beds |
show details | |

|
#12
Hutcherson Dr
Glasgow, KY 42141
|
1,835 sq. feet
|
1 baths 2 beds |
show details | |

|
#13
Main St
Munfordville, KY 42765
|
1,890 sq. feet
|
2 baths 4 beds |
show details | |

|
#14
Rogers Rd
Glasgow, KY 42141
|
1,040 sq. feet
|
1 baths 3 beds |
show details | |

|
#15
Green Valley Rd
Glasgow, KY 42141
|
684 sq. feet
|
1 baths 2 beds |
show details | |

|
#16
Hammonsville Rd
Bonnieville, KY 42713
|
1,512 sq. feet
|
2 baths 3 beds |
show details | |

|
#17
Campground Rd
Bonnieville, KY 42713
|
1,168 sq. feet
|
1 baths 3 beds |
show details | |

|
#18
Old Munfordville Rd
Glasgow, KY 42141
|
1,425 sq. feet
|
1 baths 3 beds |
show details | |

|
#19
N Jackson Hwy
Magnolia, KY 42757
|
1,334 sq. feet
|
1 baths 3 beds |
show details | |

|
#20
Mckenna St
Glasgow, KY 42141
|
1,038 sq. feet
|
1 baths 2 beds |
show details |
| Photo | Address | Area | Beds / Baths | Price | Details |
|---|---|---|---|---|---|

|
#21
Old Mammoth Cave Rd
Cave City, KY 42127
|
1,884 sq. feet
|
2 baths 3 beds |
show details | |

|
#22
Beverly Dr
Glasgow, KY 42141
|
1,908 sq. feet
|
2 baths 3 beds |
show details | |

|
#23
Hardyville Rd
Munfordville, KY 42765
|
1,217 sq. feet
|
1 baths 2 beds |
show details | |

|
#24
River Falls Dr
Glasgow, KY 42141
|
1,512 sq. feet
|
1 baths 3 beds |
show details | |

|
#25
Hunting Trail Rd
Munfordville, KY 42765
|
2,150 sq. feet
|
2 baths 3 beds |
show details | |

|
#26
Beverly Hills Dr
Glasgow, KY 42141
|
1,508 sq. feet
|
2 baths 3 beds |
show details | |

|
#27
S Dixie Hwy
Munfordville, KY 42765
|
1,590 sq. feet
|
1 baths 4 beds |
show details | |

|
#28
Elk St
Munfordville, KY 42765
|
1,120 sq. feet
|
1 baths 3 beds |
show details | |

|
#29
N 3rd St
Cave City, KY 42127
|
1,596 sq. feet
|
2 baths 4 beds |
show details | |

|
#30
Julia Ln
Munfordville, KY 42765
|
1,536 sq. feet
|
2 baths 4 beds |
show details |
| Photo | Address | Area | Beds / Baths | Price | Details |
|---|---|---|---|---|---|

|
#31
Bunch Rd
Cave City, KY 42127
|
1,288 sq. feet
|
2 baths 3 beds |
show details | |

|
#32
Elk St
Munfordville, KY 42765
|
1,084 sq. feet
|
1 baths 2 beds |
show details | |

|
#33
N Buckner Ave
Munfordville, KY 42765
|
1,352 sq. feet
|
1 baths 3 beds |
show details | |

|
#34
Broadway St
Cave City, KY 42127
|
1,987 sq. feet
|
1 baths 2 beds |
show details | |

|
#35
Branstetter St
Cave City, KY 42127
|
1,216 sq. feet
|
2 baths 3 beds |
show details | |

|
#36
Leech Ct
Glasgow, KY 42141
|
2,352 sq. feet
|
1 baths 3 beds |
show details | |

|
#37
Glasgow Rd
Edmonton, KY 42129
|
1,036 sq. feet
|
1 baths 2 beds |
show details | |

|
#38
Oak Tree Rd
Brownsville, KY 42210
|
2,240 sq. feet
|
- baths - beds |
show details | |

|
#39
Leslie Ave
Glasgow, KY 42141
|
- sq. feet
|
1 baths 6 beds |
show details | |

|
#40
Lick Branch Rd
Glasgow, KY 42141
|
- sq. feet
|
2 baths 3 beds |
show details |
| Photo | Address | Area | Beds / Baths | Price | Details |
|---|---|---|---|---|---|

|
#41
New Bowling Green Rd
Smiths Grove, KY 42171
|
- sq. feet
|
- baths - beds |
show details | |

|
#42
Cleveland Ave
Glasgow, KY 42141
|
- sq. feet
|
- baths - beds |
show details | |

|
#43
Bent Creek Dr
Smiths Grove, KY 42171
|
- sq. feet
|
- baths - beds |
show details | |

|
#44
Highway 1048
Center, KY 42214
|
- sq. feet
|
- baths - beds |
show details | |

|
#45
S Green St Apt 104
Glasgow, KY 42141
|
- sq. feet
|
- baths - beds |
show details | |

|
#46
Campground Rd
Bonnieville, KY 42713
|
- sq. feet
|
- baths - beds |
show details | |

|
#47
Hollis Thomas Rd
Glasgow, KY 42141
|
- sq. feet
|
- baths - beds |
show details | |

|
#48
Bill Pedigo Rd
Edmonton, KY 42129
|
- sq. feet
|
- baths - beds |
show details | |

|
#49
Highway 218
Greensburg, KY 42743
|
- sq. feet
|
- baths - beds |
show details | |

|
Check over 1 million property listings on Foreclosure.com!
|
browse all offers | |||


 | December 11, 2021 Deadly Tornado System (94 replies) |
| visiting this week/must see? (4 replies) |
| What do you think Lexington need that it doesn't have now? (89 replies) |
| Visiting Bardstown-Elizabethtown next week (11 replies) |
| Bi-ways of KY what are the best towns/views (8 replies) |
| Visiting the area … (20 replies) |

Median year apartment built: 1972
Household type by relationship:
Households: 2,357- Male householders: 424 (105 living alone), Female householders: 590 (153 living alone)
257 spouses (257 opposite-sex spouses), 133 unmarried partners, (133 opposite-sex unmarried partners), 598 children (562 natural, 9 adopted, 27 stepchildren), 21 grandchildren, 26 brothers or sisters, 14 parents, 0 foster children, 23 other relatives, 166 non-relatives
- In group quarters: 103
Size of family households: 364 2-persons, 113 3-persons, 86 4-persons, 12 5-persons.
Size of nonfamily households: 272 1-person, 161 2-persons, 8 3-persons, 12 5-persons.
84 married couples with children.
328 single-parent households (32 men, 296 women).
98.1% of residents of Horse Cave speak English at home.
0.5% of residents speak other Indo-European language at home (100% speak English very well).
1.6% of residents speak Asian or Pacific Island language at home (100% speak English very well).
Foreign born population: 34 (1.4%)
(105.9% of them are naturalized citizens)
| Here: | 6.1 |
| State: | 6.4 |
| Here: | 5.2 |
| State: | 4.4 |

- Bedrooms in owner-occupied houses and condos in Horse Cave, Kentucky
- 7no bedroom
- 61 bedroom
- 2192 bedrooms
- 3163 bedrooms
- 564 bedrooms
- 05+ bedrooms

- Bedrooms in renter-occupied apartments in Horse Cave, Kentucky
- 4no bedroom
- 551 bedroom
- 1582 bedrooms
- 1353 bedrooms
- 554 bedrooms
- 355+ bedrooms

- Cars and other vehicles available in Horse Cave in owner-occupied houses/condos
- 23no vehicle
- 1911 vehicle
- 2052 vehicles
- 633 vehicles
- 1184 vehicles
- 55+ vehicles

- Cars and other vehicles available in Horse Cave in renter-occupied apartments
- 72no vehicle
- 1961 vehicle
- 1582 vehicles
- 163 vehicles
- 04 vehicles
- 05+ vehicles

- Rooms in owner-occupied houses in Horse Cave, Kentucky
- 01 room
- 02 rooms
- 343 rooms
- 934 rooms
- 965 rooms
- 1376 rooms
- 827 rooms
- 628 rooms
- 1009+ rooms

- Rooms in renter-occupied apartments in Horse Cave, Kentucky
- 41 room
- 02 rooms
- 263 rooms
- 1334 rooms
- 875 rooms
- 986 rooms
- 947 rooms
- 08 rooms
- 09+ rooms


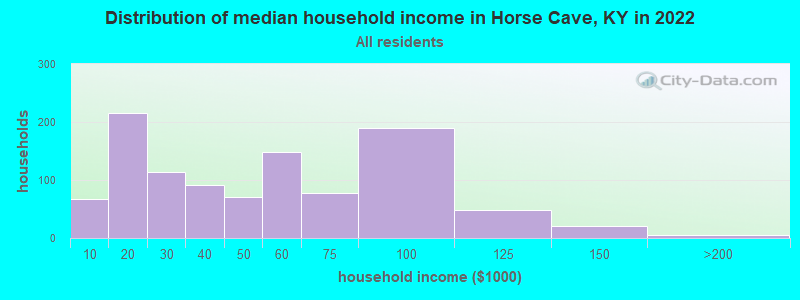
Horse Cave, KY household income distribution

- 67Less than $10,000
- 216$10,000 to $19,999
- 113$20,000 to $29,999
- 92$30,000 to $39,999
- 70$40,000 to $49,999
- 149$50,000 to $59,999
- 78$60,000 to $74,999
- 190$75,000 to $99,999
- 49$100,000 to $124,999
- 20$125,000 to $149,999
- 5$150,000 to $199,999
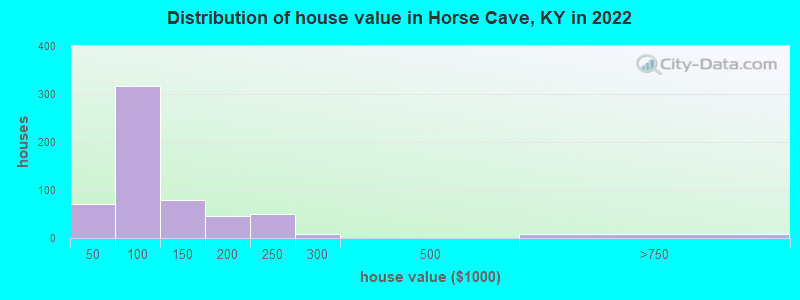
Home value of owner - occupied houses in 2022 in Horse Cave, KY
-
- 2$20,000 to $24,999
- 25$25,000 to $29,999
- 27$30,000 to $34,999
- 15$40,000 to $49,999
- 65$50,000 to $59,999
- 62$60,000 to $69,999
- 108$70,000 to $79,999
- 36$80,000 to $89,999
- 27$90,000 to $99,999
- 46$100,000 to $124,999
- 33$125,000 to $149,999
- 18$150,000 to $174,999
- 25$175,000 to $199,999
- 49$200,000 to $249,999
- 8$250,000 to $299,999
- 9$500,000 to $749,999
Rent paid by renters in 2022 in Horse Cave, KY
-
- 27$100 to $149
- 37$150 to $199
- 9$200 to $249
- 3$250 to $299
- 49$300 to $349
- 83$350 to $399
- 31$400 to $449
- 23$450 to $499
- 13$500 to $549
- 26$550 to $599
- 51$600 to $649
- 47$650 to $699
- 18$700 to $749
- 25No cash rent


Percentage of workers working in this county: 56.9%
Number of people working at home: 34 (4.7% of all workers)
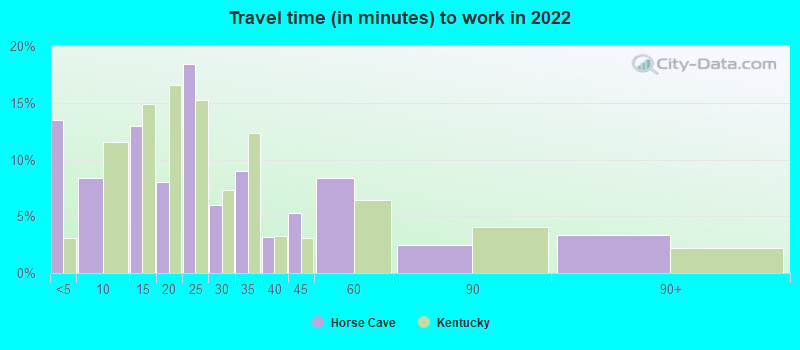
Travel time to work (commute)
- Less than 5 minutes: 57
- 5 to 9 minutes: 213
- 10 to 14 minutes: 91
- 15 to 19 minutes: 89
- 20 to 24 minutes: 74
- 25 to 29 minutes: 35
- 30 to 34 minutes: 12
- 35 to 39 minutes: 0
- 40 to 44 minutes: 34
- 45 to 59 minutes: 65
- 60 to 89 minutes: 5
- 90 or more minutes: 0
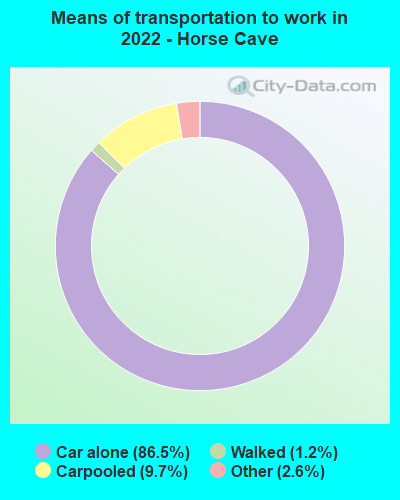
Means of transportation to work:
- Drove a car alone: 2,180 (82.5%)
- Carpooled: 269 (10.2%)
- Taxi: 79 (3.0%)
- Walked: 29 (1.1%)
- Worked at home: 34 (1.3%)

- Unemployment by race in 2022
- Unemployment rate for White non-Hispanic residents
- 5.3%Males
- 9.7%Females
- Unemployment rate for Black residents
- 12.6%Males

- Year of entry for the foreign-born population in Horse Cave, Kentucky
- 402010 or later
- 02000 to 2009
- 01990 to 1999
- 41980 to 1989
- 01970 to 1979
- 4Before 1970
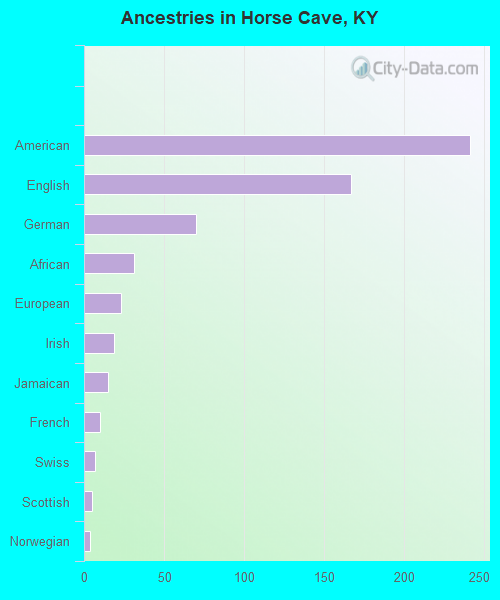
First ancestries reported:
- American: 241 (24.3%)
- English: 167 (16.8%)
- German: 70 (7.0%)
- African: 31 (3.1%)
- European: 23 (2.3%)
- Irish: 19 (1.9%)
- Jamaican: 15 (1.5%)
- French: 10 (1.0%)
- Swiss: 7 (0.7%)
- Scottish: 5 (0.5%)
- Norwegian: 4 (0.4%)
- Scotch-Irish: 2 (0.2%)
- Polish: 1 (0.1%)
Most common places of birth for foreign-born residents (%):
| Horse Cave: | 97.1% (34) |
| Kentucky: | 3.3% (6,109) |
Place of birth for U.S.-born residents:
- This state: 1,903
- Other state: 402
- Northeast: 33
- Midwest: 190
- South: 143
- West: 34
85.3% of Horse Cave residents lived in the same house 1 years ago.
Out of people who lived in different houses, 32.2% lived in this county.
Out of people who lived in different counties, 95.5% lived in Kentucky.
| Horse Cave: | 85.3% |
| State average: | 87.2% |
Education attainment for males 25 years and older:
- No schooling: 9
- Nursery to 4th grade: 2
- 5th and 6th grade: 1
- 7th and 8th grade: 33
- 9th grade: 20
- 10th grade: 42
- 11th grade: 77
- 12th grade, no diploma: 25
- High school graduate (or equivalency): 328
- Less than 1 year of college: 49
- Some college more than 1 year, no degree: 58
- Associate degree: 28
- Bachelor's degree: 43
- Master's degree: 33
- Professional school degree: 5
- Doctorate degree: 0

Education attainment for females 25 years and older:
- No schooling: 12
- Nursery to 4th grade: 0
- 5th and 6th grade: 5
- 7th and 8th grade: 50
- 9th grade: 13
- 10th grade: 22
- 11th grade: 7
- 12th grade, no diploma: 14
- High school graduate (or equivalency): 557
- Less than 1 year of college: 49
- Some college more than 1 year, no degree: 60
- Associate degree: 70
- Bachelor's degree: 53
- Master's degree: 23
- Professional school degree: 4
- Doctorate degree: 0


Housing units in structures:
- One, detached: 812
- One, attached: 4
- Two: 71
- 3 or 4: 110
- 5 to 9: 94
- 10 to 19: 18
- 20 to 49: 17
- Mobile homes: 85
Median worth of mobile homes: $63,692
Housing units lacking complete kitchen facilities in 2022: 1.3%
House/condo owner moved in on average 14 years ago
Renter moved in on average 4 years ago

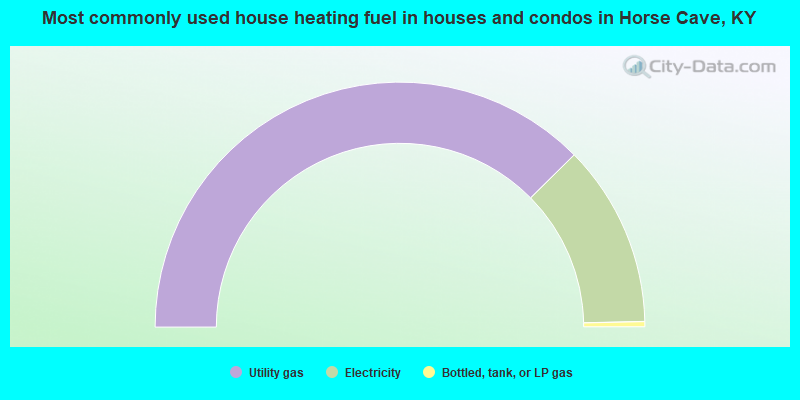
- 75.2%Utility gas
- 24.1%Electricity
- 0.7%Bottled, tank, or LP gas
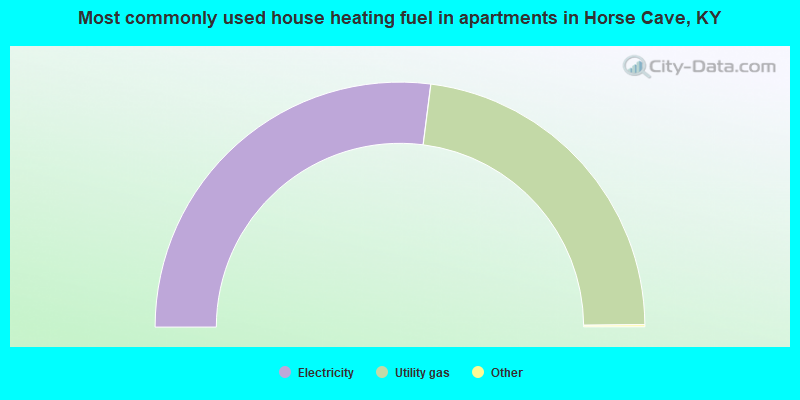
- 54.2%Electricity
- 45.8%Utility gas
Private vs. public school enrollment:
| Here: | 0.0% |
| Kentucky: | 17.2% |
| Here: | 12.1% |
| Kentucky: | 15.2% |
| Here: | 0.0% |
| Kentucky: | 19.6% |


