Jump to a detailed profile or search site with Google Custom Search

Imperial Beach, CA (California) Houses and Residents

Estimated median house or condo value in 2022: $868,664 (it was $168,000 in 2000)
Imperial Beach:

$868,664
California:

$715,900
Lower value quartile - upper value quartile: $633,836 - $1,089,322

Total population: 27,149 (Urban population: 26,980, Rural population: 0)

Houses: 10,258 (9,240 occupied: 2,879 owner occupied, 6,418 renter occupied)

% of renters here:

69%
State:

44%

Housing density: 2,403 houses/condos per square mile

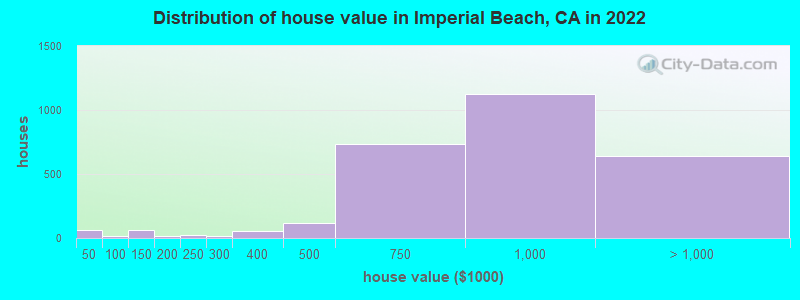
Median price asked for vacant for-sale houses and condos in 2022: $809,547.

Median contract rent in 2022: $1,732 (lower quartile is $1,421, upper quartile is over $2,000)


Median rent asked for vacant for-rent units in 2022: $1,942


Median gross rent in Imperial Beach, CA in 2022: $1,872

Housing units in Imperial Beach with a mortgage: 1,819 (247 second mortgage, 0 home equity loan, 194 both second mortgage and home equity loan)
Houses without a mortgage: 55

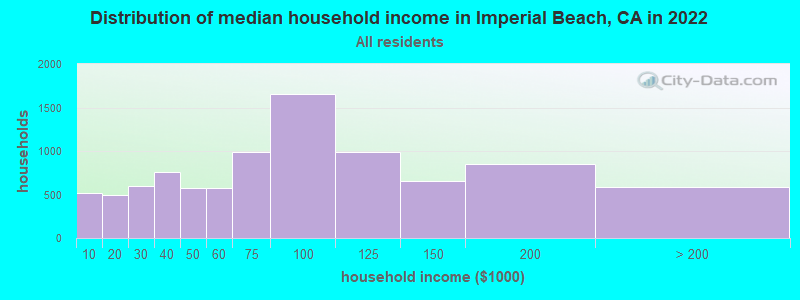
Median household income for houses/condos with a mortgage: $119,714

Median household income for apartments without a mortgage: $103,368

Median monthly housing costs: $1,858

Compare current foreclosures near Imperial Beach, CA:

Check out more offers near Imperial Beach, CA.
Powered by Foreclosure.com

Settings
X
Data:
Loading data...
Based on 2000-2022 data
Loading data...

123
Hide US histogram

Imperial Beach, California Age and Sex of Residents
Median year house/condo built: 1960

Median year apartment built: 1974

Household type by relationship:

Households: 26,049
  • Male householders: 4,661 (1,234 living alone), Female householders: 4,415 (1,021 living alone)
  • 3,514 spouses (3,483 opposite-sex spouses), 789 unmarried partners, (774 opposite-sex unmarried partners), 7,861 children (7,321 natural, 60 adopted, 479 stepchildren), 518 grandchildren, 475 brothers or sisters, 689 parents, 12 foster children, 776 other relatives, 1,228 non-relatives
  • In group quarters: 1,104

Size of family households: 2,230 2-persons, 1,970 3-persons, 904 4-persons, 693 5-persons, 215 6-persons, 134 7-or-more-persons.

Size of nonfamily households: 2,317 1-person, 642 2-persons, 109 3-persons, 62 4-persons, 2 7-or-more-persons.

2,762 married couples with children.
2,159 single-parent households (738 men, 1,421 women).

55.3% of residents of Imperial Beach speak English at home.
38.8% of residents speak Spanish at home (66% speak English very well, 21% speak English well, 11% speak English not well, 2% don't speak English at all).
1.3% of residents speak other Indo-European language at home (66% speak English very well, 32% speak English well, 2% speak English not well).
3.7% of residents speak Asian or Pacific Island language at home (62% speak English very well, 34% speak English well, 4% speak English not well).
0.3% of residents speak other language at home (15% speak English well, 68% speak English not well, 17% don't speak English at all).

Foreign born population: 4,452 (17.1%)
(45.2% of them are naturalized citizens)

Median number of rooms in houses and condos:
Here:

5.7
State:

6.0

Median number of rooms in apartments
Here:

4.0
State:

3.9

Owner-occupied Renter-occupied
Bedrooms in owner-occupied houses and condos in Imperial Beach, California
  • Bedrooms in owner-occupied houses and condos in Imperial Beach, California
  • 37no bedroom
  • 721 bedroom
  • 7272 bedrooms
  • 1,4633 bedrooms
  • 4894 bedrooms
  • 925+ bedrooms
Bedrooms in renter-occupied apartments in Imperial Beach, California
  • Bedrooms in renter-occupied apartments in Imperial Beach, California
  • 471no bedroom
  • 1,1871 bedroom
  • 3,3962 bedrooms
  • 1,1183 bedrooms
  • 1934 bedrooms
  • 535+ bedrooms
Owner-occupied Renter-occupied
Cars and other vehicles available in Imperial Beach in owner-occupied houses/condos
  • Cars and other vehicles available in Imperial Beach in owner-occupied houses/condos
  • 14no vehicle
  • 6851 vehicle
  • 1,1702 vehicles
  • 7063 vehicles
  • 2534 vehicles
  • 525+ vehicles
Cars and other vehicles available in Imperial Beach in renter-occupied apartments
  • Cars and other vehicles available in Imperial Beach in renter-occupied apartments
  • 658no vehicle
  • 2,4251 vehicle
  • 2,4092 vehicles
  • 7443 vehicles
  • 1034 vehicles
  • 815+ vehicles
Owner-occupied Renter-occupied
Rooms in owner-occupied houses in Imperial Beach, California
  • Rooms in owner-occupied houses in Imperial Beach, California
  • 371 room
  • 192 rooms
  • 2113 rooms
  • 3544 rooms
  • 7075 rooms
  • 6666 rooms
  • 4547 rooms
  • 3038 rooms
  • 1299+ rooms
Rooms in renter-occupied apartments in Imperial Beach, California
  • Rooms in renter-occupied apartments in Imperial Beach, California
  • 4671 room
  • 1572 rooms
  • 1,5233 rooms
  • 2,0084 rooms
  • 1,1545 rooms
  • 7276 rooms
  • 2037 rooms
  • 1278 rooms
  • 539+ rooms
Year house built
Median 2022 house/condo value by year built
Median house/condo value by year householder moved into unit
Breakdown of mean house values by ages of householders
Owners and renters by unit type in Imperial Beach, CA
  • Imperial Beach, CA household income distribution

  • Distribution of median household income in Imperial Beach, CA in 2022
  • 518Less than $10,000
  • 494$10,000 to $19,999
  • 600$20,000 to $29,999
  • 764$30,000 to $39,999
  • 571$40,000 to $49,999
  • 576$50,000 to $59,999
  • 991$60,000 to $74,999
  • 1,652$75,000 to $99,999
  • 985$100,000 to $124,999
  • 657$125,000 to $149,999
  • 848$150,000 to $199,999
  • 582$200,000 or more
  • Home value of owner - occupied houses in 2022 in Imperial Beach, CA

  • Distribution of house value in Imperial Beach, CA in 2022
  • 18Less than $10,000
  • 22$10,000 to $14,999
  • 21$35,000 to $39,999
  • 13$60,000 to $69,999
  • 60$100,000 to $124,999
  • 17$150,000 to $174,999
  • 22$200,000 to $249,999
  • 17$250,000 to $299,999
  • 51$300,000 to $399,999
  • 119$400,000 to $499,999
  • 737$500,000 to $749,999
  • 1,122$750,000 to $999,999
  • 588$1,000,000 to $1,499,999
  • 18$1,500,000 to $1,999,999
  • 30$2,000,000 or more
  • Rent paid by renters in 2022 in Imperial Beach, CA

  • Distribution of rent paid by renters in Imperial Beach, CA in 2022
  • 5$100 to $149
  • 5$150 to $199
  • 28$200 to $249
  • 59$250 to $299
  • 35$300 to $349
  • 18$350 to $399
  • 18$400 to $449
  • 17$450 to $499
  • 12$500 to $549
  • 41$650 to $699
  • 5$700 to $749
  • 53$750 to $799
  • 25$800 to $899
  • 124$900 to $999
  • 443$1,000 to $1,249
  • 1,021$1,250 to $1,499
  • 2,703$1,500 to $1,999
  • 948$2,000 to $2,499
  • 332$2,500 to $2,999
  • 287$3,000 to $3,499
  • 31$3,500 or more
  • 26No cash rent
Time Leaving Home To Go To Work in 2022

Percentage of workers working in this county: 97.9%
Number of people working at home: 1,298 (9.7% of all workers)

Travel time (in minutes) to work in 2022

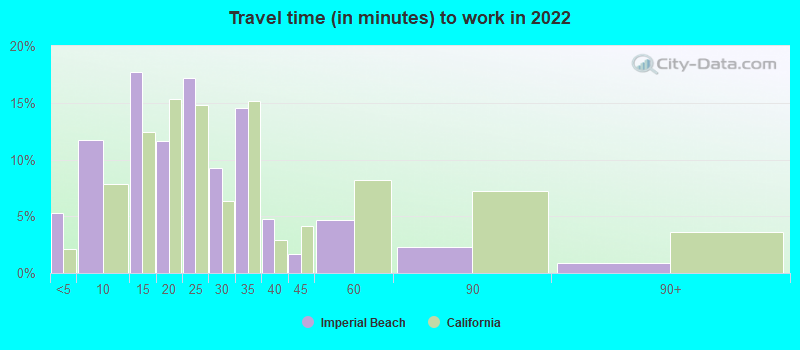
Travel time to work (commute)

  • Less than 5 minutes: 308
  • 5 to 9 minutes: 750
  • 10 to 14 minutes: 937
  • 15 to 19 minutes: 1,926
  • 20 to 24 minutes: 2,114
  • 25 to 29 minutes: 1,096
  • 30 to 34 minutes: 1,979
  • 35 to 39 minutes: 296
  • 40 to 44 minutes: 838
  • 45 to 59 minutes: 675
  • 60 to 89 minutes: 639
  • 90 or more minutes: 224
Means of transportation to work in 2022 - Imperial Beach

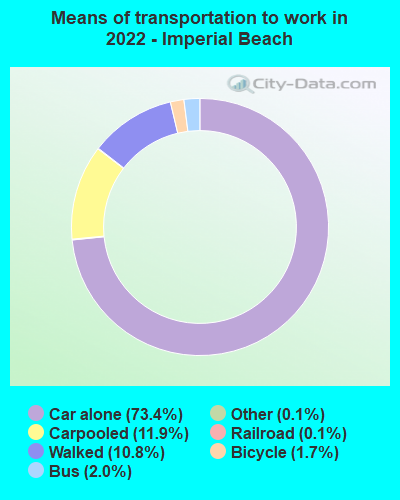
Means of transportation to work:

  • Drove a car alone: 2,927 (55.9%)
  • Carpooled: 496 (9.5%)
  • Bus: 72 (1.4%)
  • Light rail, streetcar or trolley: 7 (0.1%)
  • Taxi: 5 (0.1%)
  • Bicycle: 74 (1.4%)
  • Walked: 475 (9.1%)
  • Worked at home: 1,298 (24.8%)
Class of Workers in 2022
  • Unemployment by race in 2022
  • Unemployment rate for White non-Hispanic residents
  • 2.8%Males
  • 5.9%Females
  • Unemployment rate for Black residents
  • 15.4%Females
  • Unemployment rate for American Indian and Alaska Native residents
  • 2.8%Females
  • Unemployment rate for Asian residents
  • 11.3%Males
  • Unemployment rate for other race residents
  • 3.6%Males
  • 2.7%Females
  • Unemployment rate for two or more race residents
  • 4.1%Males
  • 4.1%Females
  • Unemployment rate for Hispanic or Latino residents
  • 5.2%Males
  • 6.6%Females
Year of entry for the foreign-born population in Imperial Beach, California
  • Year of entry for the foreign-born population in Imperial Beach, California
  • 1,4352010 or later
  • 7482000 to 2009
  • 8211990 to 1999
  • 1,6221980 to 1989
  • 1,1861970 to 1979
  • 1,020Before 1970
Ancestries in Imperial Beach, CA

First ancestries reported:

  • American: 564 (3.5%)
  • Irish: 507 (3.1%)
  • English: 446 (2.7%)
  • German: 352 (2.2%)
  • European: 238 (1.5%)
  • Italian: 137 (0.8%)
  • French: 129 (0.8%)
  • Scottish: 120 (0.7%)
  • Arab: 102 (0.6%)
  • Polish: 93 (0.6%)
  • Dutch: 76 (0.5%)
  • French Canadian: 59 (0.4%)
  • Czech: 50 (0.3%)
  • Iranian: 48 (0.3%)
  • Scotch-Irish: 44 (0.3%)
  • Iraqi: 39 (0.2%)
  • Russian: 37 (0.2%)
  • Lithuanian: 36 (0.2%)
  • Brazilian: 33 (0.2%)
  • Welsh: 32 (0.2%)
  • Macedonian: 29 (0.2%)
  • Norwegian: 25 (0.2%)
  • Syrian: 20 (0.1%)
  • British: 19 (0.1%)
  • Canadian: 19 (0.1%)
  • Hungarian: 18 (0.1%)
  • Haitian: 17 (0.1%)
  • Swedish: 16 (0.10%)
  • Greek: 13 (0.08%)
  • Croatian: 11 (0.07%)
  • Danish: 8 (0.05%)
  • Slovak: 8 (0.05%)
  • Scandinavian: 6 (0.04%)
  • African: 5 (0.03%)
  • Northern European: 4 (0.02%)
  • Slavic: 2 (0.01%)
  • Finnish: 2 (0.01%)

Most common places of birth for foreign-born residents (%):

Mexico
Imperial Beach:

70.6% (3,145)
California:

37.2% (3,881,193)

Philippines
Imperial Beach:

14.8% (659)
California:

7.8% (818,297)

Place of birth for U.S.-born residents:

  • This state: 15,006
  • Other state: 6,047
  • Northeast: 1,332
  • Midwest: 1,639
  • South: 1,644
  • West: 1,421

86.6% of Imperial Beach residents lived in the same house 1 years ago.
   Out of people who lived in different houses, 40.2% lived in this county.
   Out of people who lived in different counties, 43.9% lived in California.


Imperial Beach:

86.6%
State average:

88.9%

Education attainment for males 25 years and older:

  • No schooling: 148
  • Nursery to 4th grade: 40
  • 5th and 6th grade: 109
  • 7th and 8th grade: 56
  • 9th grade: 100
  • 10th grade: 82
  • 11th grade: 94
  • 12th grade, no diploma: 360
  • High school graduate (or equivalency): 2,826
  • Less than 1 year of college: 799
  • Some college more than 1 year, no degree: 1,606
  • Associate degree: 606
  • Bachelor's degree: 1,241
  • Master's degree: 413
  • Professional school degree: 83
  • Doctorate degree: 39
Educational Attainment for Males

Education attainment for females 25 years and older:

  • No schooling: 167
  • Nursery to 4th grade: 71
  • 5th and 6th grade: 147
  • 7th and 8th grade: 50
  • 9th grade: 223
  • 10th grade: 31
  • 11th grade: 314
  • 12th grade, no diploma: 222
  • High school graduate (or equivalency): 2,093
  • Less than 1 year of college: 735
  • Some college more than 1 year, no degree: 1,328
  • Associate degree: 669
  • Bachelor's degree: 1,621
  • Master's degree: 484
  • Professional school degree: 41
  • Doctorate degree: 147
Educational Attainment for Females
Imperial Beach marital status for males
Imperial Beach marital status for females

Housing units in structures:

  • One, detached: 4,184
  • One, attached: 1,222
  • Two: 270
  • 3 or 4: 914
  • 5 to 9: 1,305
  • 10 to 19: 1,497
  • 20 to 49: 476
  • 50 or more: 273
  • Mobile homes: 89
  • Boats, RVs, vans, etc.: 23
Housing units lacking complete plumbing facilities in 2022: 0.4%

Housing units lacking complete kitchen facilities in 2022: 2.7%

House/condo owner moved in on average 14 years ago

Renter moved in on average 5 years ago

Year householders moved into residence in Imperial Beach
Houses and condos Apartments
Most commonly used house heating fuel in houses and condos in Imperial Beach, CA
  • 75.0%Utility gas
  • 19.9%Electricity
  • 3.0%No fuel used
  • 1.2%Bottled, tank, or LP gas
  • 0.5%Wood
  • 0.5%Solar energy
Most commonly used house heating fuel in apartments in Imperial Beach, CA
  • 59.6%Utility gas
  • 33.9%Electricity
  • 4.8%No fuel used
  • 1.4%Bottled, tank, or LP gas
  • 0.3%Wood

Private vs. public school enrollment:

Students in private schools in grades 1 to 8 (elementary and middle school): 106
Here:

4.4%
California:

10.5%

Students in private schools in grades 9 to 12 (high school): 99
Here:

6.0%
California:

8.5%

Students in private undergraduate colleges: 280
Here:

17.6%
California:

15.9%
School Enrollment by Level of School for Male Students
School Enrollment by Level of School for Female Students
Age and Sex of Sensory-Disabled Noninstitutionalized Residents
Age and Sex of Physically-Disabled Noninstitutionalized Residents
Age and Sex of Mentally-Disabled Noninstitutionalized Residents
Age and Sex of Self-Care Disabled Noninstitutionalized Residents
Age and Sex of Go-Outside-Home Disabled Noninstitutionalized Residents
Age and Sex of Noninstitutionalized Residents with Employment Disability