Inverness, CA (California) Houses and Residents
| Inverness: | $1,677,654 |
| California: | $715,900 |
Mean price in 2022:
Detached houses: $1,549,445
Here: $1,549,445 State: $988,808
Total population: 1,304 (Urban population: 0, Rural population: 1,422 (all nonfarm))
Houses: 1,269 (859 occupied: 695 owner occupied, 158 renter occupied)
| % of renters here: | 19% |
| State: | 44% |
Housing density: 212 houses/condos per square mile
Median price asked for vacant for-sale houses and condos in 2022 in this county: $3,364,178.
Median contract rent in 2022: $1,573 (lower quartile is $1,112, upper quartile is over $2,000)
Median rent asked for vacant for-rent units in 2022: $4,281
Median gross rent in Inverness, CA in 2022: $1,721
Housing units in Inverness with a mortgage: 223 (54 second mortgage, 0 home equity loan, 40 both second mortgage and home equity loan)
Houses without a mortgage: 0
Median household income for houses/condos with a mortgage: $157,466
Median household income for apartments without a mortgage: $84,394
Median monthly housing costs: $1,477
Compare current foreclosures near Inverness, CA:
| Photo | Address | Area | Beds / Baths | Price | Details |
|---|---|---|---|---|---|

|
#1
Drakes Beach Rd
Inverness, CA 94937
|
1,652 sq. feet
|
2 baths 2 beds |
show details | |

|
#2
Petaluma Blvd S Apt 28
Petaluma, CA 94952
|
565 sq. feet
|
1 baths 1 beds |
$359,900
|
show details |

|
#3
Jewett Rd
Petaluma, CA 94952
|
1,600 sq. feet
|
2 baths 4 beds |
show details | |

|
#4
Harris Hill Dr
Novato, CA 94947
|
2,773 sq. feet
|
3 baths 4 beds |
show details | |

|
#5
Ivy Lane
Woodacre, CA 94973
|
2,251 sq. feet
|
2 baths 3 beds |
show details | |

|
#6
Sir Francis Drake Blvd
San Anselmo, CA 94960
|
1,936 sq. feet
|
3 baths 3 beds |
show details | |

|
#7
Birchwood Ct
San Rafael, CA 94903
|
1,894 sq. feet
|
3 baths 5 beds |
show details | |

|
#8
Newcastle Ct
Petaluma, CA 94954
|
1,872 sq. feet
|
3 baths 4 beds |
show details | |

|
#9
Patricia Way
San Rafael, CA 94903
|
2,709 sq. feet
|
2 baths 5 beds |
show details | |

|
#10
Andover Way
Petaluma, CA 94954
|
2,538 sq. feet
|
4 baths 5 beds |
show details |
| Photo | Address | Area | Beds / Baths | Price | Details |
|---|---|---|---|---|---|

|
#11
Wintergreen Ct
Novato, CA 94945
|
1,612 sq. feet
|
2 baths 3 beds |
show details | |

|
#12
Manchester Ct
Novato, CA 94947
|
1,344 sq. feet
|
1 baths 3 beds |
show details | |

|
#13
Meernaa Ave
Fairfax, CA 94930
|
1,489 sq. feet
|
2 baths 3 beds |
show details | |

|
#14
Woodside Ct
San Anselmo, CA 94960
|
3,403 sq. feet
|
3 baths 4 beds |
show details | |

|
#15
Woodside Ct
San Anselmo, CA 94960
|
3,403 sq. feet
|
3 baths 4 beds |
show details | |

|
#16
Nottingham Ct
Petaluma, CA 94954
|
2,815 sq. feet
|
4 baths 4 beds |
show details | |

|
#17
Marin Oaks Dr
Novato, CA 94949
|
2,370 sq. feet
|
2 baths 5 beds |
show details | |

|
#18
Piper Ln
Fairfax, CA 94930
|
1,976 sq. feet
|
2 baths 4 beds |
show details | |

|
#19
Del Sol Way
Petaluma, CA 94954
|
1,409 sq. feet
|
2 baths 3 beds |
show details | |

|
#20
Glen Eagle Dr
Petaluma, CA 94952
|
6,762 sq. feet
|
3 baths 3 beds |
show details |
| Photo | Address | Area | Beds / Baths | Price | Details |
|---|---|---|---|---|---|

|
#21
Del Oro Cir
Petaluma, CA 94954
|
1,388 sq. feet
|
2 baths 3 beds |
show details | |

|
#22
Red Cedar Ct
San Rafael, CA 94903
|
1,945 sq. feet
|
3 baths 3 beds |
show details | |

|
#23
Savanna Ct
Novato, CA 94947
|
3,700 sq. feet
|
3 baths 4 beds |
show details | |

|
#24
Center Rd
Novato, CA 94947
|
1,318 sq. feet
|
2 baths 4 beds |
show details | |

|
#25
Rowland Blvd
Novato, CA 94947
|
3,732 sq. feet
|
3 baths 4 beds |
show details | |

|
#26
Wilson Ave
Novato, CA 94947
|
4,170 sq. feet
|
3 baths 5 beds |
show details | |

|
#27
San Luis Way
Novato, CA 94945
|
1,792 sq. feet
|
2 baths 3 beds |
show details | |

|
#28
Lavender Ter
Petaluma, CA 94952
|
2,618 sq. feet
|
3 baths 5 beds |
show details | |

|
#29
Woodside Cir
Petaluma, CA 94954
|
- sq. feet
|
- baths - beds |
show details | |

|
#30
Sir Francis Drake Blvd
San Geronimo, CA 94963
|
- sq. feet
|
- baths - beds |
show details |
| Photo | Address | Area | Beds / Baths | Price | Details |
|---|---|---|---|---|---|

|
#31
Elm Ave
San Anselmo, CA 94960
|
- sq. feet
|
- baths - beds |
show details | |

|
#32
Vineyard Rd
Novato, CA 94947
|
- sq. feet
|
- baths - beds |
show details | |

|
#33
Sir Francis Drake Blvd
Fairfax, CA 94930
|
- sq. feet
|
- baths - beds |
show details | |

|
#34
Tamalpais Ave # 9
Novato, CA 94947
|
- sq. feet
|
- baths - beds |
show details | |

|
#35
Meernaa Ave # B
Fairfax, CA 94930
|
- sq. feet
|
- baths - beds |
show details | |

|
#36
Redwood Blvd Ste 300
Novato, CA 94945
|
- sq. feet
|
- baths - beds |
show details | |

|
#37
1st St Apt 331
Petaluma, CA 94952
|
- sq. feet
|
- baths - beds |
show details | |

|
#38
Prospect St
Petaluma, CA 94952
|
- sq. feet
|
- baths - beds |
show details | |

|
#39
Dynamic St
Petaluma, CA 94954
|
- sq. feet
|
- baths - beds |
show details | |

|
#40
Commerce St Ste D
Petaluma, CA 94954
|
- sq. feet
|
- baths - beds |
show details |
| Photo | Address | Area | Beds / Baths | Price | Details |
|---|---|---|---|---|---|

|
#41
Ignacio Blvd Apt 21
Novato, CA 94949
|
- sq. feet
|
- baths - beds |
show details | |

|
#42
Lynwood Dr
Novato, CA 94947
|
- sq. feet
|
- baths - beds |
show details | |

|
#43
Armstrong Ave Unit 40
Novato, CA 94945
|
- sq. feet
|
- baths - beds |
show details | |

|
#44
Bernice Ct
Petaluma, CA 94952
|
- sq. feet
|
- baths - beds |
show details | |

|
#45
Edith St
Petaluma, CA 94952
|
- sq. feet
|
- baths - beds |
show details | |

|
#46
Ruth Ct
Petaluma, CA 94952
|
- sq. feet
|
- baths - beds |
show details | |

|
#47
Park Ave
Dillon Beach, CA 94929
|
- sq. feet
|
- baths - beds |
show details | |

|
#48
Armstrong Ave
Novato, CA 94945
|
- sq. feet
|
- baths - beds |
show details | |

|
#49
Sir Francis Drake Blvd
Forest Knolls, CA 94933
|
- sq. feet
|
- baths - beds |
show details | |

|
Check over 1 million property listings on Foreclosure.com!
|
browse all offers | |||

Latest news about housing in Inverness, CA collected exclusively by city-data.com from local newspapers, TV, and radio stations

 | Prop 13 (megatopic) (1358 replies) |
| Want to take a 2-week solo trip to California (22 replies) |
| Moved to the Bay for 1 year from out of state, moved back. My review of it. (342 replies) |
| North Bay, South Bay, East Bay? (35 replies) |
| Which city has these 10 criteria?? (72 replies) |
| CA-1 coastal highway (60 replies) |

Median year apartment built: 1978
Household type by relationship:
Households: 1,443- Male householders: 369 (178 living alone), Female householders: 472 (301 living alone)
279 spouses (279 opposite-sex spouses), 50 unmarried partners, (16 opposite-sex unmarried partners), 167 children (167 natural, 0 adopted, 0 stepchildren), 20 grandchildren, 17 brothers or sisters, 24 parents, 0 foster children, 22 other relatives, 19 non-relatives
Size of family households: 223 2-persons, 19 3-persons, 69 4-persons.
Size of nonfamily households: 521 1-person, 37 2-persons.
17 married couples with children.
0 single-parent households (0 men, 0 women).
96.4% of residents of Inverness speak English at home.
4.8% of residents speak Spanish at home (100% speak English very well).
Foreign born population: 114 (7.9%)
(27.2% of them are naturalized citizens)
| Here: | 4.9 |
| State: | 6.0 |
| Here: | 2.7 |
| State: | 3.9 |

- Bedrooms in owner-occupied houses and condos in Inverness, California
- 16no bedroom
- 1221 bedroom
- 2722 bedrooms
- 1883 bedrooms
- 424 bedrooms
- 555+ bedrooms

- Bedrooms in renter-occupied apartments in Inverness, California
- 66no bedroom
- 321 bedroom
- 422 bedrooms
- 193 bedrooms
- 04 bedrooms
- 05+ bedrooms

- Cars and other vehicles available in Inverness in owner-occupied houses/condos
- 0no vehicle
- 2691 vehicle
- 2842 vehicles
- 703 vehicles
- 494 vehicles
- 245+ vehicles

- Cars and other vehicles available in Inverness in renter-occupied apartments
- 30no vehicle
- 911 vehicle
- 302 vehicles
- 83 vehicles
- 04 vehicles
- 05+ vehicles

- Rooms in owner-occupied houses in Inverness, California
- 161 room
- 1022 rooms
- 703 rooms
- 1254 rooms
- 995 rooms
- 686 rooms
- 667 rooms
- 988 rooms
- 539+ rooms

- Rooms in renter-occupied apartments in Inverness, California
- 661 room
- 02 rooms
- 323 rooms
- 164 rooms
- 265 rooms
- 06 rooms
- 197 rooms
- 08 rooms
- 09+ rooms


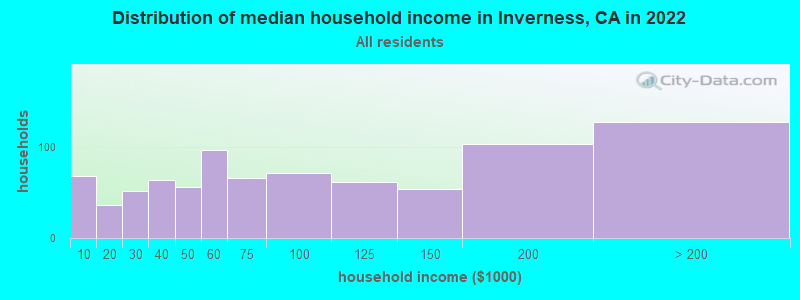
Inverness, CA household income distribution

- 68Less than $10,000
- 36$10,000 to $19,999
- 52$20,000 to $29,999
- 64$30,000 to $39,999
- 56$40,000 to $49,999
- 96$50,000 to $59,999
- 66$60,000 to $74,999
- 71$75,000 to $99,999
- 61$100,000 to $124,999
- 54$125,000 to $149,999
- 103$150,000 to $199,999
- 127$200,000 or more
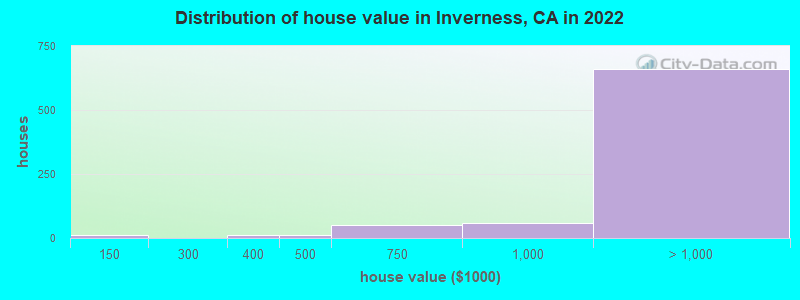
Home value of owner - occupied houses in 2022 in Inverness, CA
-
- 12$125,000 to $149,999
- 12$300,000 to $399,999
- 12$400,000 to $499,999
- 51$500,000 to $749,999
- 59$750,000 to $999,999
- 224$1,000,000 to $1,499,999
- 184$1,500,000 to $1,999,999
- 251$2,000,000 or more
Rent paid by renters in 2022 in Inverness, CA
-
- 39$500 to $549
- 22$1,000 to $1,249
- 17$1,250 to $1,499
- 63$1,500 to $1,999
- 37$3,500 or more

Percentage of workers working in this county: 96.2%
Number of people working at home: 329 (52.3% of all workers)
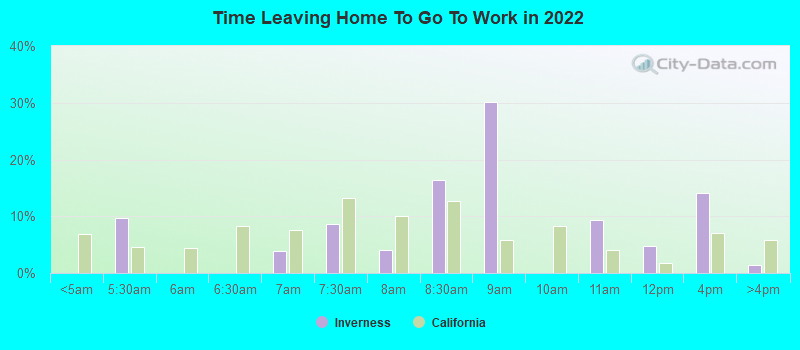
Travel time to work (commute)
- Less than 5 minutes: 28
- 5 to 9 minutes: 41
- 10 to 14 minutes: 36
- 15 to 19 minutes: 71
- 20 to 24 minutes: 0
- 25 to 29 minutes: 15
- 30 to 34 minutes: 0
- 35 to 39 minutes: 0
- 40 to 44 minutes: 38
- 45 to 59 minutes: 25
- 60 to 89 minutes: 66
- 90 or more minutes: 18
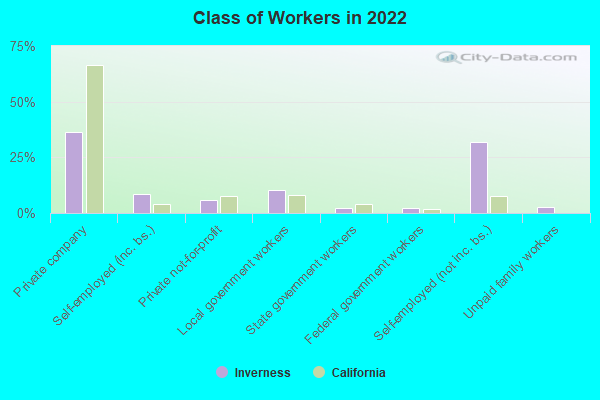
Means of transportation to work:
- Drove a car alone: 432 (59.0%)
- Carpooled: 100 (13.7%)
- Bus or trolley bus: 14 (1.9%)
- Ferryboat: 14 (1.9%)
- Walked: 65 (8.9%)
- Other means: 10 (1.4%)
- Worked at home: 97 (13.3%)
- Unemployment by race in 2022
- Unemployment rate for White non-Hispanic residents
- 6.3%Males
- 10.2%Females
- Unemployment rate for two or more race residents
- 100.0%Males
- Unemployment rate for Hispanic or Latino residents
- 73.0%Males

- Year of entry for the foreign-born population in Inverness, California
- 442010 or later
- 02000 to 2009
- 301990 to 1999
- 01980 to 1989
- 191970 to 1979
- 37Before 1970
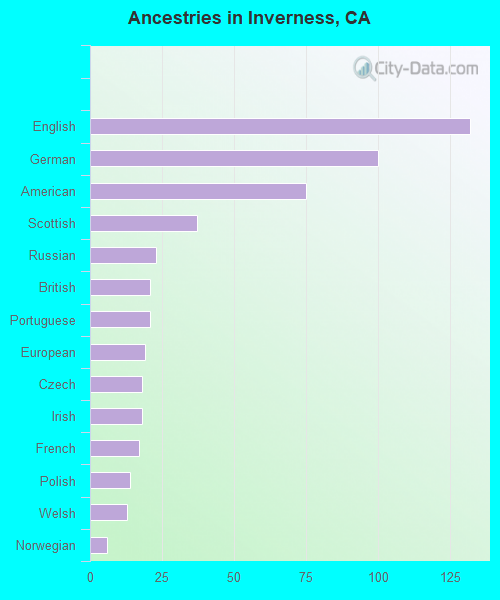
First ancestries reported:
- English: 132 (23.8%)
- German: 100 (18.0%)
- American: 75 (13.5%)
- Scottish: 37 (6.7%)
- Russian: 23 (4.1%)
- British: 21 (3.8%)
- Portuguese: 21 (3.8%)
- European: 19 (3.4%)
- Czech: 18 (3.2%)
- Irish: 18 (3.2%)
- French: 17 (3.1%)
- Polish: 14 (2.5%)
- Welsh: 13 (2.3%)
- Norwegian: 6 (1.1%)
Most common places of birth for foreign-born residents (%):
| Inverness: | 27.8% (32) |
| California: | 0.2% (16,042) |
| Inverness: | 26.1% (30) |
| California: | 0.6% (57,953) |
| Inverness: | 15.7% (18) |
| California: | 0.0% (1,613) |
| Inverness: | 14.8% (17) |
| California: | 0.7% (74,025) |
| Inverness: | 12.2% (14) |
| California: | 0.2% (20,614) |
Place of birth for U.S.-born residents:
- This state: 812
- Other state: 512
- Northeast: 271
- Midwest: 163
- South: 42
- West: 29
92.5% of Inverness residents lived in the same house 1 years ago.
Out of people who lived in different houses, 16.3% lived in this county.
Out of people who lived in different counties, 38.5% lived in California.
| Inverness: | 92.5% |
| State average: | 88.9% |
Education attainment for males 25 years and older:
- No schooling: 0
- Nursery to 4th grade: 0
- 5th and 6th grade: 21
- 7th and 8th grade: 0
- 9th grade: 0
- 10th grade: 0
- 11th grade: 0
- 12th grade, no diploma: 13
- High school graduate (or equivalency): 14
- Less than 1 year of college: 68
- Some college more than 1 year, no degree: 114
- Associate degree: 0
- Bachelor's degree: 208
- Master's degree: 43
- Professional school degree: 31
- Doctorate degree: 70

Education attainment for females 25 years and older:
- No schooling: 0
- Nursery to 4th grade: 0
- 5th and 6th grade: 0
- 7th and 8th grade: 0
- 9th grade: 0
- 10th grade: 19
- 11th grade: 0
- 12th grade, no diploma: 18
- High school graduate (or equivalency): 49
- Less than 1 year of college: 0
- Some college more than 1 year, no degree: 24
- Associate degree: 93
- Bachelor's degree: 298
- Master's degree: 188
- Professional school degree: 78
- Doctorate degree: 34


Housing units in structures:
- One, detached: 1,163
- One, attached: 39
- Two: 25
- 3 or 4: 11
- Mobile homes: 30
Housing units lacking complete kitchen facilities in 2022: 5.0%
House/condo owner moved in on average 21 years ago
Renter moved in on average 7 years ago

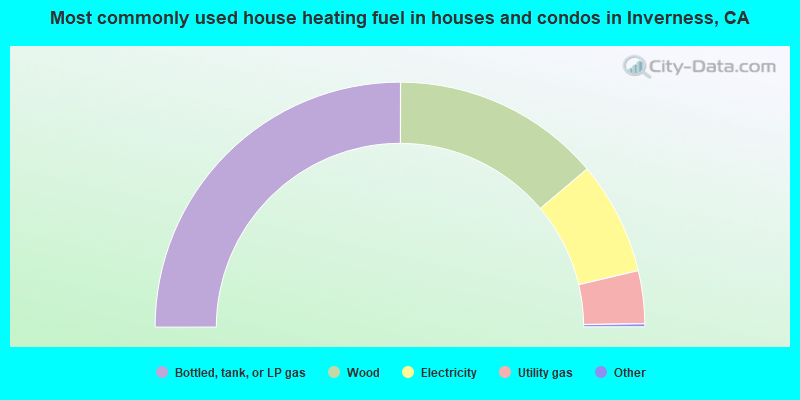
- 50.3%Bottled, tank, or LP gas
- 27.7%Wood
- 15.0%Electricity
- 7.0%Utility gas
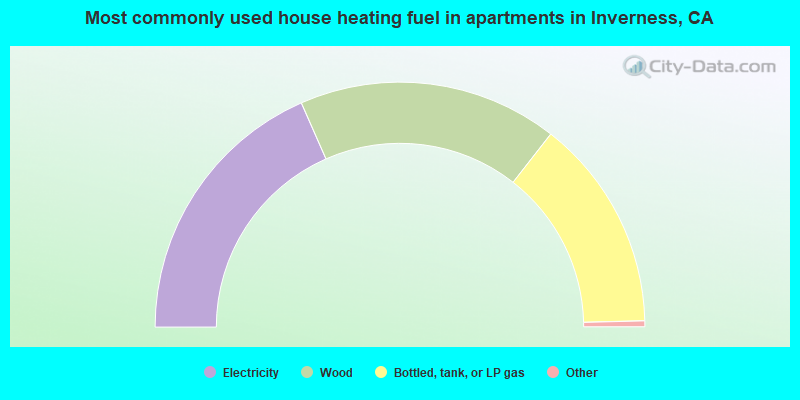
- 37.1%Electricity
- 34.6%Wood
- 28.3%Bottled, tank, or LP gas
Private vs. public school enrollment:
| Here: | 0.0% |
| California: | 10.5% |


