Jensen Beach, FL (Florida) Houses and Residents
Estimated median house or condo value in 2022: $384,115 (it was $85,200 in 2000 )
Jensen Beach:
$384,115Florida:
$354,100
Lower value quartile - upper value quartile: $253,800 - $543,898Mean price in 2022: Detached houses: $490,176 Here:
$490,176State:
$500,941
Townhouses or other attached units: $348,824 Here:
$348,824State:
$370,869
In 3-to-4-unit structures: $262,610 Here:
$262,610State:
$309,944
In 5-or-more-unit structures: $167,688 Here:
$167,688State:
$447,145
Mobile homes: $89,647 Here:
$89,647State:
$113,202
Total population: 11,707 (Urban population: 11,103, Rural population: 0)
Houses: 7,294 (5,971 occupied: 4,256 owner occupied, 1,632 renter occupied )
% of renters here:
28%State:
33%
Housing density: 1,007 houses/condos per square mile
Median price asked for vacant for-sale houses and condos in 2022: $385,775.
Median contract rent in 2022: $1,393 (lower quartile is $980, upper quartile is $1,965)
Median rent asked for vacant for-rent units in 2022: $1,868
Median gross rent in Jensen Beach, FL in 2022: $1,440
Housing units in Jensen Beach with a mortgage: 2,153 (151 second mortgage, 0 home equity loan, 175 both second mortgage and home equity loan )Houses without a mortgage: 113
Median household income for houses/condos with a mortgage: $104,093
Median household income for apartments without a mortgage: $57,557
Median monthly housing costs: $1,111
Data:
Median house or condo value ($)
Median house or condo value ($ change since 2000)
Median house or condo value ($) - White
Median house or condo value ($) - Black or African American
Median house or condo value ($) - Asian
Median house or condo value ($) - Hispanic or Latino
Median house or condo value ($) - American Indian and Alaska Native
Median house or condo value ($) - Multirace
Median house or condo value ($) - Other Race
Median price asked for mobile homes ($)
Household density (households per square mile)
Mean house or condo value by units in structure - 1, detached ($)
Mean house or condo value by units in structure - 1, attached ($)
Mean house or condo value by units in structure - 2 ($)
Mean house or condo value by units in structure by units in structure - 3 or 4 ($)
Mean house or condo value by units in structure - 5 or more ($)
Mean house or condo value by units in structure - Boat, RV, van, etc. ($)
Mean house or condo value by units in structure - Mobile home ($)
Median contract rent ($)
Median contract rent - Lower quartile ($)
Median contract rent - Upper quartile ($)
Median gross rent ($)
Urban houses (%)
Rural houses (%)
Houses occupied (%)
Houses occupied (% change since 2000)
Houses owner occupied (%)
Houses owner occupied (% change since 2000)
Houses renter occupied (%)
Houses renter occupied (% change since 2000)
Vacant housing units - For rent (%)
Vacant housing units - For rent (% change since 2000)
Vacant housing units - For sale only (%)
Vacant housing units - For sale only (% change since 2000)
Vacant housing units - Rented or sold, not occupied (%)
Vacant housing units - Rented or sold, not occupied (% change since 2000)
Vacant housing units - For seasonal, recreational, or occasional use (%)
Vacant housing units - For seasonal, recreational, or occasional use (% change since 2000)
Vacant housing units - For migrant workers (%)
Vacant housing units - For migrant workers (% change since 2000)
Vacant housing units - Other vacant (%)
Vacant housing units - Other vacant (% change since 2000)
Median monthly housing costs ($)
Median household income for houses/condos with a mortgage ($)
Median household income for houses/condos without a mortgage ($)
Median household income ($)
Median household income ($) - White
Median household income ($) - Black or African American
Median household income ($) - Asian
Median household income ($) - Hispanic or Latino
Median household income ($) - American Indian and Alaska Native
Median household income ($) - Multirace
Median household income ($) - Other Race
Mortgage status - with mortgage (%)
Mortgage status - with second mortgage (%)
Mortgage status - with home equity loan (%)
Mortgage status - with both second mortgage and home equity loan (%)
Mortgage status - without a mortgage (%)
Median year house/condo built
Median year apartment built
Household type by relationship - Male householder living alone (%)
Household type by relationship - Male householder not living alone (%)
Household type by relationship - Female householder living alone (%)
Household type by relationship - Female householder not living alone (%)
Household type by relationship - Opposite-Sex spouse (%)
Household type by relationship - Same-Sex spouse (%)
Household type by relationship - Opposite-Sex unmarried partner (%)
Household type by relationship - Same-Sex unmarried partner (%)
Household type by relationship - In group quarters (%)
Size of family households - 2-person household (%)
Size of family households - 3-person household (%)
Size of family households - 4-person household (%)
Size of family households - 5-person household (%)
Size of family households - 6-person household (%)
Size of family households - 7-or-more-person household (%)
Size of nonfamily households - 1-person household (%)
Size of nonfamily households - 2-person household (%)
Size of nonfamily households - 3-person household (%)
Size of nonfamily households - 4-person household (%)
Size of nonfamily households - 5-person household (%)
Size of nonfamily households - 6-person household (%)
Size of nonfamily households - 7-or-moreperson household (%)
Year house built - Built 2010 or later (%)
Year house built - Built 2000 to 2009 (%)
Year house built - Built 1990 to 1999 (%)
Year house built - Built 1980 to 1989 (%)
Year house built - Built 1970 to 1979 (%)
Year house built - Built 1960 to 1969 (%)
Year house built - Built 1950 to 1959 (%)
Year house built - Built 1940 to 1949 (%)
Year house built - Built 1939 or earlier (%)
Median number of rooms in houses and condos
Median number of rooms in apartments
Median number of bedrooms in owner occupied houses
Mean number of bedrooms in owner occupied houses
Median number of bedrooms in renter occupied houses
Mean number of bedrooms in renter occupied houses
Median number of vehichles in owner occupied houses
Mean number of vehichles in owner occupied houses
Median number of vehichles in renter occupied houses
Mean number of vehichles in renter occupied houses
Rooms in owner-occupied houses - 1 room (%)
Rooms in owner-occupied houses - 2 rooms (%)
Rooms in owner-occupied houses - 3 rooms (%)
Rooms in owner-occupied houses - 4 rooms (%)
Rooms in owner-occupied houses - 5 rooms (%)
Rooms in owner-occupied houses - 6 rooms (%)
Rooms in owner-occupied houses - 7 rooms (%)
Rooms in owner-occupied houses - 8 rooms (%)
Rooms in owner-occupied houses - 9+ rooms (%)
Rooms in renter-occupied houses - 1 room (%)
Rooms in renter-occupied houses - 2 rooms (%)
Rooms in renter-occupied houses - 3 rooms (%)
Rooms in renter-occupied houses - 4 rooms (%)
Rooms in renter-occupied houses - 5 rooms (%)
Rooms in renter-occupied houses - 6 rooms (%)
Rooms in renter-occupied houses - 7 rooms (%)
Rooms in renter-occupied houses - 8 rooms (%)
Rooms in renter-occupied houses - 9+ rooms (%)
Bedrooms in owner-occupied houses - no bedrooms (%)
Bedrooms in owner-occupied houses - 1 bedroom (%)
Bedrooms in owner-occupied houses - 2 bedrooms (%)
Bedrooms in owner-occupied houses - 3 bedrooms (%)
Bedrooms in owner-occupied houses - 4 bedrooms (%)
Bedrooms in owner-occupied houses - 5+ bedrooms (%)
Bedrooms in renter-occupied houses - no bedrooms (%)
Bedrooms in renter-occupied houses - 1 bedroom (%)
Bedrooms in renter-occupied houses - 2 bedrooms (%)
Bedrooms in renter-occupied houses - 3 bedrooms (%)
Bedrooms in renter-occupied houses - 4 bedrooms (%)
Bedrooms in renter-occupied houses - 5+ bedrooms (%)
Vehicles available in owner-occupied houses - no vehicle available (%)
Vehicles available in owner-occupied houses - 1 vehicle available(%)
Vehicles available in owner-occupied houses - 2 Vehicles available (%)
Vehicles available in owner-occupied houses - 3 Vehicles available (%)
Vehicles available in owner-occupied houses - 4 Vehicles available (%)
Vehicles available in owner-occupied houses - 5+ Vehicles available (%)
Vehicles available in renter-occupied houses - no vehicle available (%)
Vehicles available in renter-occupied houses - 1 vehicle available (%)
Vehicles available in renter-occupied houses - 2 Vehicles available (%)
Vehicles available in renter-occupied houses - 3 Vehicles available (%)
Vehicles available in renter-occupied houses - 4 Vehicles available (%)
Vehicles available in renter-occupied houses - 5+ Vehicles available (%)
Housing units in structures - 1, detached (%)
Housing units in structures - 1, attached (%)
Housing units in structures - 2 (%)
Housing units in structures - 3 or 4 (%)
Housing units in structures - 5 to 9 (%)
Housing units in structures - 10 to 19 (%)
Housing units in structures - 20 to 49 (%)
Housing units in structures - 50 or more (%)
Housing units in structures - Mobile home (%)
Housing units in structures - Boat, RV, van, etc. (%)
Housing units in structures - Owners - 1, detached (%)
Housing units in structures - Owners - 1, attached (%)
Housing units in structures - Owners - 2 (%)
Housing units in structures - Owners - 3 or 4 (%)
Housing units in structures - Owners - 5 to 9 (%)
Housing units in structures - Owners - 10 to 19 (%)
Housing units in structures - Owners - 20 to 49 (%)
Housing units in structures - Owners - 50 or more (%)
Housing units in structures - Owners - Mobile home (%)
Housing units in structures - Owners - Boat, RV, van, etc. (%)
Housing units in structures - Renters - 1, detached (%)
Housing units in structures - Renters - 1, attached (%)
Housing units in structures - Renters - 2 (%)
Housing units in structures - Renters - 3 or 4 (%)
Housing units in structures - Renters - 5 to 9 (%)
Housing units in structures - Renters - 10 to 19 (%)
Housing units in structures - Renters - 20 to 49 (%)
Housing units in structures - Renters - 50 or more (%)
Housing units in structures - Renters - Mobile home (%)
Housing units in structures - Renters - Boat, RV, van, etc. (%)
House/condo owner moved in on average (years ago)
Renter moved in on average (years ago)
Year householder moved into unit - Moved in 1999 to March 2000 (%)
Year householder moved into unit - Moved in 1999 to March 2000 (%) - White
Year householder moved into unit - Moved in 1999 to March 2000 (%) - Black or African American
Year householder moved into unit - Moved in 1999 to March 2000 (%) - Asian
Year householder moved into unit - Moved in 1999 to March 2000 (%) - Hispanic or Latino
Year householder moved into unit - Moved in 1999 to March 2000 (%) - American Indian and Alaska Native
Year householder moved into unit - Moved in 1999 to March 2000 (%) - Multirace
Year householder moved into unit - Moved in 1999 to March 2000 (%) - Other Race
Year householder moved into unit - Moved in 1995 to 1998 (%)
Year householder moved into unit - Moved in 1995 to 1998 (%) - White
Year householder moved into unit - Moved in 1995 to 1998 (%) - Black or African American
Year householder moved into unit - Moved in 1995 to 1998 (%) - Asian
Year householder moved into unit - Moved in 1995 to 1998 (%) - Hispanic or Latino
Year householder moved into unit - Moved in 1995 to 1998 (%) - American Indian and Alaska Native
Year householder moved into unit - Moved in 1995 to 1998 (%) - Multirace
Year householder moved into unit - Moved in 1995 to 1998 (%) - Other Race
Year householder moved into unit - Moved in 1990 to 1994 (%)
Year householder moved into unit - Moved in 1990 to 1994 (%) - White
Year householder moved into unit - Moved in 1990 to 1994 (%) - Black or African American
Year householder moved into unit - Moved in 1990 to 1994 (%) - Asian
Year householder moved into unit - Moved in 1990 to 1994 (%) - Hispanic or Latino
Year householder moved into unit - Moved in 1990 to 1994 (%) - American Indian and Alaska Native
Year householder moved into unit - Moved in 1990 to 1994 (%) - Multirace
Year householder moved into unit - Moved in 1990 to 1994 (%) - Other Race
Year householder moved into unit - Moved in 1980 to 1989 (%)
Year householder moved into unit - Moved in 1980 to 1989 (%) - White
Year householder moved into unit - Moved in 1980 to 1989 (%) - Black or African American
Year householder moved into unit - Moved in 1980 to 1989 (%) - Asian
Year householder moved into unit - Moved in 1980 to 1989 (%) - Hispanic or Latino
Year householder moved into unit - Moved in 1980 to 1989 (%) - American Indian and Alaska Native
Year householder moved into unit - Moved in 1980 to 1989 (%) - Multirace
Year householder moved into unit - Moved in 1980 to 1989 (%) - Other Race
Year householder moved into unit - Moved in 1970 to 1979 (%)
Year householder moved into unit - Moved in 1970 to 1979 (%) - White
Year householder moved into unit - Moved in 1970 to 1979 (%) - Black or African American
Year householder moved into unit - Moved in 1970 to 1979 (%) - Asian
Year householder moved into unit - Moved in 1970 to 1979 (%) - Hispanic or Latino
Year householder moved into unit - Moved in 1970 to 1979 (%) - American Indian and Alaska Native
Year householder moved into unit - Moved in 1970 to 1979 (%) - Multirace
Year householder moved into unit - Moved in 1970 to 1979 (%) - Other Race
Year householder moved into unit - Moved in 1969 or earlier (%)
Year householder moved into unit - Moved in 1969 or earlier (%) - White
Year householder moved into unit - Moved in 1969 or earlier (%) - Black or African American
Year householder moved into unit - Moved in 1969 or earlier (%) - Asian
Year householder moved into unit - Moved in 1969 or earlier (%) - Hispanic or Latino
Year householder moved into unit - Moved in 1969 or earlier (%) - American Indian and Alaska Native
Year householder moved into unit - Moved in 1969 or earlier (%) - Multirace
Year householder moved into unit - Moved in 1969 or earlier (%) - Other Race
Housing units lacking complete plumbing facilities (%)
Housing units lacking complete kitchen facilities (%)
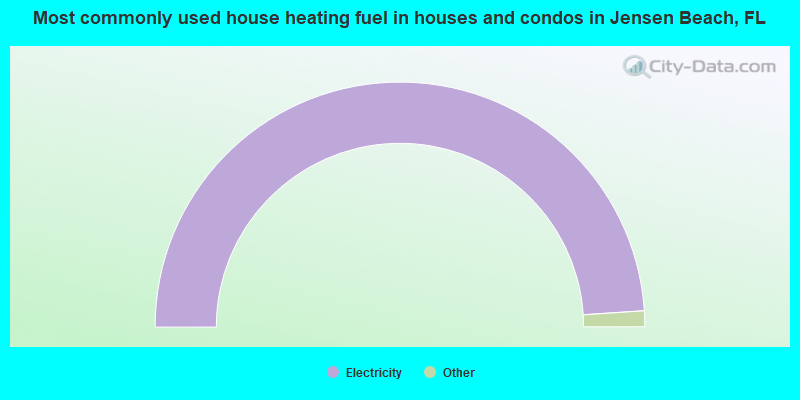
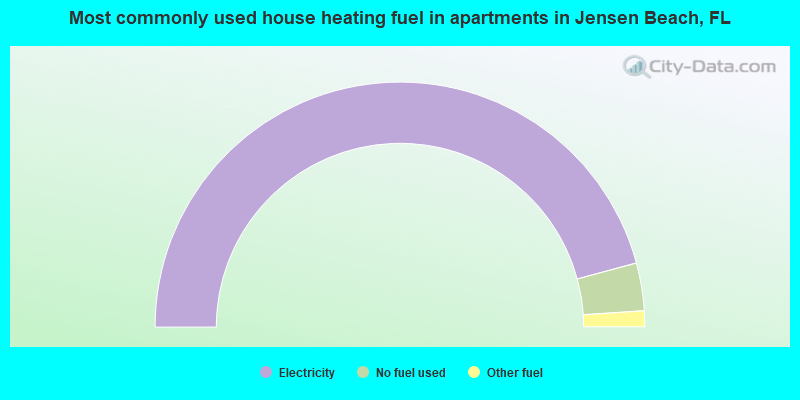
House heating fuel used in houses and condos - Utility gas (%)
House heating fuel used in houses and condos - Bottled, tank, or LP gas (%)
House heating fuel used in houses and condos - Electricity (%)
House heating fuel used in houses and condos - Fuel oil, kerosene, etc. (%)
House heating fuel used in houses and condos - Coal or coke (%)
House heating fuel used in houses and condos - Wood (%)
House heating fuel used in houses and condos - Solar energy (%)
House heating fuel used in houses and condos - Other fuel (%)
House heating fuel used in houses and condos - No fuel used (%)
House heating fuel used in apartments - Utility gas (%)
House heating fuel used in apartments - Bottled, tank, or LP gas (%)
House heating fuel used in apartments - Electricity (%)
House heating fuel used in apartments - Fuel oil, kerosene, etc. (%)
House heating fuel used in apartments - Coal or coke (%)
House heating fuel used in apartments - Wood (%)
House heating fuel used in apartments - Solar energy (%)
House heating fuel used in apartments - Other fuel (%)
House heating fuel used in apartments - No fuel used (%)
Median year house/condo built: 1984Median year apartment built: 1978Household type by relationship:
Households: 12,786
Male householders: 3,007 (1,206 living alone ), Female householders: 2,964 (1,431 living alone )2,344 spouses (2,324 opposite-sex spouses ), 358 unmarried partners , (345 opposite-sex unmarried partners ), 2,810 children (2,371 natural , 291 adopted , 147 stepchildren ), 160 grandchildren , 155 brothers or sisters , 229 parents , 0 foster children , 252 other relatives , 362 non-relatives In group quarters: 140
Size of family households: 1,765 2-persons , 639 3-persons , 374 4-persons , 108 5-persons , 20 6-persons , 32 7-or-more-persons .
Size of nonfamily households: 2,637 1-person , 214 2-persons , 40 3-persons , 54 4-persons .
1,314 married couples with children. single-parent households (48 men , 416 women ).
90.7% of residents of Jensen Beach speak English at home. of residents speak Spanish at home (35% speak English very well , 14% speak English well , 32% speak English not well , 18% don't speak English at all ).of residents speak other Indo-European language at home (93% speak English very well , 7% speak English well ).of residents speak Asian or Pacific Island language at home (100% speak English very well ).of residents speak other language at home (100% speak English very well ).
Foreign born population: 1,047 (8.2%)of them are naturalized citizens )
Median number of rooms in houses and condos:
Median number of rooms in apartments
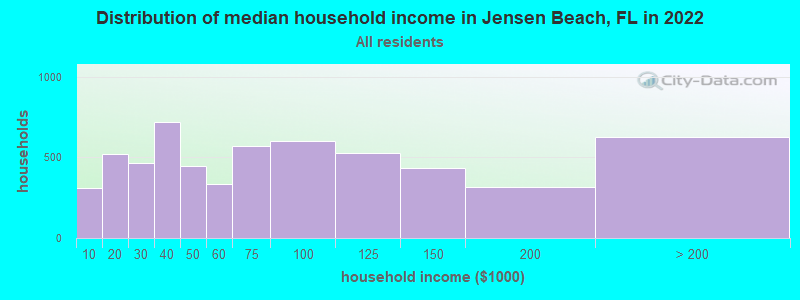
Jensen Beach, FL household income distribution 309 Less than $10,000523 $10,000 to $19,999467 $20,000 to $29,999720 $30,000 to $39,999446 $40,000 to $49,999338 $50,000 to $59,999571 $60,000 to $74,999600 $75,000 to $99,999529 $100,000 to $124,999435 $125,000 to $149,999314 $150,000 to $199,999628 $200,000 or more
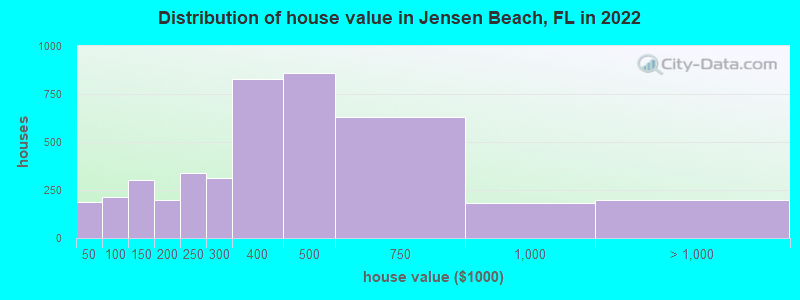
Home value of owner - occupied houses in 2022 in Jensen Beach, FL 16 $10,000 to $14,99931 $15,000 to $19,99913 $20,000 to $24,99913 $30,000 to $34,99934 $35,000 to $39,99978 $40,000 to $49,99917 $50,000 to $59,99966 $60,000 to $69,99920 $70,000 to $79,9994 $80,000 to $89,99926 $90,000 to $99,999109 $100,000 to $124,999191 $125,000 to $149,99991 $150,000 to $174,999107 $175,000 to $199,999340 $200,000 to $249,999310 $250,000 to $299,999825 $300,000 to $399,999857 $400,000 to $499,999631 $500,000 to $749,999180 $750,000 to $999,99943 $1,000,000 to $1,499,999122 $1,500,000 to $1,999,99934 $2,000,000 or moreRent paid by renters in 2022 in Jensen Beach, FL 35 $150 to $19942 $300 to $34913 $350 to $39997 $500 to $54948 $600 to $64957 $650 to $69915 $700 to $749186 $800 to $89923 $900 to $999287 $1,000 to $1,249208 $1,250 to $1,499127 $1,500 to $1,999191 $2,000 to $2,49931 $2,500 to $2,99922 $3,000 to $3,499162 $3,500 or more206 No cash rent
Percentage of workers working in this county: 74.7%Number of people working at home: 1,055 (19.3% of all workers )
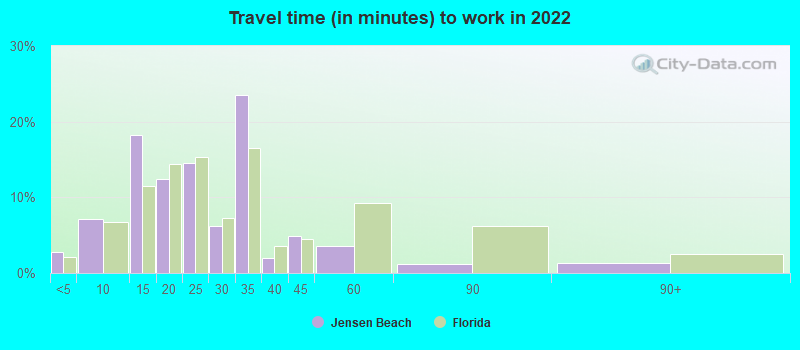
Travel time to work (commute)
Less than 5 minutes: 1305 to 9 minutes: 17710 to 14 minutes: 74015 to 19 minutes: 71820 to 24 minutes: 70025 to 29 minutes: 14930 to 34 minutes: 79035 to 39 minutes: 2740 to 44 minutes: 17545 to 59 minutes: 26860 to 89 minutes: 71090 or more minutes: 189
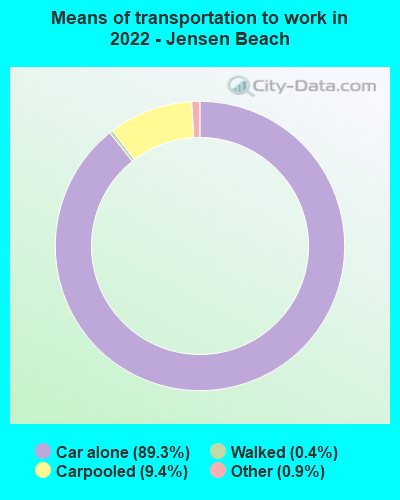
Means of transportation to work:
Drove a car alone: 3,588 (71.1%)Carpooled: 401 (8.0%)Taxi: 39 (0.8%)Walked: 18 (0.4%)Worked at home: 1,055 (20.9%)
Unemployment by race in 2022
Unemployment rate for White non-Hispanic residents 4.5% Males2.9% FemalesUnemployment rate for Black residents 35.2% Males
Year of entry for the foreign-born population in Jensen Beach, Florida
537 2010 or later 88 2000 to 2009 257 1990 to 1999 75 1980 to 1989 72 1970 to 1979 224 Before 1970
First ancestries reported:
Italian: 1,028 (19.3%)
English: 694 (13.1%)
Irish: 637 (12.0%)
American: 520 (9.8%)
German: 490 (9.2%)
Polish: 280 (5.3%)
Norwegian: 129 (2.4%)
European: 114 (2.1%)
Scotch-Irish: 101 (1.9%)
French: 100 (1.9%)
South African: 76 (1.4%)
Scottish: 71 (1.3%)
Moroccan: 43 (0.8%)
Trinidadian and Tobagonian: 43 (0.8%)
Pennsylvania German: 36 (0.7%)
Dutch: 31 (0.6%)
French Canadian: 30 (0.6%)
Slovak: 30 (0.6%)
Swedish: 28 (0.5%)
Hungarian: 27 (0.5%)
Czechoslovakian: 26 (0.5%)
Ukrainian: 24 (0.5%)
Armenian: 22 (0.4%)
Austrian: 16 (0.3%)
Lithuanian: 14 (0.3%)
Russian: 10 (0.2%)
Eastern European: 8 (0.2%)
Icelander: 8 (0.2%)
Welsh: 7 (0.1%)
British: 6 (0.1%)
Danish: 2 (0.04%)
Haitian: 1 (0.02%) Most common places of birth for foreign-born residents (%): Other South America Jensen Beach:
28.4% (317)Florida:
0.1% (6,700)
Mexico Jensen Beach:
20.1% (224)Florida:
5.6% (257,152)
Colombia Jensen Beach:
6.0% (67)Florida:
6.5% (298,669)
China, excluding Hong Kong and Taiwan Jensen Beach:
4.9% (55)Florida:
1.2% (56,071)
South Africa Jensen Beach:
4.8% (54)Florida:
0.2% (11,243)
Chile Jensen Beach:
3.9% (44)Florida:
0.5% (22,715)
Cuba Jensen Beach:
3.5% (39)Florida:
22.0% (1,006,576)
Italy Jensen Beach:
3.3% (37)Florida:
0.7% (30,755)
Morocco Jensen Beach:
3.1% (35)Florida:
0.2% (9,164)
Ecuador Jensen Beach:
3.1% (35)Florida:
1.2% (54,585)
Norway Jensen Beach:
2.5% (28)Florida:
0.0% (2,136)
Canada Jensen Beach:
2.4% (27)Florida:
2.4% (109,132)
Other Northern Europe Jensen Beach:
2.0% (22)Florida:
0.1% (3,283)
France Jensen Beach:
1.9% (21)Florida:
0.4% (20,008)
Poland Jensen Beach:
1.8% (20)Florida:
0.6% (25,219)
Place of birth for U.S.-born residents:
This state: 3,697Other state: 7,707Northeast: 4,848Midwest: 1,363South: 958West: 515 88.1% of Jensen Beach residents lived in the same house 1 years ago.
Out of people who lived in different houses, 28.4% lived in this county.
Out of people who lived in different counties, 34.1% lived in Florida.
Jensen Beach:
88.1%State average:
86.3%
Education attainment for males 25 years and older:
No schooling: 183Nursery to 4th grade: 05th and 6th grade: 07th and 8th grade: 259th grade: 710th grade: 8711th grade: 1512th grade, no diploma: 94High school graduate (or equivalency): 1,440Less than 1 year of college: 341Some college more than 1 year, no degree: 405Associate degree: 451Bachelor's degree: 1,378Master's degree: 297Professional school degree: 186Doctorate degree: 39
Education attainment for females 25 years and older:
No schooling: 104Nursery to 4th grade: 205th and 6th grade: 17th and 8th grade: 539th grade: 010th grade: 1311th grade: 9312th grade, no diploma: 69High school graduate (or equivalency): 1,117Less than 1 year of college: 383Some college more than 1 year, no degree: 637Associate degree: 579Bachelor's degree: 1,384Master's degree: 558Professional school degree: 87Doctorate degree: 65
Housing units in structures:
One, detached: 4,540One, attached: 565Two: 1073 or 4: 4485 to 9: 36110 to 19: 1720 to 49: 14650 or more: 175Mobile homes: 931Median worth of mobile homes: $87,107
Housing units lacking complete plumbing facilities in 2022: 0.2%Housing units lacking complete kitchen facilities in 2022: 2.3%House/condo owner moved in on average 9 years ago
Renter moved in on average 2 years ago
Private vs. public school enrollment:
Students in private schools in grades 1 to 8 (elementary and middle school): 339 Students in private schools in grades 9 to 12 (high school): 6 Students in private undergraduate colleges: 0