Levittown, NY (New York) Houses and Residents
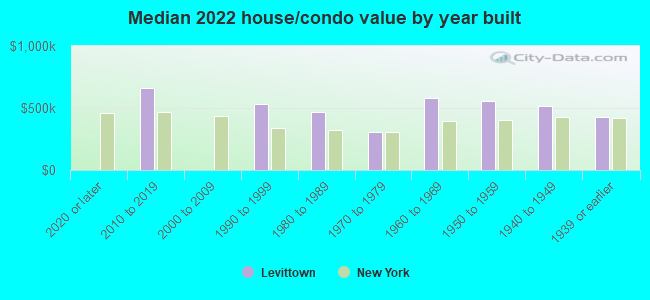
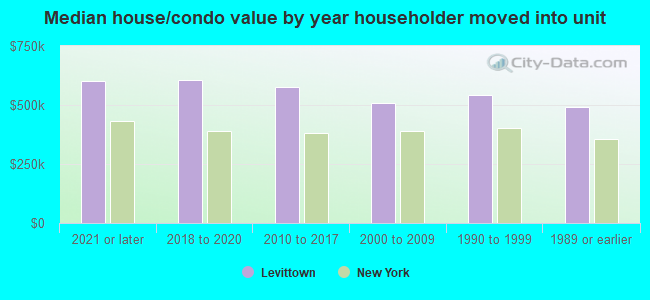
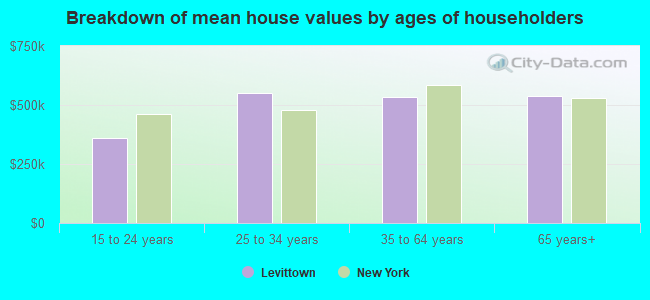
| Levittown: | $532,211 |
| New York: | $400,400 |
Total population: 51,881 (All urban)
Houses: 17,273 (16,912 occupied: 15,949 owner occupied, 934 renter occupied)
| % of renters here: | 6% |
| State: | 46% |
Housing density: 2,512 houses/condos per square mile
Median price asked for vacant for-sale houses and condos in 2022: $575,541.
Median contract rent in 2022: over $2,000 (lower quartile is $1,557, upper quartile is over $2,000)
Median rent asked for vacant for-rent units in 2022: $1,109
Median gross rent in Levittown, NY in 2022: over $2,000
Housing units in Levittown with a mortgage: 10,345 (1,314 second mortgage, 30 home equity loan, 1,138 both second mortgage and home equity loan)
Houses without a mortgage: 667
Median household income for houses/condos with a mortgage: $154,754
Median household income for apartments without a mortgage: $104,711
Median monthly housing costs: $2,488
Compare current foreclosures in Levittown, NY:
| Photo | Address | Area | Beds / Baths | Price | Details |
|---|---|---|---|---|---|

|
#1
Tarry Ln
Levittown, NY 11756
|
1,902 sq. feet
|
2 baths 5 beds |
show details | |

|
#2
Old Oak Ln
Levittown, NY 11756
|
1,050 sq. feet
|
1 baths 4 beds |
show details | |

|
#3
Bayberry Ln
Levittown, NY 11756
|
1,954 sq. feet
|
2 baths 4 beds |
show details | |

|
#4
Haven Ln
Levittown, NY 11756
|
1,818 sq. feet
|
2 baths - beds |
show details | |

|
#5
Barbara Ln
Levittown, NY 11756
|
1,667 sq. feet
|
2 baths - beds |
show details | |

|
#6
Haymaker Ln
Levittown, NY 11756
|
1,294 sq. feet
|
1 baths - beds |
show details | |

|
#7
Lark St
Levittown, NY 11756
|
1,344 sq. feet
|
2 baths - beds |
show details | |

|
#8
Periwinkle Rd
Levittown, NY 11756
|
1,305 sq. feet
|
1 baths - beds |
show details | |

|
#9
Elves Ln
Levittown, NY 11756
|
1,610 sq. feet
|
2 baths - beds |
show details | |

|
#10
Spring Ln
Levittown, NY 11756
|
1,395 sq. feet
|
2 baths - beds |
show details |
| Photo | Address | Area | Beds / Baths | Price | Details |
|---|---|---|---|---|---|

|
#11
Solar Ln
Levittown, NY 11756
|
2,185 sq. feet
|
2 baths - beds |
show details | |

|
#12
Sky Ln
Levittown, NY 11756
|
1,371 sq. feet
|
1 baths - beds |
show details | |

|
#13
Mallard Rd
Levittown, NY 11756
|
1,075 sq. feet
|
1 baths - beds |
show details | |

|
#14
Twig Ln
Levittown, NY 11756
|
1,684 sq. feet
|
2 baths - beds |
show details | |

|
#15
Anchor Ln
Levittown, NY 11756
|
1,202 sq. feet
|
1 baths - beds |
show details | |

|
#16
Family Ln
Levittown, NY 11756
|
1,467 sq. feet
|
1 baths - beds |
show details | |

|
#17
Orchid Rd
Levittown, NY 11756
|
1,114 sq. feet
|
1 baths - beds |
show details | |

|
#18
Elm Dr E
Levittown, NY 11756
|
1,400 sq. feet
|
1 baths - beds |
show details | |

|
#19
Elves Ln
Levittown, NY 11756
|
1,912 sq. feet
|
2 baths - beds |
show details | |

|
#20
Polaris Dr
Levittown, NY 11756
|
1,098 sq. feet
|
1 baths - beds |
show details |
| Photo | Address | Area | Beds / Baths | Price | Details |
|---|---|---|---|---|---|

|
#21
John Ln
Levittown, NY 11756
|
1,050 sq. feet
|
1 baths - beds |
show details | |

|
#22
Flamingo Rd
Levittown, NY 11756
|
1,098 sq. feet
|
1 baths - beds |
show details | |

|
#23
Woodpecker Ln
Levittown, NY 11756
|
1,860 sq. feet
|
1 baths - beds |
show details | |

|
#24
Harrow Ln
Levittown, NY 11756
|
2,070 sq. feet
|
1 baths - beds |
show details | |

|
#25
Rope Ln
Levittown, NY 11756
|
1,058 sq. feet
|
1 baths - beds |
show details | |

|
#26
Harrow Ln
Levittown, NY 11756
|
1,385 sq. feet
|
1 baths - beds |
show details | |

|
#27
Topper Ln
Levittown, NY 11756
|
1,366 sq. feet
|
1 baths - beds |
show details | |

|
#28
Grace Ln
Levittown, NY 11756
|
1,450 sq. feet
|
2 baths - beds |
show details | |

|
#29
Cove Ln
Levittown, NY 11756
|
1,425 sq. feet
|
1 baths - beds |
show details | |

|
#30
Homestead Ln
Levittown, NY 11756
|
1,050 sq. feet
|
1 baths - beds |
show details |
| Photo | Address | Area | Beds / Baths | Price | Details |
|---|---|---|---|---|---|

|
#31
Primrose Ln
Levittown, NY 11756
|
2,234 sq. feet
|
2 baths - beds |
show details | |

|
#32
Grove Ln
Levittown, NY 11756
|
1,568 sq. feet
|
2 baths - beds |
show details | |

|
#33
Bayberry Ln
Levittown, NY 11756
|
1,550 sq. feet
|
2 baths - beds |
show details | |

|
#34
Meridian Rd
Levittown, NY 11756
|
1,526 sq. feet
|
1 baths - beds |
show details | |

|
#35
Emerson Ave
Levittown, NY 11756
|
1,045 sq. feet
|
1 baths - beds |
show details | |

|
#36
Horn Ln
Levittown, NY 11756
|
2,700 sq. feet
|
3 baths - beds |
show details | |

|
#37
Market Ln
Levittown, NY 11756
|
1,476 sq. feet
|
2 baths - beds |
show details | |

|
#38
Valley Rd
Levittown, NY 11756
|
1,125 sq. feet
|
2 baths - beds |
show details | |

|
#39
Low Ln
Levittown, NY 11756
|
2,072 sq. feet
|
2 baths - beds |
show details | |

|
#40
Balsam Ln
Levittown, NY 11756
|
1,216 sq. feet
|
1 baths - beds |
show details |
| Photo | Address | Area | Beds / Baths | Price | Details |
|---|---|---|---|---|---|

|
#41
N Newbridge Rd
Levittown, NY 11756
|
1,378 sq. feet
|
2 baths - beds |
show details | |

|
#42
Center Ln
Levittown, NY 11756
|
1,050 sq. feet
|
1 baths - beds |
show details | |

|
#43
Wolcott Rd
Levittown, NY 11756
|
1,940 sq. feet
|
2 baths - beds |
show details | |

|
#44
N Newbridge Rd Apt H4
Levittown, NY 11756
|
- sq. feet
|
- baths - beds |
show details | |

|
#45
Bayberry Ln
Levittown, NY 11756
|
- sq. feet
|
- baths - beds |
show details | |

|
#46
Radial Ln
Levittown, NY 11756
|
- sq. feet
|
- baths - beds |
show details | |

|
#47
Wolcott Rd
Levittown, NY 11756
|
- sq. feet
|
- baths - beds |
show details | |

|
#48
Astronomy Ln
Levittown, NY 11756
|
- sq. feet
|
- baths - beds |
show details | |

|
#49
N Newbridge Rd
Levittown, NY 11756
|
- sq. feet
|
- baths - beds |
show details | |

|
Check over 1 million property listings on Foreclosure.com!
|
browse all offers | |||

Latest news about housing in Levittown, NY collected exclusively by city-data.com from local newspapers, TV, and radio stations

 | Farmingdale/Levittown Coops & Condos (14 replies) |
| Cold floors and air leaking from the bottom of baseboards - Levittown home (18 replies) |
| Homesick for Long Island (93 replies) |
| Wantagh Houses in Levittown School District (13 replies) |
| Buying a home in Levittown (10 replies) |
| Levittown and Wantagh School Districts (26 replies) |
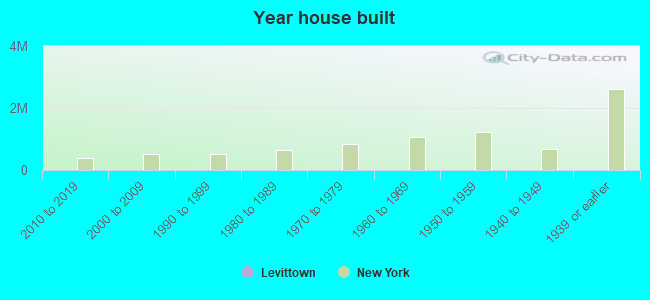
Median year apartment built: 1956
Household type by relationship:
Households: 50,605- Male householders: 8,286 (935 living alone), Female householders: 8,480 (1,645 living alone)
11,044 spouses (10,925 opposite-sex spouses), 568 unmarried partners, (561 opposite-sex unmarried partners), 17,163 children (16,429 natural, 313 adopted, 420 stepchildren), 822 grandchildren, 973 brothers or sisters, 1,108 parents, 0 foster children, 1,038 other relatives, 986 non-relatives
- In group quarters: 130
Size of family households: 4,771 2-persons, 3,364 3-persons, 3,292 4-persons, 1,431 5-persons, 571 6-persons, 236 7-or-more-persons.
Size of nonfamily households: 2,691 1-person, 378 2-persons, 87 3-persons, 8 4-persons.
7,262 married couples with children.
817 single-parent households (269 men, 548 women).
76.1% of residents of Levittown speak English at home.
10.4% of residents speak Spanish at home (76% speak English very well, 16% speak English well, 6% speak English not well, 1% don't speak English at all).
6.6% of residents speak other Indo-European language at home (78% speak English very well, 17% speak English well, 4% speak English not well, 1% don't speak English at all).
5.4% of residents speak Asian or Pacific Island language at home (56% speak English very well, 24% speak English well, 15% speak English not well, 4% don't speak English at all).
0.8% of residents speak other language at home (80% speak English very well, 13% speak English well, 7% speak English not well).
Foreign born population: 7,556 (14.9%)
(79.9% of them are naturalized citizens)
| Here: | 6.7 |
| State: | 6.3 |
| Here: | 4.9 |
| State: | 3.8 |
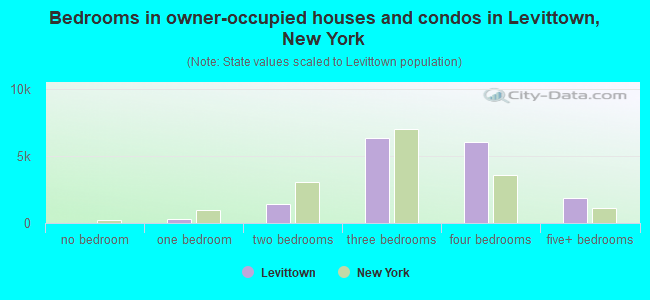
- Bedrooms in owner-occupied houses and condos in Levittown, New York
- 11no bedroom
- 3211 bedroom
- 1,3962 bedrooms
- 6,3533 bedrooms
- 6,0134 bedrooms
- 1,8555+ bedrooms
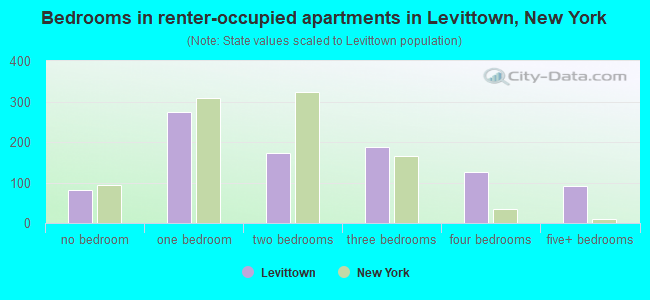
- Bedrooms in renter-occupied apartments in Levittown, New York
- 81no bedroom
- 2741 bedroom
- 1732 bedrooms
- 1883 bedrooms
- 1274 bedrooms
- 925+ bedrooms
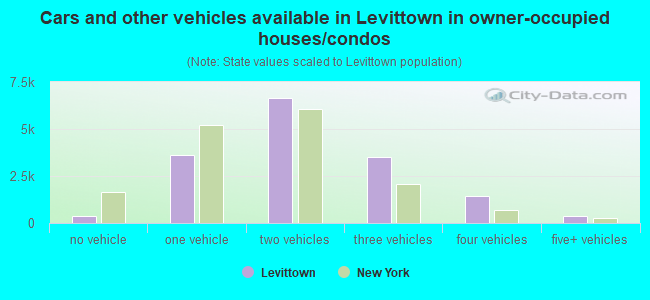
- Cars and other vehicles available in Levittown in owner-occupied houses/condos
- 370no vehicle
- 3,5921 vehicle
- 6,6702 vehicles
- 3,5023 vehicles
- 1,4254 vehicles
- 3905+ vehicles
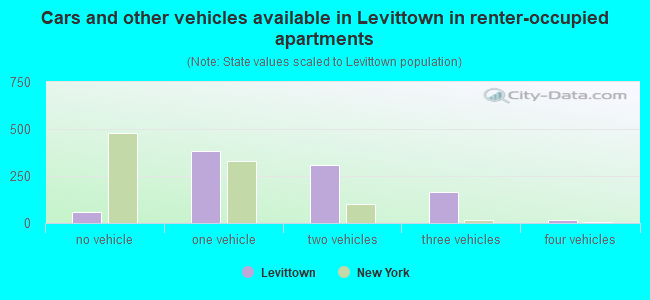
- Cars and other vehicles available in Levittown in renter-occupied apartments
- 60no vehicle
- 3841 vehicle
- 3102 vehicles
- 1653 vehicles
- 154 vehicles
- 05+ vehicles
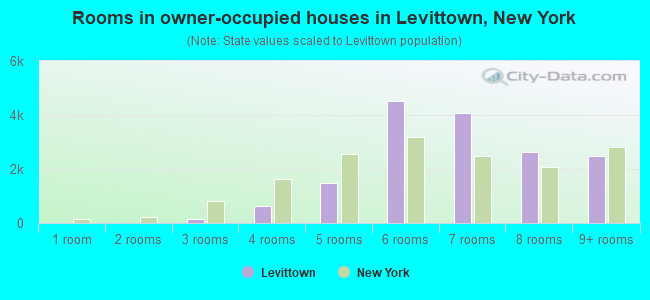
- Rooms in owner-occupied houses in Levittown, New York
- 111 room
- 02 rooms
- 1443 rooms
- 6224 rooms
- 1,4745 rooms
- 4,5186 rooms
- 4,0717 rooms
- 2,6418 rooms
- 2,4679+ rooms
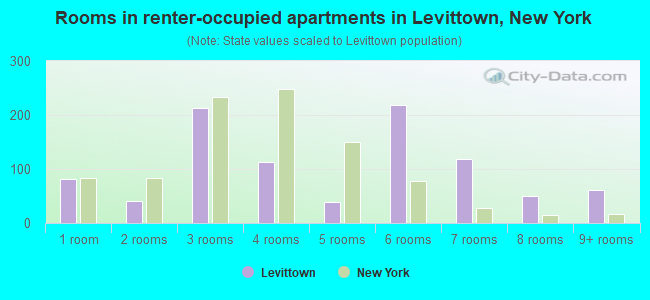
- Rooms in renter-occupied apartments in Levittown, New York
- 811 room
- 412 rooms
- 2133 rooms
- 1134 rooms
- 385 rooms
- 2196 rooms
- 1187 rooms
- 508 rooms
- 619+ rooms
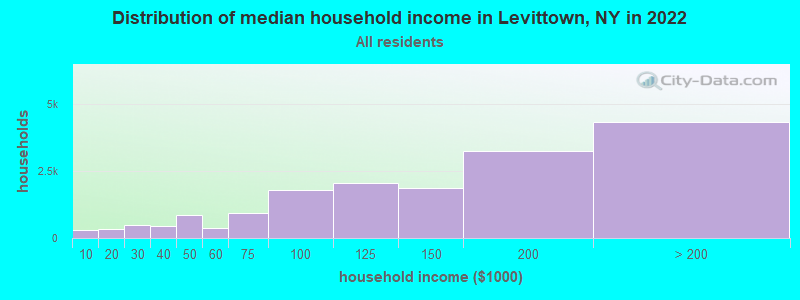
Levittown, NY household income distribution

- 316Less than $10,000
- 317$10,000 to $19,999
- 489$20,000 to $29,999
- 432$30,000 to $39,999
- 850$40,000 to $49,999
- 378$50,000 to $59,999
- 920$60,000 to $74,999
- 1,772$75,000 to $99,999
- 2,053$100,000 to $124,999
- 1,868$125,000 to $149,999
- 3,222$150,000 to $199,999
- 4,319$200,000 or more
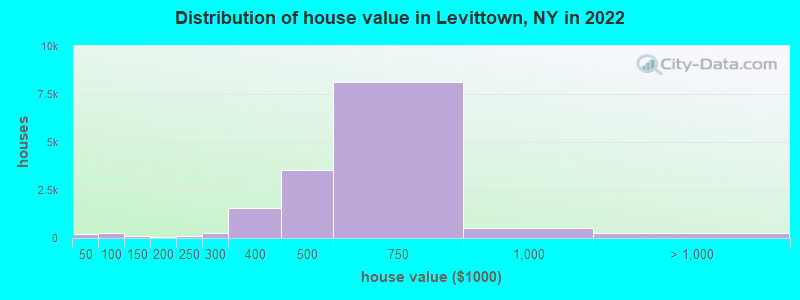
Home value of owner - occupied houses in 2022 in Levittown, NY
-
- 54Less than $10,000
- 5$15,000 to $19,999
- 131$40,000 to $49,999
- 67$50,000 to $59,999
- 41$60,000 to $69,999
- 59$100,000 to $124,999
- 45$125,000 to $149,999
- 38$150,000 to $174,999
- 7$175,000 to $199,999
- 94$200,000 to $249,999
- 237$250,000 to $299,999
- 1,580$300,000 to $399,999
- 3,536$400,000 to $499,999
- 8,098$500,000 to $749,999
- 543$750,000 to $999,999
- 181$1,000,000 to $1,499,999
- 11$1,500,000 to $1,999,999
- 45$2,000,000 or more
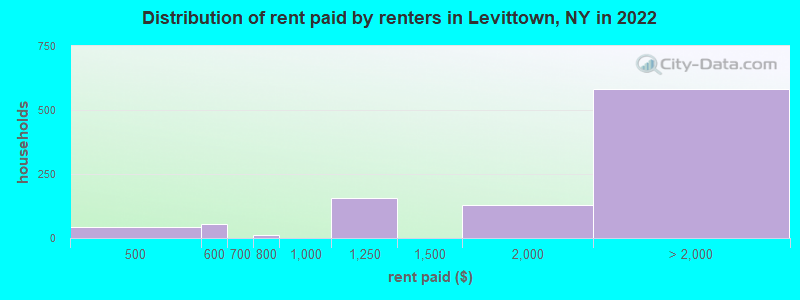
Rent paid by renters in 2022 in Levittown, NY
-
- 41$400 to $449
- 53$500 to $549
- 10$700 to $749
- 154$1,000 to $1,249
- 130$1,500 to $1,999
- 212$2,000 to $2,499
- 179$2,500 to $2,999
- 84$3,000 to $3,499
- 63$3,500 or more
- 41No cash rent
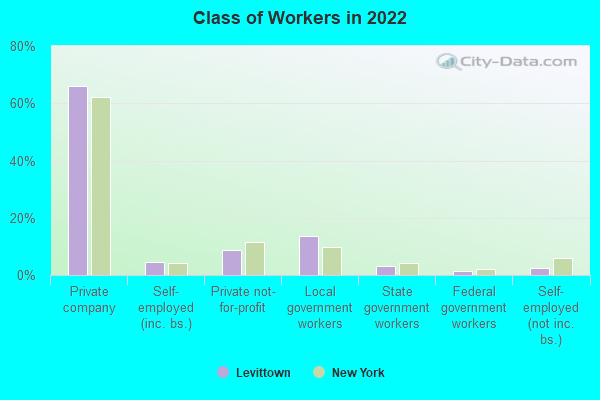
Percentage of workers working in this county: 61.9%
Number of people working at home: 2,596 (9.3% of all workers)
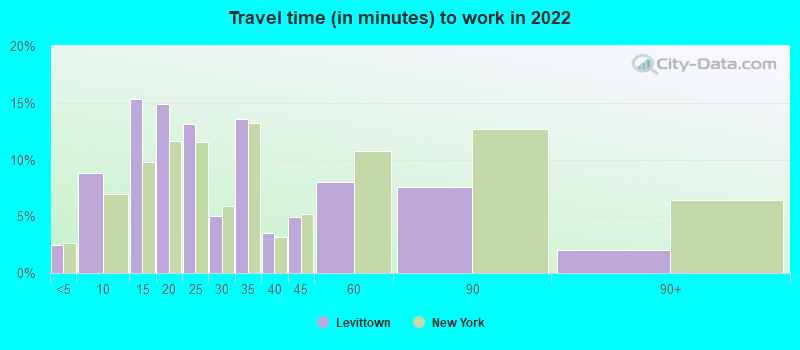
Travel time to work (commute)
- Less than 5 minutes: 427
- 5 to 9 minutes: 1,484
- 10 to 14 minutes: 2,608
- 15 to 19 minutes: 3,481
- 20 to 24 minutes: 3,166
- 25 to 29 minutes: 1,687
- 30 to 34 minutes: 3,538
- 35 to 39 minutes: 553
- 40 to 44 minutes: 1,218
- 45 to 59 minutes: 2,387
- 60 to 89 minutes: 2,090
- 90 or more minutes: 2,233
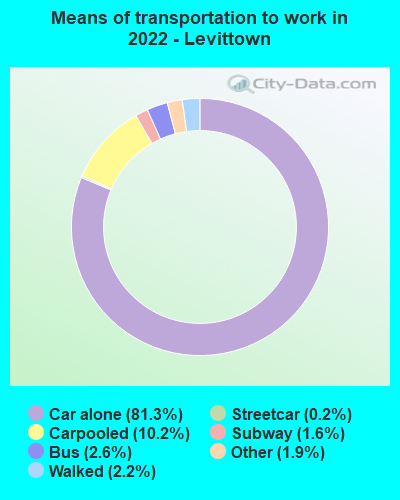
Means of transportation to work:
- Drove a car alone: 8,048 (64.6%)
- Carpooled: 981 (7.9%)
- Bus: 250 (2.0%)
- Subway or elevated rail: 21 (0.2%)
- Long-distance train or commuter rail: 138 (1.1%)
- Taxi: 273 (2.2%)
- Walked: 233 (1.9%)
- Worked at home: 2,596 (20.9%)
- Unemployment by race in 2022
- Unemployment rate for White non-Hispanic residents
- 5.6%Males
- 3.9%Females
- Unemployment rate for Black residents
- 2.5%Males
- 8.1%Females
- Unemployment rate for Asian residents
- 4.1%Males
- 2.9%Females
- Unemployment rate for other race residents
- 2.7%Males
- 5.0%Females
- Unemployment rate for two or more race residents
- 4.6%Males
- 5.7%Females
- Unemployment rate for Hispanic or Latino residents
- 4.3%Males
- 4.0%Females
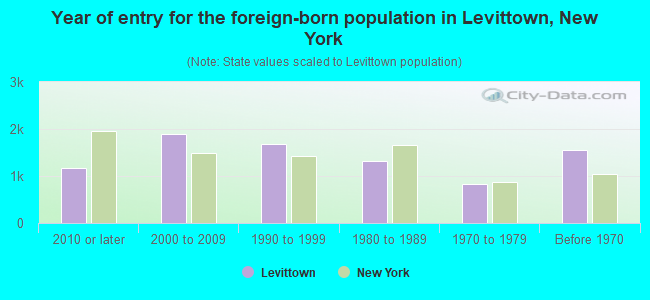
- Year of entry for the foreign-born population in Levittown, New York
- 1,1692010 or later
- 1,8872000 to 2009
- 1,6901990 to 1999
- 1,3151980 to 1989
- 8361970 to 1979
- 1,553Before 1970
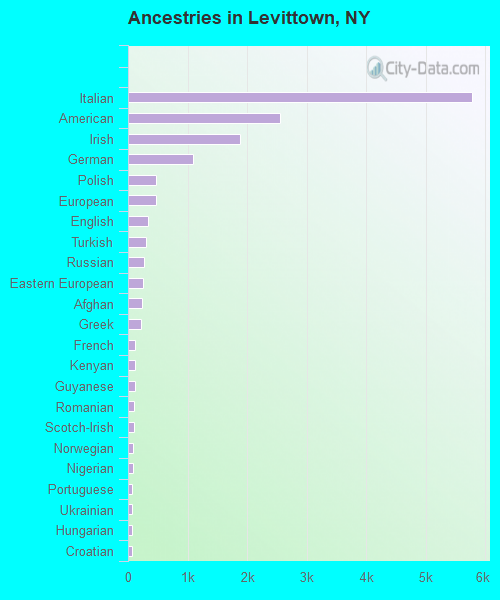
First ancestries reported:
- Italian: 5,777 (25.0%)
- American: 2,549 (11.0%)
- Irish: 1,886 (8.2%)
- German: 1,086 (4.7%)
- Polish: 469 (2.0%)
- European: 469 (2.0%)
- English: 342 (1.5%)
- Turkish: 308 (1.3%)
- Russian: 271 (1.2%)
- Eastern European: 254 (1.1%)
- Afghan: 243 (1.1%)
- Greek: 212 (0.9%)
- French: 126 (0.5%)
- Kenyan: 119 (0.5%)
- Guyanese: 112 (0.5%)
- Romanian: 109 (0.5%)
- Scotch-Irish: 104 (0.5%)
- Norwegian: 85 (0.4%)
- Nigerian: 78 (0.3%)
- Portuguese: 75 (0.3%)
- Ukrainian: 67 (0.3%)
- Hungarian: 66 (0.3%)
- Croatian: 60 (0.3%)
- Lithuanian: 46 (0.2%)
- Albanian: 42 (0.2%)
- Haitian: 38 (0.2%)
- Maltese: 30 (0.1%)
- West Indian: 27 (0.1%)
- Jamaican: 25 (0.1%)
- Scottish: 20 (0.09%)
- British: 14 (0.06%)
- Serbian: 14 (0.06%)
- Palestinian: 13 (0.06%)
- Austrian: 13 (0.06%)
- Iranian: 12 (0.05%)
- French Canadian: 10 (0.04%)
- Israeli: 10 (0.04%)
- Canadian: 8 (0.03%)
- Scandinavian: 8 (0.03%)
- Moroccan: 7 (0.03%)
- Czechoslovakian: 7 (0.03%)
- Northern European: 7 (0.03%)
- Swedish: 6 (0.03%)
- Welsh: 5 (0.02%)
- Belgian: 4 (0.02%)
Most common places of birth for foreign-born residents (%):
| Levittown: | 11.3% (829) |
| New York: | 2.5% (111,920) |
| Levittown: | 9.5% (694) |
| New York: | 3.5% (158,432) |
| Levittown: | 9.5% (692) |
| New York: | 9.1% (410,910) |
| Levittown: | 5.6% (409) |
| New York: | 2.4% (108,067) |
| Levittown: | 5.4% (395) |
| New York: | 1.8% (81,374) |
| Levittown: | 4.4% (319) |
| New York: | 1.2% (54,759) |
| Levittown: | 4.2% (304) |
| New York: | 3.9% (177,448) |
| Levittown: | 4.2% (304) |
| New York: | 2.0% (91,070) |
| Levittown: | 3.8% (276) |
| New York: | 11.1% (501,040) |
| Levittown: | 3.7% (274) |
| New York: | 1.4% (62,442) |
| Levittown: | 3.4% (248) |
| New York: | 1.8% (82,786) |
| Levittown: | 2.9% (209) |
| New York: | 0.2% (8,745) |
| Levittown: | 2.7% (198) |
| New York: | 0.5% (21,009) |
| Levittown: | 2.5% (183) |
| New York: | 3.8% (172,129) |
| Levittown: | 1.9% (137) |
| New York: | 2.6% (117,288) |
| Levittown: | 1.7% (125) |
| New York: | 1.2% (55,571) |
| Levittown: | 1.6% (118) |
| New York: | 0.1% (5,566) |
Place of birth for U.S.-born residents:
- This state: 39,272
- Other state: 2,526
- Northeast: 925
- Midwest: 333
- South: 697
- West: 576
93.9% of Levittown residents lived in the same house 1 years ago.
Out of people who lived in different houses, 27.2% lived in this county.
Out of people who lived in different counties, 93.7% lived in New York.
| Levittown: | 93.9% |
| State average: | 89.6% |
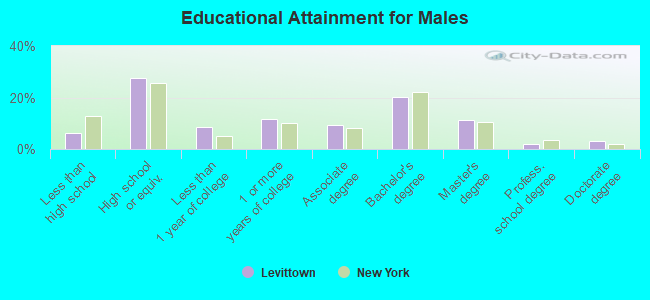
Education attainment for males 25 years and older:
- No schooling: 284
- Nursery to 4th grade: 96
- 5th and 6th grade: 50
- 7th and 8th grade: 55
- 9th grade: 89
- 10th grade: 17
- 11th grade: 168
- 12th grade, no diploma: 336
- High school graduate (or equivalency): 4,824
- Less than 1 year of college: 1,527
- Some college more than 1 year, no degree: 2,058
- Associate degree: 1,665
- Bachelor's degree: 3,518
- Master's degree: 1,961
- Professional school degree: 337
- Doctorate degree: 539
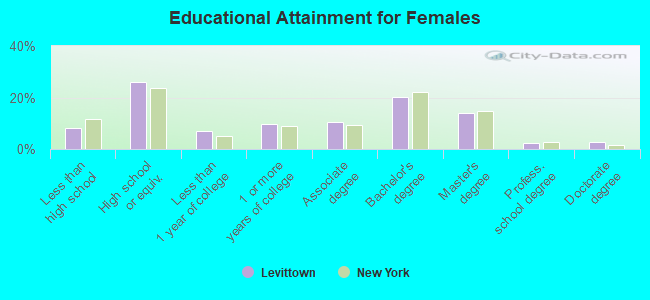
Education attainment for females 25 years and older:
- No schooling: 519
- Nursery to 4th grade: 37
- 5th and 6th grade: 30
- 7th and 8th grade: 59
- 9th grade: 10
- 10th grade: 79
- 11th grade: 137
- 12th grade, no diploma: 654
- High school graduate (or equivalency): 4,920
- Less than 1 year of college: 1,318
- Some college more than 1 year, no degree: 1,835
- Associate degree: 1,987
- Bachelor's degree: 3,840
- Master's degree: 2,633
- Professional school degree: 445
- Doctorate degree: 517
Housing units in structures:
- One, detached: 16,254
- One, attached: 214
- Two: 242
- 3 or 4: 85
- 5 to 9: 146
- 10 to 19: 131
- 20 to 49: 120
- 50 or more: 78
Housing units lacking complete kitchen facilities in 2022: 0.6%
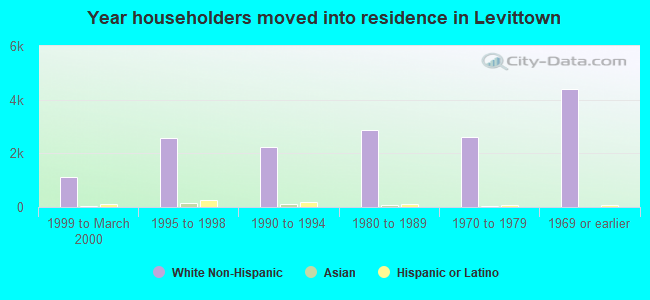
House/condo owner moved in on average 21 years ago
Renter moved in on average 6 years ago
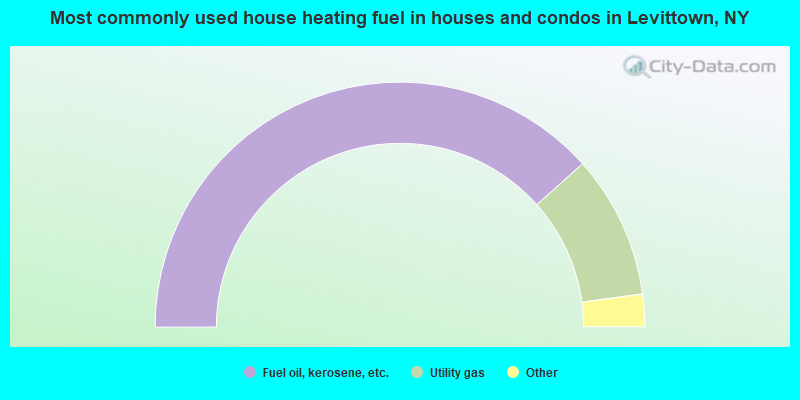
- 76.8%Fuel oil, kerosene, etc.
- 18.9%Utility gas
- 2.0%Electricity
- 1.4%Bottled, tank, or LP gas
- 0.6%Other fuel
- 0.2%Wood
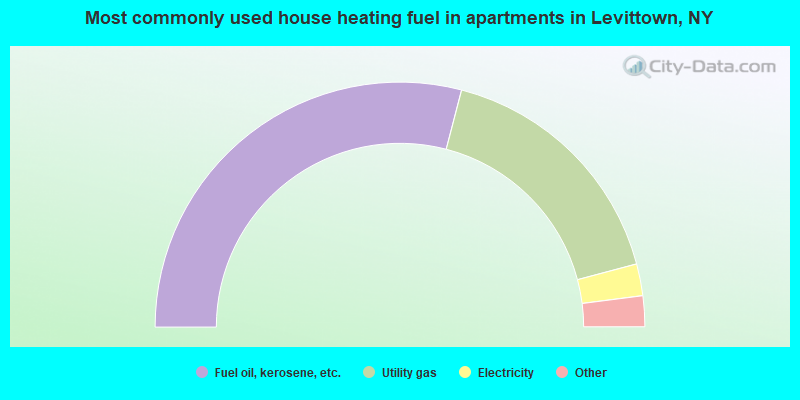
- 58.3%Fuel oil, kerosene, etc.
- 33.7%Utility gas
- 4.2%Electricity
- 2.9%Bottled, tank, or LP gas
- 1.0%No fuel used
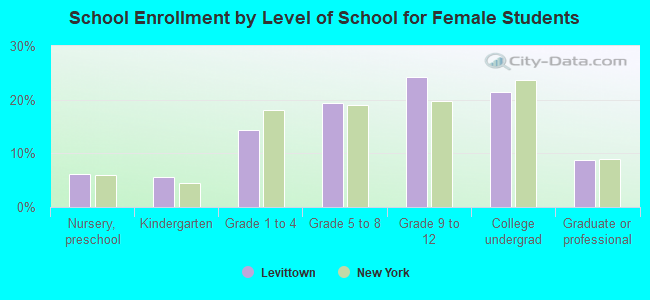
Private vs. public school enrollment:
| Here: | 7.3% |
| New York: | 15.6% |
| Here: | 5.8% |
| New York: | 15.0% |
| Here: | 31.3% |
| New York: | 39.2% |