Lexington-Fayette, KY (Kentucky) Houses and Residents
| Lexington-Fayette: | $287,100 |
| Kentucky: | $196,300 |
Mean price in 2022:
Detached houses: $359,728
Here: $359,728 State: $256,452 Townhouses or other attached units: $241,534
Here: $241,534 State: $264,090 In 2-unit structures: $307,035
Here: $307,035 State: $211,203 In 3-to-4-unit structures: $314,409
Here: $314,409 State: $169,074 In 5-or-more-unit structures: $214,740
Here: $214,740 State: $245,174 Mobile homes: $84,306
Here: $84,306 State: $84,635
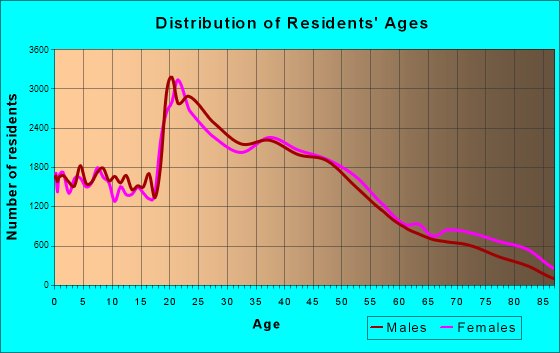
Total population: 310,797 (Urban population: 249,378 (249,241 inside urbanized areas, 137 inside urban clusters), Rural population: 11,134 (1,148 farm, 9,986 nonfarm))
Houses: 148,963 (140,837 occupied: 76,049 owner occupied, 64,788 renter occupied)
| % of renters here: | 46% |
| State: | 31% |
Housing density: 524 houses/condos per square mile
Median price asked for vacant for-sale houses and condos in 2022: $242,685.
Median contract rent in 2022: $878 (lower quartile is $679, upper quartile is $1,136)
Median rent asked for vacant for-rent units in 2022: $951
Median gross rent in Lexington-Fayette, KY in 2022: $1,036
Housing units in Lexington-Fayette with a mortgage: 51,101 (7,539 second mortgage, 353 home equity loan, 6,483 both second mortgage and home equity loan)
Houses without a mortgage: 1,737
Median household income for houses/condos with a mortgage: $111,279
Median household income for apartments without a mortgage: $72,382
Median monthly housing costs: $1,095
Compare current foreclosures near Lexington-Fayette, KY:
| Photo | Address | Area | Beds / Baths | Price | Details |
|---|---|---|---|---|---|

|
#1
Cottage St
Nicholasville, KY 40356
|
1 sq. feet
|
1 baths 1 beds |
$62,500
|
show details |

|
#2
Belmere Dr
Lexington, KY 40509
|
2,842 sq. feet
|
3 baths 4 beds |
show details | |

|
#3
Deer Lake Cir
Lexington, KY 40515
|
1,550 sq. feet
|
2 baths 2 beds |
show details | |

|
#4
N Limestone
Lexington, KY 40508
|
1,238 sq. feet
|
1 baths 2 beds |
show details | |

|
#5
Paddock Dr
Versailles, KY 40383
|
1,210 sq. feet
|
1 baths 3 beds |
show details | |

|
#6
Sullivans Trce
Lexington, KY 40511
|
2,746 sq. feet
|
2 baths 4 beds |
show details | |

|
#7
Peachtree Rd
Nicholasville, KY 40356
|
1,764 sq. feet
|
3 baths 4 beds |
show details | |

|
#8
Chelsea Woods Dr
Lexington, KY 40509
|
1,252 sq. feet
|
2 baths 2 beds |
show details | |

|
#9
Hunters Ct
Versailles, KY 40383
|
1,880 sq. feet
|
2 baths 3 beds |
show details | |

|
#10
Trailwood Ln
Lexington, KY 40511
|
1,420 sq. feet
|
2 baths 3 beds |
show details |
| Photo | Address | Area | Beds / Baths | Price | Details |
|---|---|---|---|---|---|

|
#11
Whiteberry Dr
Lexington, KY 40511
|
1,454 sq. feet
|
2 baths 3 beds |
show details | |

|
#12
Sardula Pl
Georgetown, KY 40324
|
1,452 sq. feet
|
2 baths 4 beds |
show details | |

|
#13
General John Payne Blvd
Georgetown, KY 40324
|
2,152 sq. feet
|
2 baths 3 beds |
show details | |

|
#14
Baybrook Cir
Nicholasville, KY 40356
|
1,432 sq. feet
|
2 baths 3 beds |
show details | |

|
#15
Martin Luther King Jr Blvd
Versailles, KY 40383
|
1,085 sq. feet
|
1 baths 3 beds |
show details | |

|
#16
Logana Pike
Nicholasville, KY 40356
|
891 sq. feet
|
1 baths 2 beds |
show details | |

|
#17
Dunroven Rd
Versailles, KY 40383
|
1,161 sq. feet
|
1 baths 4 beds |
show details | |

|
#18
Mcdonald Dr
Versailles, KY 40383
|
1,107 sq. feet
|
1 baths 3 beds |
show details | |

|
#19
Oak St
Georgetown, KY 40324
|
1,103 sq. feet
|
1 baths 2 beds |
show details | |

|
#20
Placid Dr
Georgetown, KY 40324
|
1,330 sq. feet
|
9 baths 4 beds |
show details |
| Photo | Address | Area | Beds / Baths | Price | Details |
|---|---|---|---|---|---|

|
#21
Dusk Ct
Georgetown, KY 40324
|
1,005 sq. feet
|
2 baths 2 beds |
show details | |

|
#22
Seminole Creek Ct
Lexington, KY 40511
|
2,064 sq. feet
|
2 baths 4 beds |
show details | |

|
#23
Beech St
Versailles, KY 40383
|
910 sq. feet
|
1 baths 3 beds |
show details | |

|
#24
Gleneagles Way
Versailles, KY 40383
|
2,668 sq. feet
|
2 baths 4 beds |
show details | |

|
#25
Emerson Trl
Georgetown, KY 40324
|
2,514 sq. feet
|
2 baths 4 beds |
show details | |

|
#26
Nickwood Trl
Lexington, KY 40509
|
1,565 sq. feet
|
2 baths 3 beds |
show details | |

|
#27
Hanover Dr
Versailles, KY 40383
|
2,458 sq. feet
|
2 baths 4 beds |
show details | |

|
#28
Leisure Creek Ct
Lexington, KY 40517
|
837 sq. feet
|
2 baths 3 beds |
show details | |

|
#29
Rolling Acres Dr
Nicholasville, KY 40356
|
1,080 sq. feet
|
1 baths 3 beds |
show details | |

|
#30
Crowe Ln
Nicholasville, KY 40356
|
1,477 sq. feet
|
2 baths 3 beds |
show details |
| Photo | Address | Area | Beds / Baths | Price | Details |
|---|---|---|---|---|---|

|
#31
Barberry Ln
Nicholasville, KY 40356
|
1,257 sq. feet
|
1 baths 3 beds |
show details | |

|
#32
Dylan Pl
Lexington, KY 40514
|
1,422 sq. feet
|
2 baths 2 beds |
show details | |

|
#33
Fiddler Creek Way
Lexington, KY 40515
|
4,023 sq. feet
|
3 baths 4 beds |
show details | |

|
#34
Dickinson Dr
Georgetown, KY 40324
|
1,106 sq. feet
|
2 baths 3 beds |
show details | |

|
#35
Mable Ln
Lexington, KY 40511
|
2,205 sq. feet
|
4 baths 3 beds |
show details | |

|
#36
Copperfield Ln
Georgetown, KY 40324
|
2,216 sq. feet
|
2 baths 3 beds |
show details | |

|
#37
N Hamilton St
Georgetown, KY 40324
|
1,896 sq. feet
|
2 baths 4 beds |
show details | |

|
#38
Dorchester Dr
Georgetown, KY 40324
|
1,612 sq. feet
|
1 baths 3 beds |
show details | |

|
#39
Gormley Dr
Versailles, KY 40383
|
1,864 sq. feet
|
3 baths 4 beds |
show details | |

|
#40
Foxwood Dr
Nicholasville, KY 40356
|
1,637 sq. feet
|
1 baths 3 beds |
show details |
| Photo | Address | Area | Beds / Baths | Price | Details |
|---|---|---|---|---|---|

|
#41
Gano Ave
Georgetown, KY 40324
|
2,034 sq. feet
|
2 baths 4 beds |
show details | |

|
#42
Clearwater Ct
Georgetown, KY 40324
|
1,304 sq. feet
|
2 baths 3 beds |
show details | |

|
#43
Marjorie Pl
Georgetown, KY 40324
|
1,052 sq. feet
|
2 baths 3 beds |
show details | |

|
#44
Nancy St
Versailles, KY 40383
|
1,066 sq. feet
|
1 baths 3 beds |
show details | |

|
#45
Macey Ave
Versailles, KY 40383
|
1,768 sq. feet
|
1 baths 3 beds |
show details | |

|
#46
Laurel Ln
Nicholasville, KY 40356
|
1,188 sq. feet
|
1 baths 3 beds |
show details | |

|
#47
Hickory Hill Dr
Nicholasville, KY 40356
|
1,563 sq. feet
|
1 baths 3 beds |
show details | |

|
#48
Santa Barbara Blvd
Georgetown, KY 40324
|
2,268 sq. feet
|
3 baths 4 beds |
show details | |

|
#49
Blue Spruce Ct
Versailles, KY 40383
|
1,579 sq. feet
|
2 baths 3 beds |
show details | |

|
Check over 1 million property listings on Foreclosure.com!
|
browse all offers | |||

Latest news about housing in Lexington-Fayette, KY collected exclusively by city-data.com from local newspapers, TV, and radio stations

 | Local economy (7 replies) |
| Tarleton Crossings apartments (4 replies) |
| Lexington Kentucky and suburbs schools? (65 replies) |
| Help me build a farm close to the city... (21 replies) |
| Moving near Harrodsburg Kentucky area (7 replies) |
| Moving to Lexington this summer - need input on areas and schools (17 replies) |
Median year apartment built: 1985
Household type by relationship:
Households: 320,347- Male householders: 68,238 (24,174 living alone), Female householders: 72,599 (25,652 living alone)
54,103 spouses (53,466 opposite-sex spouses), 12,552 unmarried partners, (11,795 opposite-sex unmarried partners), 76,977 children (72,437 natural, 1,937 adopted, 2,603 stepchildren), 3,414 grandchildren, 3,010 brothers or sisters, 3,389 parents, 65 foster children, 4,938 other relatives, 8,462 non-relatives
- In group quarters: 12,600
Size of family households: 36,470 2-persons, 18,097 3-persons, 14,274 4-persons, 6,721 5-persons, 1,436 6-persons, 1,003 7-or-more-persons.
Size of nonfamily households: 49,826 1-person, 11,741 2-persons, 896 3-persons, 308 4-persons, 65 7-or-more-persons.
41,848 married couples with children.
18,765 single-parent households (4,796 men, 13,969 women).
86.2% of residents of Lexington-Fayette speak English at home.
6.2% of residents speak Spanish at home (62% speak English very well, 17% speak English well, 14% speak English not well, 6% don't speak English at all).
3.1% of residents speak other Indo-European language at home (71% speak English very well, 19% speak English well, 8% speak English not well, 3% don't speak English at all).
2.3% of residents speak Asian or Pacific Island language at home (59% speak English very well, 24% speak English well, 14% speak English not well, 2% don't speak English at all).
2.3% of residents speak other language at home (50% speak English very well, 25% speak English well, 20% speak English not well, 4% don't speak English at all).
Foreign born population: 32,517 (10.2%)
(42.8% of them are naturalized citizens)
| Here: | 6.9 |
| State: | 6.4 |
| Here: | 4.0 |
| State: | 4.4 |

- Bedrooms in owner-occupied houses and condos in Lexington-Fayette, Kentucky
- 83no bedroom
- 5681 bedroom
- 8,4442 bedrooms
- 35,8913 bedrooms
- 25,7074 bedrooms
- 5,3565+ bedrooms

- Bedrooms in renter-occupied apartments in Lexington-Fayette, Kentucky
- 2,738no bedroom
- 22,3091 bedroom
- 23,2592 bedrooms
- 12,6193 bedrooms
- 3,6084 bedrooms
- 2555+ bedrooms

- Cars and other vehicles available in Lexington-Fayette in owner-occupied houses/condos
- 1,264no vehicle
- 22,0231 vehicle
- 36,0382 vehicles
- 13,1253 vehicles
- 2,5554 vehicles
- 1,0445+ vehicles

- Cars and other vehicles available in Lexington-Fayette in renter-occupied apartments
- 7,265no vehicle
- 36,3801 vehicle
- 16,1502 vehicles
- 4,2923 vehicles
- 5154 vehicles
- 1865+ vehicles

- Rooms in owner-occupied houses in Lexington-Fayette, Kentucky
- 831 room
- 1912 rooms
- 4933 rooms
- 5,4094 rooms
- 11,2805 rooms
- 15,9956 rooms
- 10,5977 rooms
- 12,0298 rooms
- 19,9729+ rooms

- Rooms in renter-occupied apartments in Lexington-Fayette, Kentucky
- 1,9031 room
- 7,1482 rooms
- 15,5123 rooms
- 15,6484 rooms
- 12,6665 rooms
- 6,9586 rooms
- 2,1787 rooms
- 8108 rooms
- 1,9659+ rooms


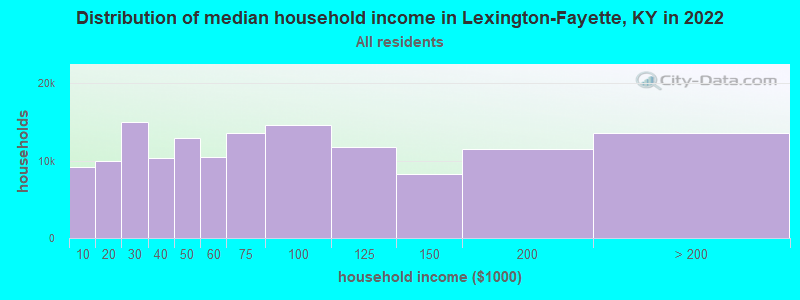
Lexington-Fayette, KY household income distribution

- 9,159Less than $10,000
- 9,900$10,000 to $19,999
- 14,975$20,000 to $29,999
- 10,281$30,000 to $39,999
- 12,874$40,000 to $49,999
- 10,492$50,000 to $59,999
- 13,573$60,000 to $74,999
- 14,537$75,000 to $99,999
- 11,726$100,000 to $124,999
- 8,261$125,000 to $149,999
- 11,525$150,000 to $199,999
- 13,534$200,000 or more
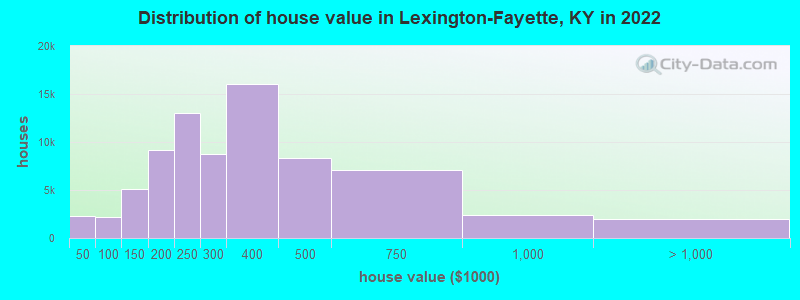
Home value of owner - occupied houses in 2022 in Lexington-Fayette, KY
-
- 1,050Less than $10,000
- 78$10,000 to $14,999
- 451$15,000 to $19,999
- 176$20,000 to $24,999
- 71$25,000 to $29,999
- 75$30,000 to $34,999
- 131$35,000 to $39,999
- 291$40,000 to $49,999
- 149$50,000 to $59,999
- 323$60,000 to $69,999
- 624$70,000 to $79,999
- 274$80,000 to $89,999
- 570$90,000 to $99,999
- 2,445$100,000 to $124,999
- 2,665$125,000 to $149,999
- 4,334$150,000 to $174,999
- 4,829$175,000 to $199,999
- 13,011$200,000 to $249,999
- 8,724$250,000 to $299,999
- 15,992$300,000 to $399,999
- 8,381$400,000 to $499,999
- 7,076$500,000 to $749,999
- 2,375$750,000 to $999,999
- 1,196$1,000,000 to $1,499,999
- 202$1,500,000 to $1,999,999
- 556$2,000,000 or more
Rent paid by renters in 2022 in Lexington-Fayette, KY
-
- 346Less than $100
- 110$100 to $149
- 1,205$150 to $199
- 968$200 to $249
- 506$250 to $299
- 585$300 to $349
- 444$350 to $399
- 733$400 to $449
- 821$450 to $499
- 1,475$500 to $549
- 2,302$550 to $599
- 3,733$600 to $649
- 4,203$650 to $699
- 4,088$700 to $749
- 3,369$750 to $799
- 8,307$800 to $899
- 7,862$900 to $999
- 11,075$1,000 to $1,249
- 5,791$1,250 to $1,499
- 4,487$1,500 to $1,999
- 156$2,000 to $2,499
- 124$2,500 to $2,999
- 40$3,000 to $3,499
- 57$3,500 or more
- 2,001No cash rent


Percentage of workers working in this county: 83.5%
Number of people working at home: 19,417 (11.7% of all workers)
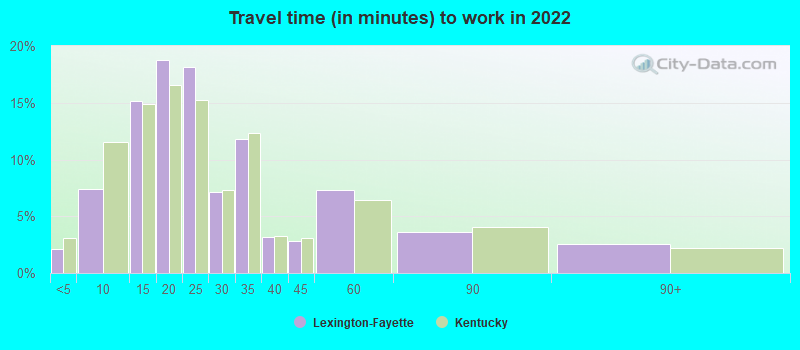
Travel time to work (commute)
- Less than 5 minutes: 3,707
- 5 to 9 minutes: 13,311
- 10 to 14 minutes: 25,950
- 15 to 19 minutes: 33,772
- 20 to 24 minutes: 30,038
- 25 to 29 minutes: 10,882
- 30 to 34 minutes: 13,559
- 35 to 39 minutes: 2,435
- 40 to 44 minutes: 3,106
- 45 to 59 minutes: 4,610
- 60 to 89 minutes: 2,801
- 90 or more minutes: 2,177
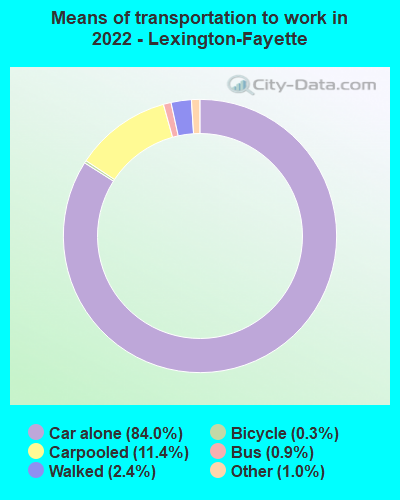
Means of transportation to work:
- Drove a car alone: 149,700 (75.8%)
- Carpooled: 20,333 (10.3%)
- Bus: 1,572 (0.8%)
- Taxi: 1,788 (0.9%)
- Bicycle: 515 (0.3%)
- Walked: 4,244 (2.1%)
- Worked at home: 19,417 (9.8%)

- Unemployment by race in 2022
- Unemployment rate for White non-Hispanic residents
- 6.0%Males
- 4.5%Females
- Unemployment rate for Black residents
- 2.6%Males
- 8.7%Females
- Unemployment rate for American Indian and Alaska Native residents
- 3.8%Males
- Unemployment rate for Asian residents
- 2.7%Females
- Unemployment rate for other race residents
- 4.5%Males
- 0.4%Females
- Unemployment rate for two or more race residents
- 9.9%Males
- 6.6%Females
- Unemployment rate for Hispanic or Latino residents
- 1.6%Males
- 2.0%Females

- Year of entry for the foreign-born population in Lexington-Fayette, Kentucky
- 17,3642010 or later
- 7,6492000 to 2009
- 3,9341990 to 1999
- 2,7501980 to 1989
- 9551970 to 1979
- 1,369Before 1970

First ancestries reported:
- American: 21,308 (13.0%)
- English: 20,663 (12.6%)
- German: 12,509 (7.6%)
- Irish: 11,356 (6.9%)
- European: 3,998 (2.4%)
- Italian: 2,837 (1.7%)
- Scottish: 2,676 (1.6%)
- Scotch-Irish: 2,662 (1.6%)
- Nigerian: 1,903 (1.2%)
- African: 1,562 (1.0%)
- Arab: 1,462 (0.9%)
- Polish: 1,456 (0.9%)
- French: 1,136 (0.7%)
- British: 1,063 (0.6%)
- Dutch: 665 (0.4%)
- Welsh: 649 (0.4%)
- Norwegian: 458 (0.3%)
- Ukrainian: 457 (0.3%)
- Egyptian: 426 (0.3%)
- Swedish: 402 (0.2%)
- Russian: 400 (0.2%)
- Scandinavian: 383 (0.2%)
- French Canadian: 351 (0.2%)
- Portuguese: 303 (0.2%)
- Eastern European: 280 (0.2%)
- Iranian: 276 (0.2%)
- Jamaican: 268 (0.2%)
- Northern European: 266 (0.2%)
- Palestinian: 255 (0.2%)
- Swiss: 216 (0.1%)
- Albanian: 210 (0.1%)
- Haitian: 197 (0.1%)
- Danish: 185 (0.1%)
- Turkish: 183 (0.1%)
- South African: 173 (0.1%)
- Lebanese: 163 (0.10%)
- Bulgarian: 155 (0.09%)
- Afghan: 151 (0.09%)
- Belgian: 148 (0.09%)
- Greek: 147 (0.09%)
- Canadian: 115 (0.07%)
- Hungarian: 114 (0.07%)
- Senegalese: 114 (0.07%)
- Iraqi: 112 (0.07%)
- Austrian: 109 (0.07%)
- Lithuanian: 97 (0.06%)
- Cajun: 82 (0.05%)
- Ethiopian: 81 (0.05%)
- Jordanian: 75 (0.05%)
- Yugoslavian: 69 (0.04%)
- Ghanaian: 65 (0.04%)
- Sudanese: 64 (0.04%)
- Czech: 64 (0.04%)
- Bahamian: 58 (0.04%)
- Armenian: 57 (0.03%)
- Slovak: 57 (0.03%)
- Romanian: 55 (0.03%)
- Kenyan: 47 (0.03%)
- Trinidadian and Tobagonian: 40 (0.02%)
- Czechoslovakian: 37 (0.02%)
- Croatian: 36 (0.02%)
- Icelander: 33 (0.02%)
- Belizean: 25 (0.02%)
- Finnish: 24 (0.01%)
- Moroccan: 17 (0.01%)
- Guyanese: 16 (0.01%)
- Macedonian: 16 (0.01%)
- Sierra Leonean: 14 (0.01%)
- German Russian: 14 (0.01%)
- Slovene: 13 (0.01%)
- Syrian: 12 (0.01%)
- Brazilian: 11 (0.01%)
- Slavic: 10 (0.01%)
- Latvian: 10 (0.01%)
- Serbian: 9 (0.01%)
Most common places of birth for foreign-born residents (%):
| Lexington-Fayette: | 18.6% (6,219) |
| Kentucky: | 15.8% (29,070) |
| Lexington-Fayette: | 7.4% (2,470) |
| Kentucky: | 4.2% (7,734) |
| Lexington-Fayette: | 6.8% (2,273) |
| Kentucky: | 7.3% (13,454) |
| Lexington-Fayette: | 4.5% (1,517) |
| Kentucky: | 1.2% (2,276) |
| Lexington-Fayette: | 4.4% (1,469) |
| Kentucky: | 1.9% (3,435) |
| Lexington-Fayette: | 3.7% (1,225) |
| Kentucky: | 2.5% (4,639) |
| Lexington-Fayette: | 2.9% (964) |
| Kentucky: | 1.2% (2,276) |
| Lexington-Fayette: | 2.8% (936) |
| Kentucky: | 1.2% (2,249) |
| Lexington-Fayette: | 2.4% (811) |
| Kentucky: | 1.6% (2,893) |
| Lexington-Fayette: | 2.3% (781) |
| Kentucky: | 0.8% (1,397) |
| Lexington-Fayette: | 2.2% (725) |
| Kentucky: | 1.5% (2,689) |
| Lexington-Fayette: | 2.1% (719) |
| Kentucky: | 1.9% (3,585) |
| Lexington-Fayette: | 1.7% (554) |
| Kentucky: | 2.3% (4,303) |
| Lexington-Fayette: | 1.6% (529) |
| Kentucky: | 3.7% (6,894) |
| Lexington-Fayette: | 1.5% (518) |
| Kentucky: | 0.6% (1,187) |
Place of birth for U.S.-born residents:
- This state: 179,503
- Other state: 103,494
- Northeast: 11,974
- Midwest: 46,437
- South: 33,802
- West: 11,281
79.7% of Lexington-Fayette residents lived in the same house 1 years ago.
Out of people who lived in different houses, 35.9% lived in this county.
Out of people who lived in different counties, 48.9% lived in Kentucky.
| Lexington-Fayette: | 79.7% |
| State average: | 87.2% |
Education attainment for males 25 years and older:
- No schooling: 1,497
- Nursery to 4th grade: 671
- 5th and 6th grade: 968
- 7th and 8th grade: 1,238
- 9th grade: 384
- 10th grade: 1,414
- 11th grade: 1,351
- 12th grade, no diploma: 1,296
- High school graduate (or equivalency): 18,948
- Less than 1 year of college: 5,507
- Some college more than 1 year, no degree: 13,039
- Associate degree: 6,015
- Bachelor's degree: 27,821
- Master's degree: 12,440
- Professional school degree: 4,500
- Doctorate degree: 5,188

Education attainment for females 25 years and older:
- No schooling: 1,432
- Nursery to 4th grade: 564
- 5th and 6th grade: 653
- 7th and 8th grade: 942
- 9th grade: 1,366
- 10th grade: 1,121
- 11th grade: 932
- 12th grade, no diploma: 820
- High school graduate (or equivalency): 18,389
- Less than 1 year of college: 5,989
- Some college more than 1 year, no degree: 14,401
- Associate degree: 10,129
- Bachelor's degree: 28,301
- Master's degree: 16,253
- Professional school degree: 3,267
- Doctorate degree: 3,258

Housing units in structures:
- One, detached: 86,482
- One, attached: 10,480
- Two: 4,243
- 3 or 4: 7,695
- 5 to 9: 9,932
- 10 to 19: 14,206
- 20 to 49: 5,831
- 50 or more: 8,657
- Mobile homes: 1,437
Median worth of mobile homes: $16,872
Housing units lacking complete kitchen facilities in 2022: 1.5%
House/condo owner moved in on average 10 years ago
Renter moved in on average 1 years ago

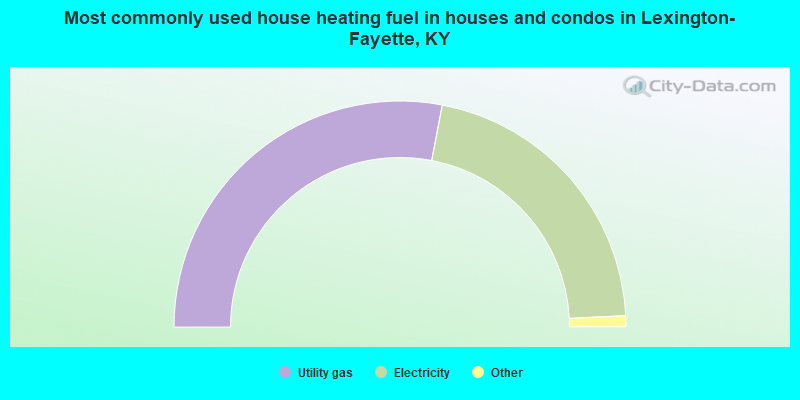
- 56.0%Utility gas
- 42.4%Electricity
- 1.0%Bottled, tank, or LP gas
- 0.2%Other fuel
- 0.1%No fuel used
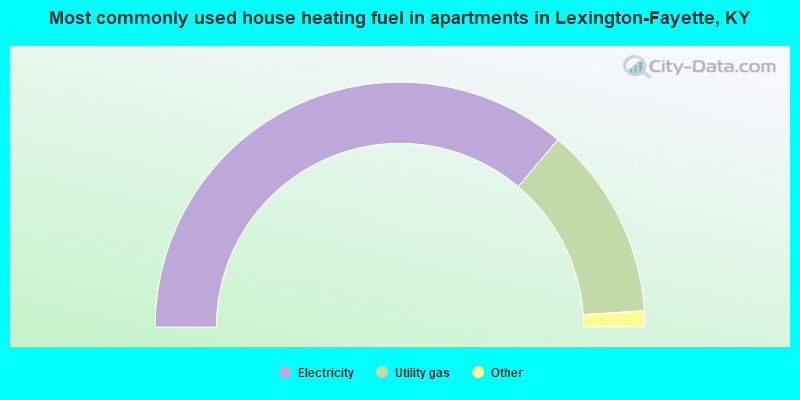
- 72.3%Electricity
- 25.6%Utility gas
- 1.2%Bottled, tank, or LP gas
- 0.6%No fuel used
- 0.2%Fuel oil, kerosene, etc.
- 0.1%Other fuel
Private vs. public school enrollment:
| Here: | 13.0% |
| Kentucky: | 17.2% |
| Here: | 13.5% |
| Kentucky: | 15.2% |
| Here: | 9.6% |
| Kentucky: | 19.6% |


