Loves Park, IL (Illinois) Houses and Residents
| Loves Park: | $152,904 |
| Illinois: | $251,600 |
Mean price in 2022:
Detached houses: $183,195
Here: $183,195 State: $310,164 Townhouses or other attached units: $167,741
Here: $167,741 State: $286,230 In 2-unit structures: $124,325
Here: $124,325 State: $299,638 In 3-to-4-unit structures: $116,503
Here: $116,503 State: $330,907 Mobile homes: $21,587
Here: $21,587 State: $78,855
Total population: 23,551 (Urban population: 19,811, Rural population: 93 (all nonfarm))
Houses: 10,163 (9,701 occupied: 6,120 owner occupied, 3,571 renter occupied)
| % of renters here: | 37% |
| State: | 33% |
Housing density: 703 houses/condos per square mile
Median price asked for vacant for-sale houses and condos in 2022: $1,262,815.
Median contract rent in 2022: $856 (lower quartile is $720, upper quartile is $974)
Median rent asked for vacant for-rent units in 2022: $778
Median gross rent in Loves Park, IL in 2022: $1,001
Housing units in Loves Park with a mortgage: 4,111 (327 second mortgage, 26 home equity loan, 299 both second mortgage and home equity loan)
Houses without a mortgage: 32
Median household income for houses/condos with a mortgage: $86,055
Median household income for apartments without a mortgage: $44,707
Median monthly housing costs: $1,021
Compare current foreclosures in Loves Park, IL:
| Photo | Address | Area | Beds / Baths | Price | Details |
|---|---|---|---|---|---|

|
#1
Orion St
Loves Park, IL 61111
|
828 sq. feet
|
1 baths 3 beds |
show details | |

|
#2
Callanish Ln
Loves Park, IL 61111
|
2,052 sq. feet
|
2 baths 3 beds |
show details | |

|
#3
Mcfarland Rd
Loves Park, IL 61111
|
- sq. feet
|
1 baths 2 beds |
show details | |

|
#4
Shale Dr
Loves Park, IL 61111
|
- sq. feet
|
- baths - beds |
show details | |

|
#5
W Hampton Ave
Loves Park, IL 61111
|
- sq. feet
|
- baths - beds |
show details | |

|
#6
Whispering Way Apt 3
Loves Park, IL 61111
|
- sq. feet
|
- baths - beds |
show details | |

|
#7
River Ln Apt 3
Loves Park, IL 61111
|
- sq. feet
|
- baths - beds |
show details | |

|
#8
Applewood Ln Apt 1
Loves Park, IL 61111
|
- sq. feet
|
- baths - beds |
show details | |

|
#9
Cobblestone Ln
Loves Park, IL 61111
|
- sq. feet
|
- baths - beds |
show details | |

|
#10
Mallet Dr
Loves Park, IL 61111
|
- sq. feet
|
- baths - beds |
show details |
| Photo | Address | Area | Beds / Baths | Price | Details |
|---|---|---|---|---|---|

|
#11
Hilltop Dr
Loves Park, IL 61111
|
- sq. feet
|
- baths - beds |
show details | |

|
#12
Flagstone Dr
Loves Park, IL 61111
|
- sq. feet
|
- baths - beds |
show details | |

|
#13
Wickford Ln
Loves Park, IL 61111
|
- sq. feet
|
- baths - beds |
show details | |

|
#14
Marble Dr
Loves Park, IL 61111
|
- sq. feet
|
- baths - beds |
show details | |

|
#15
Rockport Rd
Loves Park, IL 61111
|
- sq. feet
|
- baths - beds |
show details | |

|
#16
Pennsylvania Ave
Loves Park, IL 61111
|
- sq. feet
|
- baths - beds |
show details | |

|
#17
Winters Dr
Loves Park, IL 61111
|
- sq. feet
|
- baths - beds |
show details | |

|
#18
Nimtz Rd
Loves Park, IL 61111
|
- sq. feet
|
- baths - beds |
show details | |

|
#19
Bluff Ct
Loves Park, IL 61111
|
- sq. feet
|
- baths - beds |
show details | |

|
#20
Fenton Ln
Loves Park, IL 61111
|
- sq. feet
|
- baths - beds |
show details |
| Photo | Address | Area | Beds / Baths | Price | Details |
|---|---|---|---|---|---|

|
#21
Browns Pkwy
Loves Park, IL 61111
|
- sq. feet
|
- baths - beds |
show details | |

|
#22
Keri Dr
Loves Park, IL 61111
|
- sq. feet
|
- baths - beds |
show details | |

|
#23
Hollis Ave
Loves Park, IL 61111
|
- sq. feet
|
- baths - beds |
show details | |

|
#24
Thomas Dr
Loves Park, IL 61111
|
- sq. feet
|
- baths - beds |
show details | |

|
#25
Cedar Point Dr
Loves Park, IL 61111
|
- sq. feet
|
- baths - beds |
show details | |

|
#26
Park Ridge Rd
Loves Park, IL 61111
|
- sq. feet
|
- baths - beds |
show details | |

|
#27
Cherry Pl
Loves Park, IL 61111
|
- sq. feet
|
- baths - beds |
show details | |

|
#28
Evans Ave
Loves Park, IL 61111
|
- sq. feet
|
- baths - beds |
show details | |

|
#29
Steele Ct
Loves Park, IL 61111
|
- sq. feet
|
- baths - beds |
show details | |

|
#30
John St
Loves Park, IL 61111
|
- sq. feet
|
- baths - beds |
show details |
| Photo | Address | Area | Beds / Baths | Price | Details |
|---|---|---|---|---|---|

|
#31
Frances Ave
Loves Park, IL 61111
|
- sq. feet
|
- baths - beds |
show details | |

|
#32
Sheridan Dr
Loves Park, IL 61111
|
- sq. feet
|
- baths - beds |
show details | |

|
#33
Candlewood Ct
Loves Park, IL 61111
|
- sq. feet
|
- baths - beds |
show details | |

|
#34
Arlington St
Loves Park, IL 61111
|
- sq. feet
|
- baths - beds |
show details | |

|
#35
Edwin Ln
Loves Park, IL 61111
|
- sq. feet
|
- baths - beds |
show details | |

|
#36
Merrill Ave
Loves Park, IL 61111
|
- sq. feet
|
- baths - beds |
show details | |

|
#37
Hilltop Dr
Loves Park, IL 61111
|
- sq. feet
|
- baths - beds |
show details | |

|
#38
Windsor Ct
Loves Park, IL 61111
|
- sq. feet
|
- baths - beds |
show details | |

|
#39
Merrill Ave
Loves Park, IL 61111
|
- sq. feet
|
- baths - beds |
show details | |

|
#40
Saturn St
Loves Park, IL 61111
|
- sq. feet
|
- baths - beds |
show details |
| Photo | Address | Area | Beds / Baths | Price | Details |
|---|---|---|---|---|---|

|
#41
Basin Dr
Loves Park, IL 61111
|
- sq. feet
|
- baths - beds |
show details | |

|
#42
Windy Knoll Dr
Loves Park, IL 61111
|
- sq. feet
|
- baths - beds |
show details | |

|
#43
Kissane Dr
Loves Park, IL 61111
|
- sq. feet
|
- baths - beds |
show details | |

|
#44
Mesa St
Loves Park, IL 61111
|
- sq. feet
|
- baths - beds |
show details | |

|
#45
Windswept Way
Loves Park, IL 61111
|
- sq. feet
|
- baths - beds |
show details | |

|
#46
Audree Ln # 1
Loves Park, IL 61111
|
- sq. feet
|
- baths - beds |
show details | |

|
#47
Mabels Way
Loves Park, IL 61111
|
- sq. feet
|
- baths - beds |
show details | |

|
#48
Rose Ave
Loves Park, IL 61111
|
- sq. feet
|
- baths - beds |
show details | |

|
#49
Merrill Ave
Loves Park, IL 61111
|
- sq. feet
|
- baths - beds |
show details | |

|
Check over 1 million property listings on Foreclosure.com!
|
browse all offers | |||


 | Live in Chicagoland, Work in Rockford (26 replies) |
| Best metro areas outside of Chicago? (Illinois)? *DEBATE* (32 replies) |
| Considering move to Rockford, Freeport area (11 replies) |
| Roscoe? (2 replies) |
| Young Professional moving to Rockford Region (1 reply) |
| Belvidere / Roscoe area vs Huntley-Family friendly?? (3 replies) |

Median year apartment built: 1982
Household type by relationship:
Households: 22,741- Male householders: 4,545 (1,407 living alone), Female householders: 5,077 (1,724 living alone)
3,940 spouses (3,883 opposite-sex spouses), 895 unmarried partners, (869 opposite-sex unmarried partners), 6,125 children (5,872 natural, 132 adopted, 119 stepchildren), 568 grandchildren, 234 brothers or sisters, 175 parents, 39 foster children, 199 other relatives, 778 non-relatives
- In group quarters: 160
Size of family households: 2,622 2-persons, 1,633 3-persons, 884 4-persons, 426 5-persons, 101 6-persons, 41 7-or-more-persons.
Size of nonfamily households: 3,259 1-person, 702 2-persons, 36 3-persons, 30 4-persons.
2,509 married couples with children.
1,775 single-parent households (532 men, 1,243 women).
87.7% of residents of Loves Park speak English at home.
5.5% of residents speak Spanish at home (60% speak English very well, 20% speak English well, 17% speak English not well, 3% don't speak English at all).
4.7% of residents speak other Indo-European language at home (83% speak English very well, 13% speak English well, 3% speak English not well).
1.8% of residents speak Asian or Pacific Island language at home (50% speak English very well, 27% speak English well, 14% speak English not well, 9% don't speak English at all).
0.1% of residents speak other language at home (5% speak English very well, 95% speak English well).
Foreign born population: 1,617 (7.1%)
(37.0% of them are naturalized citizens)
| Here: | 6.2 |
| State: | 6.4 |
| Here: | 4.4 |
| State: | 4.1 |

- Bedrooms in owner-occupied houses and condos in Loves Park, Illinois
- 29no bedroom
- 621 bedroom
- 1,8072 bedrooms
- 2,9453 bedrooms
- 1,0174 bedrooms
- 2625+ bedrooms

- Bedrooms in renter-occupied apartments in Loves Park, Illinois
- 38no bedroom
- 3481 bedroom
- 2,2432 bedrooms
- 7753 bedrooms
- 1324 bedrooms
- 365+ bedrooms

- Cars and other vehicles available in Loves Park in owner-occupied houses/condos
- 219no vehicle
- 1,8281 vehicle
- 2,7232 vehicles
- 9863 vehicles
- 3024 vehicles
- 645+ vehicles

- Cars and other vehicles available in Loves Park in renter-occupied apartments
- 381no vehicle
- 1,6561 vehicle
- 1,3072 vehicles
- 1793 vehicles
- 394 vehicles
- 95+ vehicles

- Rooms in owner-occupied houses in Loves Park, Illinois
- 291 room
- 242 rooms
- 2253 rooms
- 5844 rooms
- 1,4215 rooms
- 1,3026 rooms
- 9157 rooms
- 5988 rooms
- 1,0239+ rooms

- Rooms in renter-occupied apartments in Loves Park, Illinois
- 381 room
- 672 rooms
- 3383 rooms
- 1,4414 rooms
- 7985 rooms
- 5036 rooms
- 1947 rooms
- 748 rooms
- 1199+ rooms


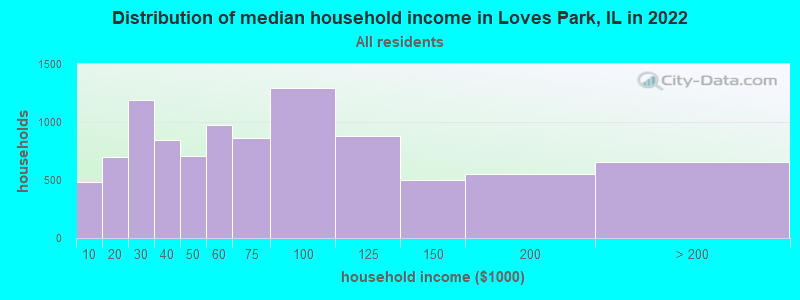
Loves Park, IL household income distribution

- 483Less than $10,000
- 698$10,000 to $19,999
- 1,187$20,000 to $29,999
- 848$30,000 to $39,999
- 708$40,000 to $49,999
- 974$50,000 to $59,999
- 865$60,000 to $74,999
- 1,293$75,000 to $99,999
- 880$100,000 to $124,999
- 498$125,000 to $149,999
- 553$150,000 to $199,999
- 654$200,000 or more
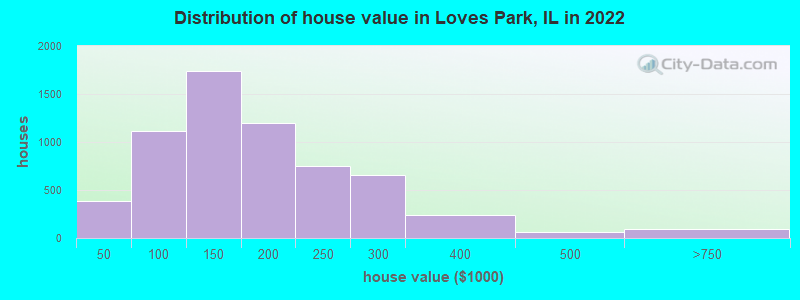
Home value of owner - occupied houses in 2022 in Loves Park, IL
-
- 230Less than $10,000
- 37$10,000 to $14,999
- 4$20,000 to $24,999
- 12$25,000 to $29,999
- 37$30,000 to $34,999
- 62$40,000 to $49,999
- 53$50,000 to $59,999
- 62$60,000 to $69,999
- 165$70,000 to $79,999
- 407$80,000 to $89,999
- 365$90,000 to $99,999
- 856$100,000 to $124,999
- 881$125,000 to $149,999
- 649$150,000 to $174,999
- 546$175,000 to $199,999
- 752$200,000 to $249,999
- 660$250,000 to $299,999
- 237$300,000 to $399,999
- 62$400,000 to $499,999
- 58$500,000 to $749,999
- 23$750,000 to $999,999
- 6$1,500,000 to $1,999,999
Rent paid by renters in 2022 in Loves Park, IL
-
- 37$100 to $149
- 10$150 to $199
- 8$200 to $249
- 18$250 to $299
- 55$300 to $349
- 14$350 to $399
- 52$400 to $449
- 57$450 to $499
- 39$500 to $549
- 102$550 to $599
- 94$600 to $649
- 216$650 to $699
- 320$700 to $749
- 332$750 to $799
- 819$800 to $899
- 501$900 to $999
- 515$1,000 to $1,249
- 82$1,250 to $1,499
- 154$1,500 to $1,999
- 73No cash rent

Percentage of workers working in this county: 83.0%
Number of people working at home: 980 (9.1% of all workers)
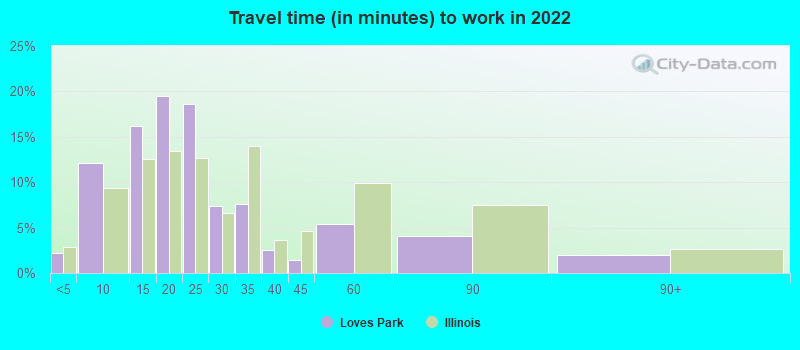
Travel time to work (commute)
- Less than 5 minutes: 385
- 5 to 9 minutes: 960
- 10 to 14 minutes: 1,746
- 15 to 19 minutes: 1,797
- 20 to 24 minutes: 2,173
- 25 to 29 minutes: 1,006
- 30 to 34 minutes: 576
- 35 to 39 minutes: 138
- 40 to 44 minutes: 145
- 45 to 59 minutes: 201
- 60 to 89 minutes: 527
- 90 or more minutes: 195
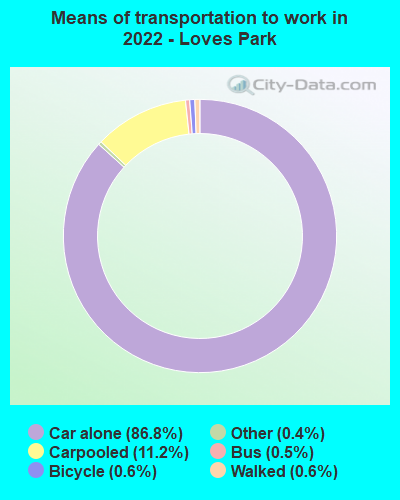
Means of transportation to work:
- Drove a car alone: 10,704 (78.9%)
- Carpooled: 1,414 (10.4%)
- Bus: 51 (0.4%)
- Taxi: 83 (0.6%)
- Bicycle: 90 (0.7%)
- Walked: 56 (0.4%)
- Worked at home: 980 (7.2%)
- Unemployment by race in 2022
- Unemployment rate for White non-Hispanic residents
- 5.7%Males
- 2.7%Females
- Unemployment rate for Black residents
- 15.0%Males
- 13.5%Females
- Unemployment rate for Asian residents
- 6.7%Females
- Unemployment rate for other race residents
- 42.3%Females
- Unemployment rate for two or more race residents
- 16.4%Males
- 0.9%Females
- Unemployment rate for Hispanic or Latino residents
- 20.9%Males
- 10.7%Females

- Year of entry for the foreign-born population in Loves Park, Illinois
- 9142010 or later
- 2432000 to 2009
- 5571990 to 1999
- 1561980 to 1989
- 1141970 to 1979
- 151Before 1970

First ancestries reported:
- German: 1,524 (16.0%)
- Irish: 758 (8.0%)
- American: 631 (6.6%)
- Swedish: 575 (6.1%)
- Italian: 552 (5.8%)
- English: 453 (4.8%)
- Ukrainian: 341 (3.6%)
- Polish: 229 (2.4%)
- Serbian: 203 (2.1%)
- European: 139 (1.5%)
- Norwegian: 103 (1.1%)
- Scottish: 65 (0.7%)
- Egyptian: 51 (0.5%)
- Dutch: 51 (0.5%)
- French Canadian: 51 (0.5%)
- Czech: 50 (0.5%)
- Yugoslavian: 48 (0.5%)
- Welsh: 45 (0.5%)
- British: 24 (0.3%)
- Eastern European: 21 (0.2%)
- Scandinavian: 21 (0.2%)
- French: 19 (0.2%)
- African: 17 (0.2%)
- Russian: 12 (0.1%)
- Bulgarian: 10 (0.1%)
- Turkish: 10 (0.1%)
- Hungarian: 8 (0.08%)
- Czechoslovakian: 7 (0.07%)
- Austrian: 6 (0.06%)
- Danish: 6 (0.06%)
- Finnish: 6 (0.06%)
- Croatian: 1 (0.01%)
- Kenyan: 1 (0.01%)
Most common places of birth for foreign-born residents (%):
| Loves Park: | 18.3% (337) |
| Illinois: | 1.6% (29,316) |
| Loves Park: | 12.0% (221) |
| Illinois: | 9.2% (166,409) |
| Loves Park: | 11.0% (203) |
| Illinois: | 34.7% (626,958) |
| Loves Park: | 7.9% (146) |
| Illinois: | 5.2% (93,003) |
| Loves Park: | 6.5% (120) |
| Illinois: | 0.5% (8,574) |
| Loves Park: | 6.5% (120) |
| Illinois: | 4.1% (74,364) |
| Loves Park: | 6.1% (112) |
| Illinois: | 0.5% (9,688) |
| Loves Park: | 5.8% (107) |
| Illinois: | 0.6% (10,776) |
| Loves Park: | 5.3% (97) |
| Illinois: | 1.1% (19,306) |
| Loves Park: | 4.1% (75) |
| Illinois: | 1.0% (18,753) |
| Loves Park: | 3.2% (59) |
| Illinois: | 0.1% (2,017) |
| Loves Park: | 3.0% (56) |
| Illinois: | 6.9% (124,474) |
| Loves Park: | 1.7% (31) |
| Illinois: | 0.3% (5,762) |
| Loves Park: | 1.7% (31) |
| Illinois: | 1.3% (22,793) |
Place of birth for U.S.-born residents:
- This state: 16,044
- Other state: 4,914
- Northeast: 283
- Midwest: 2,508
- South: 1,390
- West: 727
88.0% of Loves Park residents lived in the same house 1 years ago.
Out of people who lived in different houses, 38.1% lived in this county.
Out of people who lived in different counties, 62.2% lived in Illinois.
| Loves Park: | 88.0% |
| State average: | 88.3% |
Education attainment for males 25 years and older:
- No schooling: 87
- Nursery to 4th grade: 4
- 5th and 6th grade: 26
- 7th and 8th grade: 11
- 9th grade: 47
- 10th grade: 224
- 11th grade: 109
- 12th grade, no diploma: 122
- High school graduate (or equivalency): 2,554
- Less than 1 year of college: 534
- Some college more than 1 year, no degree: 1,075
- Associate degree: 746
- Bachelor's degree: 1,038
- Master's degree: 556
- Professional school degree: 294
- Doctorate degree: 55

Education attainment for females 25 years and older:
- No schooling: 5
- Nursery to 4th grade: 53
- 5th and 6th grade: 4
- 7th and 8th grade: 26
- 9th grade: 59
- 10th grade: 159
- 11th grade: 155
- 12th grade, no diploma: 212
- High school graduate (or equivalency): 2,335
- Less than 1 year of college: 588
- Some college more than 1 year, no degree: 1,433
- Associate degree: 735
- Bachelor's degree: 1,798
- Master's degree: 490
- Professional school degree: 137
- Doctorate degree: 43


Housing units in structures:
- One, detached: 5,962
- One, attached: 865
- Two: 256
- 3 or 4: 1,573
- 5 to 9: 480
- 10 to 19: 119
- 20 to 49: 103
- 50 or more: 415
- Mobile homes: 384
Median worth of mobile homes: $12,126
Housing units lacking complete kitchen facilities in 2022: 1.5%
House/condo owner moved in on average 10 years ago
Renter moved in on average 3 years ago

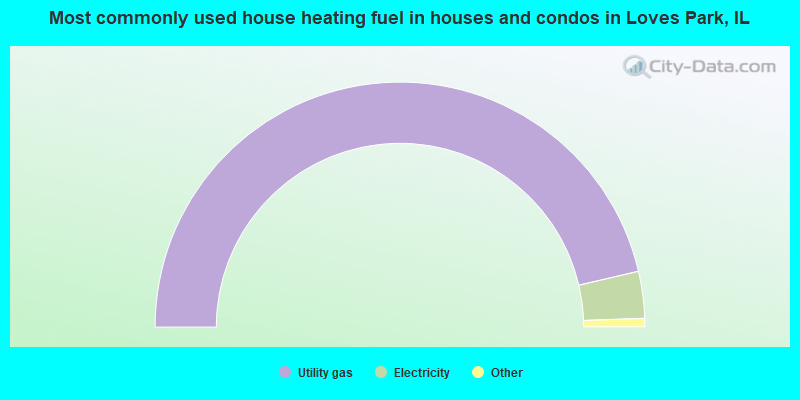
- 92.7%Utility gas
- 6.2%Electricity
- 0.4%Bottled, tank, or LP gas
- 0.4%Wood
- 0.2%Solar energy
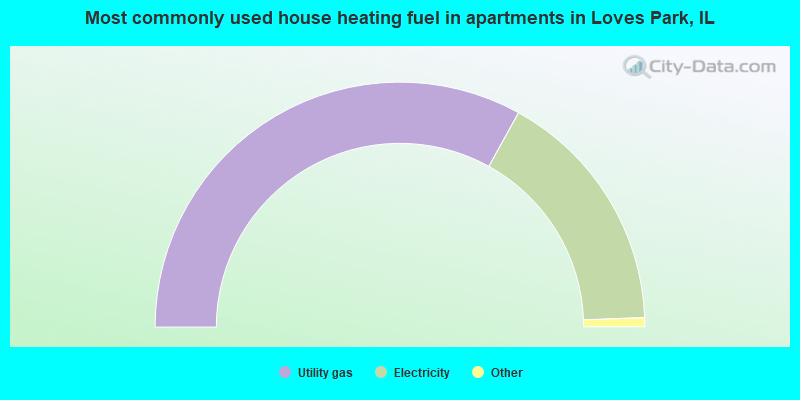
- 66.1%Utility gas
- 32.7%Electricity
- 0.6%Fuel oil, kerosene, etc.
- 0.6%Bottled, tank, or LP gas
Private vs. public school enrollment:
| Here: | 15.9% |
| Illinois: | 13.3% |
| Here: | 26.1% |
| Illinois: | 9.9% |
| Here: | 25.3% |
| Illinois: | 27.4% |


