Lower Valley-Somers, MT (Montana) Houses and Residents
| Lower Valley-Somers: | $672,444 |
| Montana: | $366,400 |
Total population: 4,585 (Urban population: 0, Rural population: 3,929 (185 farm, 3,744 nonfarm))
Houses: 2,116 (1,646 occupied: 1,298 owner occupied, 348 renter occupied)
| % of renters here: | 21% |
| State: | 31% |
Housing density: 22 houses/condos per square mile
Median price asked for vacant for-sale houses and condos in 2022 in this county: $499,230.
Median contract rent in 2022: $1,097 (lower quartile is $653, upper quartile is $1,633)
Median rent asked for vacant for-rent units in 2022: $1,141
Median gross rent in Lower Valley-Somers, MT in 2022: $1,260
Housing units in Lower Valley-Somers with a mortgage: 494 (39 second mortgage, 37 home equity loan, 0 both second mortgage and home equity loan)
Houses without a mortgage: 331


Household type by relationship:
Households: 89,936- In family households: 74,194 (18,450 male householders, 6,367 female householders)
19,788 spouses, 24,416 children (22,276 natural, 743 adopted, 1,397 stepchildren), 1,200 grandchildren, 557 brothers or sisters, 525 parents, foster children, 484 other relatives, 1,984 non-relatives
- In nonfamily households: 15,742 (6,285 male householders (4,852 living alone)), 6,402 female householders (5,352 living alone)), 3,055 nonrelatives
- In group quarters: 992 (586 institutionalized population)
14,090 married couples with children.
3,969 single-parent households (1,180 men, 2,789 women).
95.7% of residents of Lower Valley-Somers speak English at home.
2.0% of residents speak Spanish at home (75% speak English very well, 15% speak English well, 10% speak English not well).
2.0% of residents speak other Indo-European language at home (80% speak English very well, 20% speak English well).
0.3% of residents speak Asian or Pacific Island language at home (50% speak English very well, 50% speak English well).
Foreign born population: 207 (3.5%)
(29.5% of them are naturalized citizens)
| Here: | 7.3 |
| State: | 6.4 |
| Here: | 4.1 |
| State: | 4.2 |

- Bedrooms in owner-occupied houses and condos in Lower Valley-Somers, Montana
- 0no bedroom
- 671 bedroom
- 2992 bedrooms
- 6323 bedrooms
- 2354 bedrooms
- 655+ bedrooms

- Bedrooms in renter-occupied apartments in Lower Valley-Somers, Montana
- 13no bedroom
- 471 bedroom
- 1082 bedrooms
- 1373 bedrooms
- 344 bedrooms
- 95+ bedrooms

- Cars and other vehicles available in Lower Valley-Somers in owner-occupied houses/condos
- 58no vehicle
- 2551 vehicle
- 5542 vehicles
- 3263 vehicles
- 584 vehicles
- 475+ vehicles

- Cars and other vehicles available in Lower Valley-Somers in renter-occupied apartments
- 10no vehicle
- 1231 vehicle
- 1572 vehicles
- 523 vehicles
- 04 vehicles
- 65+ vehicles

- Rooms in owner-occupied houses in Lower Valley-Somers, Montana
- 01 room
- 192 rooms
- 173 rooms
- 1634 rooms
- 3035 rooms
- 2936 rooms
- 2587 rooms
- 1278 rooms
- 1189+ rooms

- Rooms in renter-occupied apartments in Lower Valley-Somers, Montana
- 41 room
- 132 rooms
- 233 rooms
- 914 rooms
- 1175 rooms
- 276 rooms
- 357 rooms
- 298 rooms
- 99+ rooms


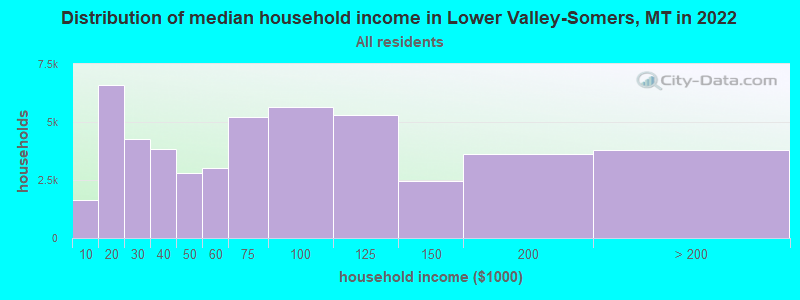
Lower Valley-Somers, MT household income distribution

- 1,655Less than $10,000
- 6,581$10,000 to $19,999
- 4,262$20,000 to $29,999
- 3,828$30,000 to $39,999
- 2,797$40,000 to $49,999
- 2,997$50,000 to $59,999
- 5,201$60,000 to $74,999
- 5,632$75,000 to $99,999
- 5,310$100,000 to $124,999
- 2,450$125,000 to $149,999
- 3,606$150,000 to $199,999
- 3,810$200,000 or more
Percentage of workers working in this county: 95.6%
Number of people working at home: 308 (14.7% of all workers)
Travel time to work (commute)
- Less than 5 minutes: 112
- 5 to 9 minutes: 107
- 10 to 14 minutes: 150
- 15 to 19 minutes: 220
- 20 to 24 minutes: 341
- 25 to 29 minutes: 126
- 30 to 34 minutes: 296
- 35 to 39 minutes: 38
- 40 to 44 minutes: 25
- 45 to 59 minutes: 43
- 60 to 89 minutes: 43
- 90 or more minutes: 45
Means of transportation to work:
- Drove a car alone: 1,258 (74.7%)
- Carpooled: 177 (10.5%)
- Bus or trolley bus: 5 (0.3%)
- Motorcycle: 6 (0.4%)
- Walked: 95 (5.6%)
- Other means: 5 (0.3%)
- Worked at home: 137 (8.1%)


- Year of entry for the foreign-born population in Lower Valley-Somers, Montana
- 551995 to March 2000
- 71990 to 1994
- 01985 to 1989
- 61980 to 1984
- 01975 to 1979
- 61970 to 1974
- 01965 to 1969
- 40Before 1965
Most common places of birth for foreign-born residents (%):
| Lower Valley-Somers: | 43.0% (49) |
| Montana: | 27.8% (4,550) |
| Lower Valley-Somers: | 17.5% (20) |
| Montana: | 7.3% (1,205) |
| Lower Valley-Somers: | 10.5% (12) |
| Montana: | 4.7% (770) |
| Lower Valley-Somers: | 8.8% (10) |
| Montana: | 10.7% (1,750) |
| Lower Valley-Somers: | 7.0% (8) |
| Montana: | 2.8% (465) |
| Lower Valley-Somers: | 7.0% (8) |
| Montana: | 5.4% (880) |
| Lower Valley-Somers: | 3.5% (4) |
| Montana: | 1.5% (251) |
| Lower Valley-Somers: | 2.6% (3) |
| Montana: | 0.9% (150) |
Place of birth for U.S.-born residents:
- This state: 1,662
- Other state: 2,124
- Northeast: 198
- Midwest: 707
- South: 217
- West: 1,002
53% of Lower Valley-Somers residents lived in the same house 5 years ago.
Out of people who lived in different houses, 38% lived in this county.
Out of people who lived in different counties, 21% lived in Montana.
Education attainment for males 25 years and older:
- No schooling: 0
- Nursery to 4th grade: 0
- 5th and 6th grade: 7
- 7th and 8th grade: 13
- 9th grade: 16
- 10th grade: 41
- 11th grade: 19
- 12th grade, no diploma: 36
- High school graduate (or equivalency): 420
- Less than 1 year of college: 117
- Some college more than 1 year, no degree: 228
- Associate degree: 68
- Bachelor's degree: 304
- Master's degree: 64
- Professional school degree: 34
- Doctorate degree: 17

Education attainment for females 25 years and older:
- No schooling: 0
- Nursery to 4th grade: 0
- 5th and 6th grade: 0
- 7th and 8th grade: 36
- 9th grade: 20
- 10th grade: 15
- 11th grade: 41
- 12th grade, no diploma: 60
- High school graduate (or equivalency): 412
- Less than 1 year of college: 106
- Some college more than 1 year, no degree: 252
- Associate degree: 118
- Bachelor's degree: 287
- Master's degree: 75
- Professional school degree: 7
- Doctorate degree: 0


Housing units in structures:
- One, detached: 1,686
- One, attached: 38
- Two: 60
- 3 or 4: 30
- 5 to 9: 8
- Mobile homes: 294
Median worth of mobile homes: $84,897
Housing units lacking complete kitchen facilities: 1.1%


- 30.1%Electricity
- 29.0%Bottled, tank, or LP gas
- 17.0%Wood
- 16.6%Utility gas
- 4.5%Fuel oil, kerosene, etc.
- 1.8%Other fuel
- 0.8%No fuel used

- 31.6%Electricity
- 25.6%Bottled, tank, or LP gas
- 22.1%Wood
- 15.2%Utility gas
- 4.0%Fuel oil, kerosene, etc.
- 1.4%Other fuel
Private vs. public school enrollment:
| Here: | 7.4% |
| Montana: | 7.4% |
| Here: | 12.1% |
| Montana: | 6.1% |
| Here: | 10.9% |
| Montana: | 11.5% |


