Luray, VA (Virginia) Houses and Residents
| Luray: | $235,477 |
| Virginia: | $365,700 |
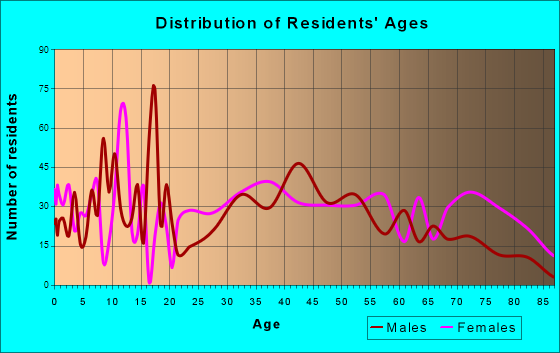
Total population: 4,850 (Urban population: 4,811 (all inside urban clusters), Rural population: 68 (all nonfarm))
Houses: 2,750 (2,371 occupied: 1,580 owner occupied, 816 renter occupied)
| % of renters here: | 34% |
| State: | 33% |
Housing density: 580 houses/condos per square mile
Median price asked for vacant for-sale houses and condos in 2022: $1,127,232.
Median contract rent in 2022: $666 (lower quartile is $544, upper quartile is $740)
Median rent asked for vacant for-rent units in 2022: $730
Median gross rent in Luray, VA in 2022: $834
Housing units in Luray with a mortgage: 740 (60 second mortgage, 0 home equity loan, 59 both second mortgage and home equity loan)
Houses without a mortgage: 0
Median household income for houses/condos with a mortgage: $64,429
Median household income for apartments without a mortgage: $51,274
Median monthly housing costs: $809
Compare current foreclosures near Luray, VA:
| Photo | Address | Area | Beds / Baths | Price | Details |
|---|---|---|---|---|---|

|
#1
Eden Rd
Luray, VA 22835
|
1,383 sq. feet
|
1 baths 3 beds |
show details | |

|
#2
Vaughn Summit Rd
Luray, VA 22835
|
1,344 sq. feet
|
1 baths 3 beds |
show details | |

|
#3
Frye Ln
Luray, VA 22835
|
1,328 sq. feet
|
1 baths 3 beds |
show details | |

|
#4
Furnace Rd
Luray, VA 22835
|
1,402 sq. feet
|
1 baths 3 beds |
show details | |

|
#5
Janie Ln
Luray, VA 22835
|
3,166 sq. feet
|
3 baths 3 beds |
show details | |

|
#6
Mount View Ave
Luray, VA 22835
|
1,404 sq. feet
|
3 baths 3 beds |
show details | |

|
#7
N Hawksbill St Apt A
Luray, VA 22835
|
- sq. feet
|
- baths - beds |
show details | |

|
#8
1st St Apt 1b
Luray, VA 22835
|
- sq. feet
|
- baths - beds |
show details | |

|
#9
Us Highway 211 W
Luray, VA 22835
|
- sq. feet
|
- baths - beds |
show details | |

|
#10
Allison Dr
Luray, VA 22835
|
- sq. feet
|
- baths - beds |
show details |
| Photo | Address | Area | Beds / Baths | Price | Details |
|---|---|---|---|---|---|

|
#11
Us Highway 211 W
Luray, VA 22835
|
- sq. feet
|
- baths - beds |
show details | |

|
#12
Blue Ridge Ct
Luray, VA 22835
|
- sq. feet
|
- baths - beds |
show details | |

|
#13
Brush Mountain Rd
Bentonville, VA 22610
|
1,178 sq. feet
|
2 baths 3 beds |
show details | |

|
#14
S 2nd St
Shenandoah, VA 22849
|
1,341 sq. feet
|
1 baths 4 beds |
show details | |

|
#15
Jackson St
Edinburg, VA 22824
|
1,125 sq. feet
|
2 baths 2 beds |
show details | |

|
#16
Gooney Manor Loop
Bentonville, VA 22610
|
1,554 sq. feet
|
2 baths 2 beds |
show details | |

|
#17
Evergreen Valley Rd
Timberville, VA 22853
|
2,235 sq. feet
|
1 baths 3 beds |
show details | |

|
#18
Plauger Ln
Fort Valley, VA 22652
|
1,344 sq. feet
|
2 baths 3 beds |
show details | |

|
#19
Stonewall Jackson Hwy
Bentonville, VA 22610
|
2,600 sq. feet
|
1 baths 3 beds |
show details | |

|
#20
Pilgrims Way
Bentonville, VA 22610
|
2,131 sq. feet
|
2 baths 3 beds |
show details |
| Photo | Address | Area | Beds / Baths | Price | Details |
|---|---|---|---|---|---|

|
#21
Greenhill Ln
Edinburg, VA 22824
|
1,176 sq. feet
|
1 baths 3 beds |
show details | |

|
#22
Roland Rd
Woodstock, VA 22664
|
1,616 sq. feet
|
2 baths 3 beds |
show details | |

|
#23
Tower Ave
Woodstock, VA 22664
|
1,044 sq. feet
|
2 baths 3 beds |
show details | |

|
#24
Waterbrook Ct
Woodstock, VA 22664
|
1,560 sq. feet
|
2 baths 3 beds |
show details | |

|
#25
Conicville Rd
Mount Jackson, VA 22842
|
1,768 sq. feet
|
3 baths 4 beds |
show details | |

|
#26
Birchwood Dr
Woodstock, VA 22664
|
1,854 sq. feet
|
3 baths 4 beds |
show details | |

|
#27
Swan Dr
Mount Jackson, VA 22842
|
912 sq. feet
|
1 baths 2 beds |
show details | |

|
#28
Smith Run Rd
Bentonville, VA 22610
|
1,650 sq. feet
|
2 baths 3 beds |
show details | |

|
#29
Hunter Ln
Edinburg, VA 22824
|
1,344 sq. feet
|
1 baths 3 beds |
show details | |

|
#30
S Church St
Woodstock, VA 22664
|
2,296 sq. feet
|
3 baths 3 beds |
show details |
| Photo | Address | Area | Beds / Baths | Price | Details |
|---|---|---|---|---|---|

|
#31
River View Pl
Shenandoah, VA 22849
|
1,344 sq. feet
|
2 baths 3 beds |
show details | |

|
#32
Cave Ln
Broadway, VA 22815
|
1,627 sq. feet
|
2 baths 2 beds |
show details | |

|
#33
Us Hwy 340n
Rileyville, VA 22650
|
779 sq. feet
|
1 baths 3 beds |
show details | |

|
#34
Headley Rd
Maurertown, VA 22644
|
1,000 sq. feet
|
2 baths 1 beds |
show details | |

|
#35
Aylor Grubbs Ave
Stanley, VA 22851
|
747 sq. feet
|
1 baths 2 beds |
show details | |

|
#36
Farmview Rd
Stanley, VA 22851
|
1,214 sq. feet
|
2 baths 3 beds |
show details | |

|
#37
Pheasant Lane Rd # C3
Woodstock, VA 22664
|
- sq. feet
|
- baths - beds |
show details | |

|
#38
Lizard Hill Rd
Shenandoah, VA 22849
|
- sq. feet
|
- baths - beds |
show details | |

|
#39
Jewell Ln
Edinburg, VA 22824
|
- sq. feet
|
- baths - beds |
show details | |

|
#40
Conicville Rd
Mount Jackson, VA 22842
|
- sq. feet
|
- baths - beds |
show details |
| Photo | Address | Area | Beds / Baths | Price | Details |
|---|---|---|---|---|---|

|
#41
Sunnyside Orchard Ln
Washington, VA 22747
|
- sq. feet
|
- baths - beds |
show details | |

|
#42
Thornton Gap Church Rd
Sperryville, VA 22740
|
- sq. feet
|
- baths - beds |
show details | |

|
#43
Senedo Rd
Quicksburg, VA 22847
|
- sq. feet
|
- baths - beds |
show details | |

|
#44
Locustdale Loop
Shenandoah, VA 22849
|
- sq. feet
|
- baths - beds |
show details | |

|
#45
Brayden Ln
Bentonville, VA 22610
|
- sq. feet
|
- baths - beds |
show details | |

|
#46
Fairway Dr
New Market, VA 22844
|
- sq. feet
|
- baths - beds |
show details | |

|
#47
Confederate St
New Market, VA 22844
|
- sq. feet
|
- baths - beds |
show details | |

|
#48
Cadet Rd Apt C
New Market, VA 22844
|
- sq. feet
|
- baths - beds |
show details | |

|
#49
S Congress St # 106c
New Market, VA 22844
|
- sq. feet
|
- baths - beds |
show details | |

|
Check over 1 million property listings on Foreclosure.com!
|
browse all offers | |||

Latest news about housing in Luray, VA collected exclusively by city-data.com from local newspapers, TV, and radio stations


Median year apartment built: 1960
Household type by relationship:
Households: 4,871- Male householders: 936 (385 living alone), Female householders: 1,412 (707 living alone)
878 spouses (878 opposite-sex spouses), 136 unmarried partners, (136 opposite-sex unmarried partners), 989 children (944 natural, 21 adopted, 24 stepchildren), 95 grandchildren, 11 brothers or sisters, 20 parents, 0 foster children, 85 other relatives, 91 non-relatives
- In group quarters: 212
Size of family households: 811 2-persons, 204 3-persons, 83 4-persons, 55 5-persons, 37 6-persons.
Size of nonfamily households: 1,124 1-person, 74 2-persons, 17 5-persons.
394 married couples with children.
215 single-parent households (0 men, 215 women).
97.5% of residents of Luray speak English at home.
2.8% of residents speak Spanish at home (41% speak English very well, 21% speak English well, 38% speak English not well).
0.1% of residents speak Asian or Pacific Island language at home (100% speak English very well).
Foreign born population: 25 (0.5%)
(104.0% of them are naturalized citizens)
| Here: | 6.9 |
| State: | 7.0 |
| Here: | 5.1 |
| State: | 4.3 |

- Bedrooms in owner-occupied houses and condos in Luray, Virginia
- 17no bedroom
- 01 bedroom
- 1782 bedrooms
- 9823 bedrooms
- 2784 bedrooms
- 1245+ bedrooms

- Bedrooms in renter-occupied apartments in Luray, Virginia
- 10no bedroom
- 761 bedroom
- 3622 bedrooms
- 3483 bedrooms
- 214 bedrooms
- 05+ bedrooms

- Cars and other vehicles available in Luray in owner-occupied houses/condos
- 120no vehicle
- 4551 vehicle
- 6592 vehicles
- 2043 vehicles
- 1154 vehicles
- 275+ vehicles

- Cars and other vehicles available in Luray in renter-occupied apartments
- 100no vehicle
- 4571 vehicle
- 1642 vehicles
- 543 vehicles
- 414 vehicles
- 05+ vehicles

- Rooms in owner-occupied houses in Luray, Virginia
- 171 room
- 02 rooms
- 03 rooms
- 174 rooms
- 2265 rooms
- 3896 rooms
- 3337 rooms
- 1958 rooms
- 4029+ rooms

- Rooms in renter-occupied apartments in Luray, Virginia
- 101 room
- 132 rooms
- 633 rooms
- 1504 rooms
- 2475 rooms
- 1776 rooms
- 1117 rooms
- 298 rooms
- 179+ rooms


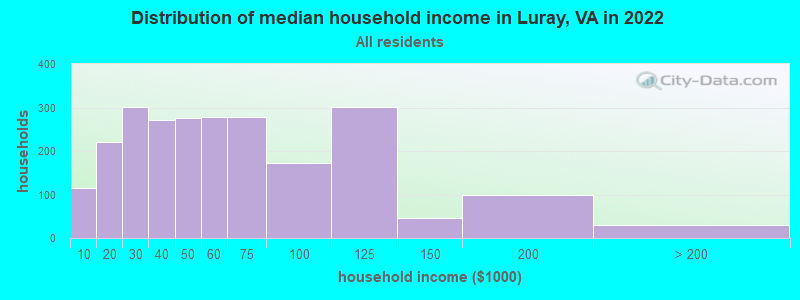
Luray, VA household income distribution

- 116Less than $10,000
- 221$10,000 to $19,999
- 301$20,000 to $29,999
- 272$30,000 to $39,999
- 277$40,000 to $49,999
- 279$50,000 to $59,999
- 278$60,000 to $74,999
- 173$75,000 to $99,999
- 302$100,000 to $124,999
- 45$125,000 to $149,999
- 99$150,000 to $199,999
- 30$200,000 or more
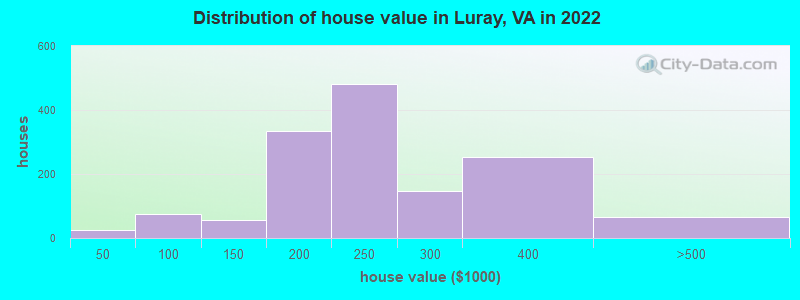
Home value of owner - occupied houses in 2022 in Luray, VA
-
- 16$15,000 to $19,999
- 10$20,000 to $24,999
- 41$80,000 to $89,999
- 32$90,000 to $99,999
- 21$100,000 to $124,999
- 34$125,000 to $149,999
- 174$150,000 to $174,999
- 158$175,000 to $199,999
- 481$200,000 to $249,999
- 147$250,000 to $299,999
- 253$300,000 to $399,999
- 65$400,000 to $499,999
Rent paid by renters in 2022 in Luray, VA
-
- 49$300 to $349
- 22$450 to $499
- 119$500 to $549
- 27$550 to $599
- 126$600 to $649
- 56$650 to $699
- 144$700 to $749
- 15$750 to $799
- 43$800 to $899
- 12$900 to $999
- 7$1,000 to $1,249
- 32$1,250 to $1,499
- 10$2,500 to $2,999
- 143No cash rent


Percentage of workers working in this county: 82.0%
Number of people working at home: 190 (8.3% of all workers)
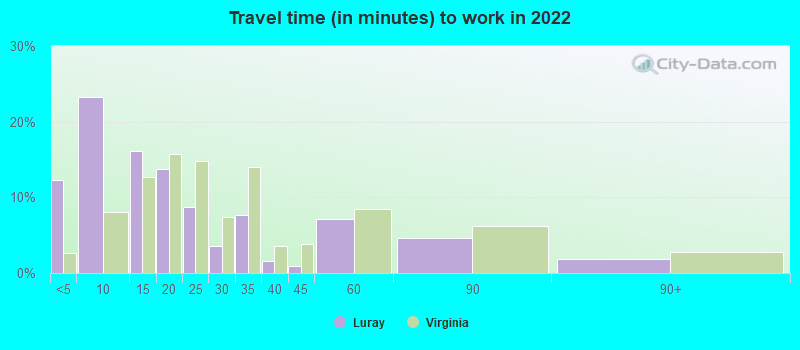
Travel time to work (commute)
- Less than 5 minutes: 391
- 5 to 9 minutes: 552
- 10 to 14 minutes: 238
- 15 to 19 minutes: 191
- 20 to 24 minutes: 54
- 25 to 29 minutes: 130
- 30 to 34 minutes: 64
- 35 to 39 minutes: 0
- 40 to 44 minutes: 27
- 45 to 59 minutes: 175
- 60 to 89 minutes: 155
- 90 or more minutes: 74
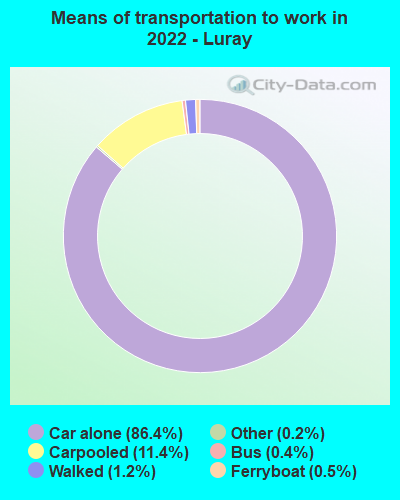
Means of transportation to work:
- Drove a car alone: 3,024 (79.1%)
- Carpooled: 406 (10.6%)
- Bus: 9 (0.2%)
- Ferryboat: 17 (0.4%)
- Taxi: 8 (0.2%)
- Walked: 43 (1.1%)
- Worked at home: 190 (5.0%)

- Unemployment by race in 2022
- Unemployment rate for White non-Hispanic residents
- 1.9%Males
- 5.0%Females
- Unemployment rate for Black residents
- 39.2%Males

- Year of entry for the foreign-born population in Luray, Virginia
- 02010 or later
- 02000 to 2009
- 51990 to 1999
- 281980 to 1989
- 241970 to 1979
- 34Before 1970

First ancestries reported:
- American: 619 (28.5%)
- English: 423 (19.5%)
- German: 406 (18.7%)
- Irish: 171 (7.9%)
- European: 56 (2.6%)
- Hungarian: 18 (0.8%)
- Scottish: 6 (0.3%)
- Norwegian: 5 (0.2%)
- African: 5 (0.2%)
Most common places of birth for foreign-born residents (%):
| Luray: | 48.0% (12) |
| Virginia: | 0.1% (1,168) |
| Luray: | 12.0% (3) |
| Virginia: | 0.3% (2,903) |
Place of birth for U.S.-born residents:
- This state: 3,352
- Other state: 1,392
- Northeast: 397
- Midwest: 148
- South: 771
- West: 71
91.3% of Luray residents lived in the same house 1 years ago.
Out of people who lived in different houses, 33.3% lived in this county.
Out of people who lived in different counties, 78.2% lived in Virginia.
| Luray: | 91.3% |
| State average: | 86.6% |
Education attainment for males 25 years and older:
- No schooling: 39
- Nursery to 4th grade: 29
- 5th and 6th grade: 0
- 7th and 8th grade: 20
- 9th grade: 3
- 10th grade: 129
- 11th grade: 28
- 12th grade, no diploma: 0
- High school graduate (or equivalency): 894
- Less than 1 year of college: 82
- Some college more than 1 year, no degree: 202
- Associate degree: 46
- Bachelor's degree: 215
- Master's degree: 68
- Professional school degree: 15
- Doctorate degree: 0

Education attainment for females 25 years and older:
- No schooling: 0
- Nursery to 4th grade: 0
- 5th and 6th grade: 5
- 7th and 8th grade: 39
- 9th grade: 10
- 10th grade: 133
- 11th grade: 145
- 12th grade, no diploma: 0
- High school graduate (or equivalency): 704
- Less than 1 year of college: 260
- Some college more than 1 year, no degree: 50
- Associate degree: 290
- Bachelor's degree: 248
- Master's degree: 184
- Professional school degree: 0
- Doctorate degree: 8

Housing units in structures:
- One, detached: 2,307
- One, attached: 139
- Two: 36
- 3 or 4: 148
- 5 to 9: 73
- 20 to 49: 36
- Mobile homes: 9
Housing units lacking complete kitchen facilities in 2022: 3.3%
House/condo owner moved in on average 16 years ago
Renter moved in on average 6 years ago

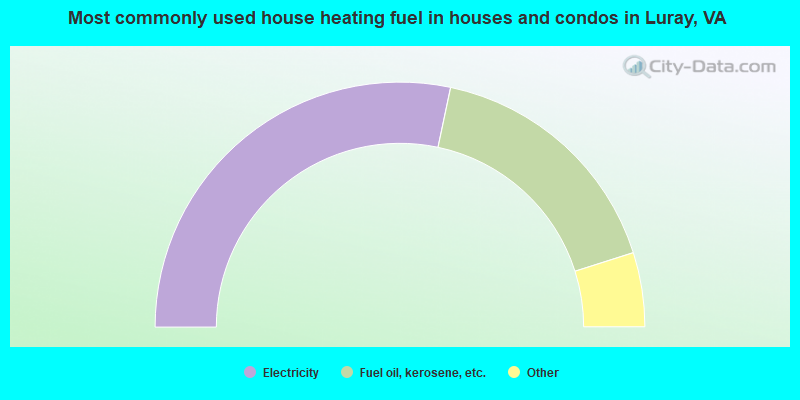
- 56.7%Electricity
- 33.6%Fuel oil, kerosene, etc.
- 4.0%Bottled, tank, or LP gas
- 2.5%Utility gas
- 1.8%Wood
- 1.5%No fuel used
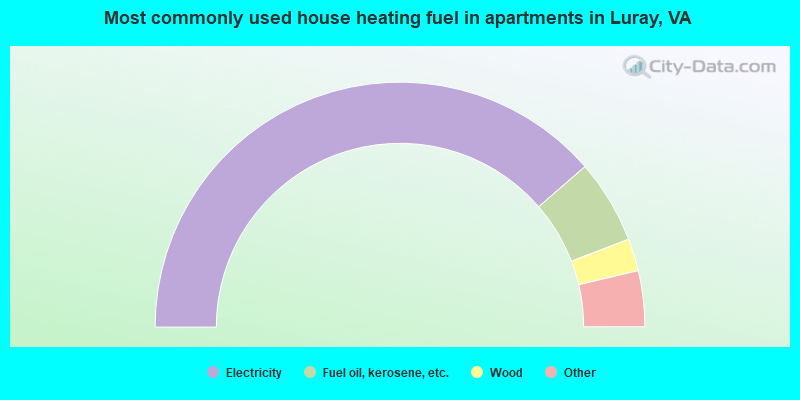
- 77.5%Electricity
- 11.1%Fuel oil, kerosene, etc.
- 4.3%Wood
- 3.6%Utility gas
- 2.4%Other fuel
- 1.1%Bottled, tank, or LP gas
Private vs. public school enrollment:
| Here: | 20.0% |
| Virginia: | 13.2% |
| Here: | 0.0% |
| Virginia: | 10.2% |
| Here: | 0.0% |
| Virginia: | 18.7% |


