Lynn Haven, FL (Florida) Houses and Residents
| Lynn Haven: | $329,276 |
| Florida: | $354,100 |
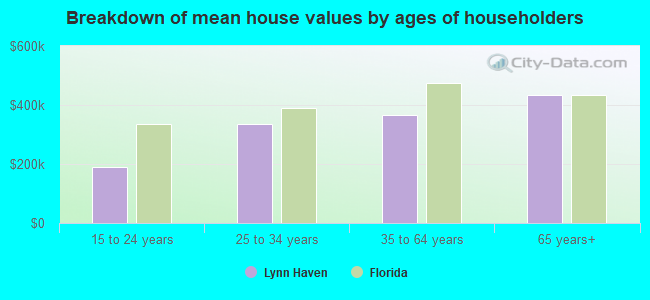
Mean price in 2022:
Detached houses: $332,920
Here: $332,920 State: $500,941 Townhouses or other attached units: $324,920
Here: $324,920 State: $370,869 In 3-to-4-unit structures: $175,809
Here: $175,809 State: $309,944 In 5-or-more-unit structures: $533,927
Here: $533,927 State: $447,145 Mobile homes: $28,974
Here: $28,974 State: $113,202
Total population: 19,792 (Urban population: 12,352, Rural population: 0)
Houses: 8,825 (7,677 occupied: 5,326 owner occupied, 2,483 renter occupied)
| % of renters here: | 32% |
| State: | 33% |
Housing density: 1,083 houses/condos per square mile
Median price asked for vacant for-sale houses and condos in 2022: $2,964,004.
Median contract rent in 2022: $1,313 (lower quartile is $1,013, upper quartile is $1,666)
Median rent asked for vacant for-rent units in 2022: $1,198
Median gross rent in Lynn Haven, FL in 2022: $1,464
Housing units in Lynn Haven with a mortgage: 3,362 (185 second mortgage, 7 home equity loan, 165 both second mortgage and home equity loan)
Houses without a mortgage: 44
Median household income for houses/condos with a mortgage: $98,042
Median household income for apartments without a mortgage: $94,245
Median monthly housing costs: $1,324
Compare current foreclosures near Lynn Haven, FL:
| Photo | Address | Area | Beds / Baths | Price | Details |
|---|---|---|---|---|---|

|
#1
Grants Mill Ct
Lynn Haven, FL 32444
|
2,624 sq. feet
|
3 baths 4 beds |
$589,900
|
show details |

|
#2
Huntington Ridge Rd
Lynn Haven, FL 32444
|
2,263 sq. feet
|
2 baths 4 beds |
show details | |

|
#3
Iowa Ave
Lynn Haven, FL 32444
|
1,364 sq. feet
|
2 baths 3 beds |
show details | |

|
#4
Azalea Cir
Lynn Haven, FL 32444
|
2,156 sq. feet
|
2 baths 3 beds |
show details | |

|
#5
Ravenwood Ct
Lynn Haven, FL 32444
|
1,543 sq. feet
|
2 baths 3 beds |
show details | |

|
#6
E Pine Forest Dr
Lynn Haven, FL 32444
|
1,200 sq. feet
|
2 baths 3 beds |
show details | |

|
#7
Pine Tree Ln
Lynn Haven, FL 32444
|
2,217 sq. feet
|
2 baths 4 beds |
show details | |

|
#8
E 9th St
Lynn Haven, FL 32444
|
1,035 sq. feet
|
2 baths 2 beds |
show details | |

|
#9
Georgia Ct
Lynn Haven, FL 32444
|
1,056 sq. feet
|
1 baths 2 beds |
show details | |

|
#10
Cherry Ridge Rd
Lynn Haven, FL 32444
|
1,789 sq. feet
|
2 baths 3 beds |
show details |
| Photo | Address | Area | Beds / Baths | Price | Details |
|---|---|---|---|---|---|

|
#11
Pennsylvania Ave
Lynn Haven, FL 32444
|
1,352 sq. feet
|
2 baths 2 beds |
show details | |

|
#12
W 26th St Apt 77
Lynn Haven, FL 32444
|
- sq. feet
|
- baths - beds |
show details | |

|
#13
Landings Dr
Lynn Haven, FL 32444
|
- sq. feet
|
- baths - beds |
show details | |

|
#14
Missouri Ave
Lynn Haven, FL 32444
|
- sq. feet
|
- baths - beds |
show details | |

|
#15
E 8th St
Lynn Haven, FL 32444
|
- sq. feet
|
- baths - beds |
show details | |

|
#16
Martingale Loop
Lynn Haven, FL 32444
|
- sq. feet
|
- baths - beds |
show details | |

|
#17
New York Ave
Lynn Haven, FL 32444
|
- sq. feet
|
- baths - beds |
show details | |

|
#18
Caleigh Ct
Lynn Haven, FL 32444
|
- sq. feet
|
- baths - beds |
show details | |

|
#19
Michigan Ave
Lynn Haven, FL 32444
|
- sq. feet
|
- baths - beds |
show details | |

|
#20
Caleigh Ct
Lynn Haven, FL 32444
|
- sq. feet
|
- baths - beds |
show details |
| Photo | Address | Area | Beds / Baths | Price | Details |
|---|---|---|---|---|---|

|
#21
Waverly St
Youngstown, FL 32466
|
1,575 sq. feet
|
3 baths 3 beds |
$245,000
|
show details |

|
#22
Raintree Dr
Panama City, FL 32404
|
1,742 sq. feet
|
2 baths 3 beds |
$299,900
|
show details |

|
#23
Ferol Ln
Lynn Haven, FL 32444
|
- sq. feet
|
- baths - beds |
show details | |

|
#24
Santee Dr
Panama City, FL 32404
|
1,140 sq. feet
|
2 baths 3 beds |
show details | |

|
#25
Game Farm Rd
Panama City, FL 32405
|
1,035 sq. feet
|
1 baths 2 beds |
show details | |

|
#26
N Lagoon Dr
Panama City, FL 32408
|
3,750 sq. feet
|
4 baths 6 beds |
show details | |

|
#27
Oxford Ave
Panama City Beach, FL 32413
|
2,265 sq. feet
|
2 baths 3 beds |
show details | |

|
#28
Isabella Ave
Panama City, FL 32401
|
1,782 sq. feet
|
2 baths 3 beds |
show details | |

|
#29
E 16th Ct
Panama City, FL 32405
|
1,074 sq. feet
|
1 baths 3 beds |
show details | |

|
#30
Cactus Ave
Panama City, FL 32401
|
1,480 sq. feet
|
2 baths 4 beds |
show details |
| Photo | Address | Area | Beds / Baths | Price | Details |
|---|---|---|---|---|---|

|
#31
Starling Rd
Youngstown, FL 32466
|
1,344 sq. feet
|
2 baths 3 beds |
show details | |

|
#32
Oak Ave
Youngstown, FL 32466
|
1,224 sq. feet
|
2 baths 2 beds |
show details | |

|
#33
Sanders Ln
Panama City, FL 32401
|
928 sq. feet
|
1 baths 3 beds |
show details | |

|
#34
Maine Ave
Panama City, FL 32401
|
1,426 sq. feet
|
2 baths 3 beds |
show details | |

|
#35
Beck Ave Apt 11
Panama City, FL 32401
|
803 sq. feet
|
1 baths 2 beds |
show details | |

|
#36
E 3rd St
Panama City, FL 32401
|
1,824 sq. feet
|
2 baths 3 beds |
show details | |

|
#37
Wilson Ave Apt 11
Panama City, FL 32401
|
570 sq. feet
|
1 baths 1 beds |
show details | |

|
#38
White Western Springs Rd
Panama City, FL 32409
|
1,809 sq. feet
|
2 baths 3 beds |
show details | |

|
#39
Doe Run
Panama City, FL 32409
|
1,152 sq. feet
|
2 baths 3 beds |
show details | |

|
#40
Tates Ln
Panama City, FL 32409
|
920 sq. feet
|
2 baths 2 beds |
show details |
| Photo | Address | Area | Beds / Baths | Price | Details |
|---|---|---|---|---|---|

|
#41
Eagle Dr
Panama City Beach, FL 32407
|
1,821 sq. feet
|
2 baths 3 beds |
show details | |

|
#42
Bonnie Girls Way
Panama City, FL 32409
|
1,056 sq. feet
|
2 baths 3 beds |
show details | |

|
#43
Cherry Ln
Panama City, FL 32404
|
1,499 sq. feet
|
2 baths 3 beds |
show details | |

|
#44
E Highway 98
Panama City, FL 32404
|
1,293 sq. feet
|
2 baths 2 beds |
show details | |

|
#45
Sunrise Dr
Panama City Beach, FL 32407
|
1,352 sq. feet
|
2 baths 3 beds |
show details | |

|
#46
S Lagoon Dr
Panama City, FL 32408
|
1,576 sq. feet
|
2 baths 3 beds |
show details | |

|
#47
Beech St
Panama City, FL 32408
|
1,026 sq. feet
|
2 baths 2 beds |
show details | |

|
#48
Cypress St
Panama City, FL 32408
|
932 sq. feet
|
1 baths 2 beds |
show details | |

|
#49
Pridgen St
Panama City, FL 32404
|
1,091 sq. feet
|
2 baths 3 beds |
show details | |

|
Check over 1 million property listings on Foreclosure.com!
|
browse all offers | |||


 | Panama City/Lynn Haven Homeschooling (3 replies) |
| Lynn Haven FL -- is real estate there an worthy investment? (11 replies) |
| Retire to florida? (59 replies) |
| Moving to Panama City (9 replies) |
| What are the best and worst aspects of living in the Panama City, Fla. area? (12 replies) |
| What is PCB like? (26 replies) |

Median year apartment built: 2007
Household type by relationship:
Households: 19,858- Male householders: 3,961 (569 living alone), Female householders: 3,582 (1,094 living alone)
4,242 spouses (4,230 opposite-sex spouses), 342 unmarried partners, (327 opposite-sex unmarried partners), 5,704 children (5,359 natural, 81 adopted, 263 stepchildren), 647 grandchildren, 215 brothers or sisters, 356 parents, 15 foster children, 285 other relatives, 446 non-relatives
- In group quarters: 57
Size of family households: 2,160 2-persons, 1,761 3-persons, 1,026 4-persons, 477 5-persons, 186 6-persons, 117 7-or-more-persons.
Size of nonfamily households: 1,691 1-person, 351 2-persons, 7 3-persons, 24 4-persons.
3,703 married couples with children.
1,009 single-parent households (252 men, 757 women).
88.6% of residents of Lynn Haven speak English at home.
5.7% of residents speak Spanish at home (47% speak English very well, 18% speak English well, 16% speak English not well, 19% don't speak English at all).
2.6% of residents speak other Indo-European language at home (76% speak English very well, 16% speak English well, 8% speak English not well).
1.9% of residents speak Asian or Pacific Island language at home (30% speak English very well, 63% speak English well, 7% speak English not well).
1.0% of residents speak other language at home (63% speak English very well, 20% speak English well, 17% speak English not well).
Foreign born population: 1,227 (6.2%)
(46.0% of them are naturalized citizens)
| Here: | 6.2 |
| State: | 5.9 |
| Here: | 4.9 |
| State: | 4.2 |
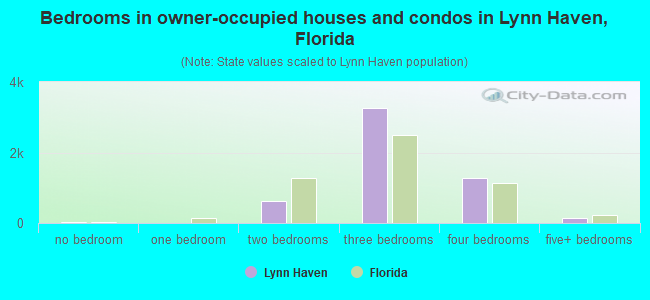
- Bedrooms in owner-occupied houses and condos in Lynn Haven, Florida
- 15no bedroom
- 71 bedroom
- 6212 bedrooms
- 3,2693 bedrooms
- 1,2864 bedrooms
- 1285+ bedrooms
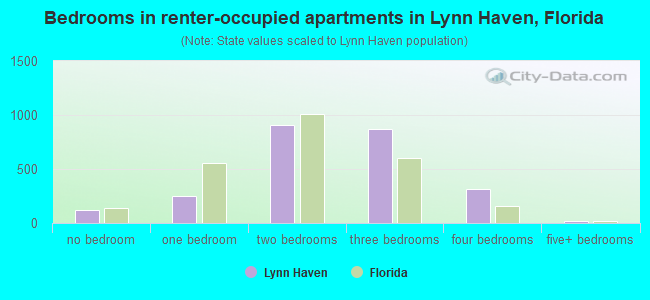
- Bedrooms in renter-occupied apartments in Lynn Haven, Florida
- 116no bedroom
- 2491 bedroom
- 9122 bedrooms
- 8733 bedrooms
- 3144 bedrooms
- 185+ bedrooms
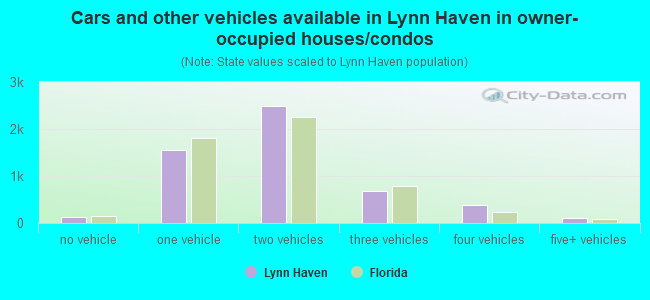
- Cars and other vehicles available in Lynn Haven in owner-occupied houses/condos
- 124no vehicle
- 1,5441 vehicle
- 2,4902 vehicles
- 6823 vehicles
- 3834 vehicles
- 1045+ vehicles
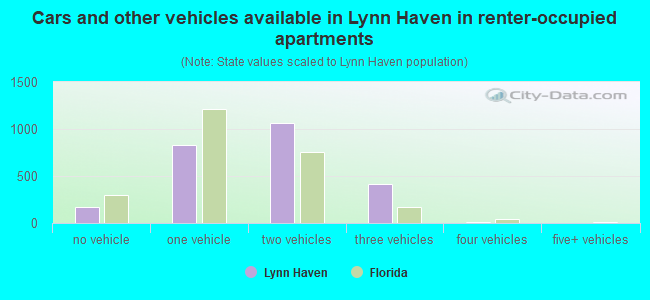
- Cars and other vehicles available in Lynn Haven in renter-occupied apartments
- 166no vehicle
- 8291 vehicle
- 1,0642 vehicles
- 4143 vehicles
- 114 vehicles
- 05+ vehicles
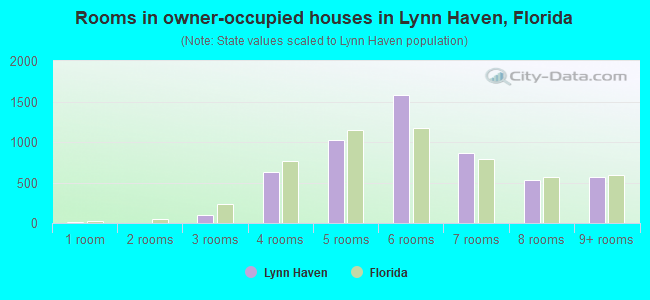
- Rooms in owner-occupied houses in Lynn Haven, Florida
- 151 room
- 02 rooms
- 1033 rooms
- 6324 rooms
- 1,0255 rooms
- 1,5796 rooms
- 8707 rooms
- 5328 rooms
- 5719+ rooms
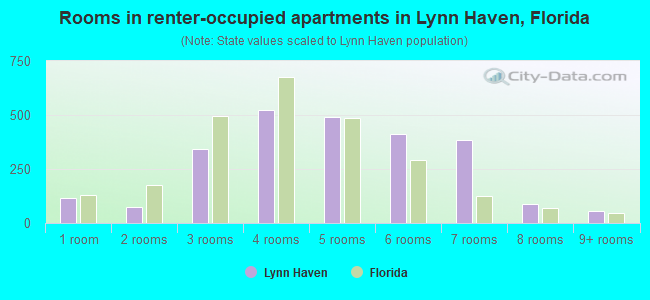
- Rooms in renter-occupied apartments in Lynn Haven, Florida
- 1161 room
- 752 rooms
- 3423 rooms
- 5234 rooms
- 4915 rooms
- 4106 rooms
- 3847 rooms
- 878 rooms
- 559+ rooms
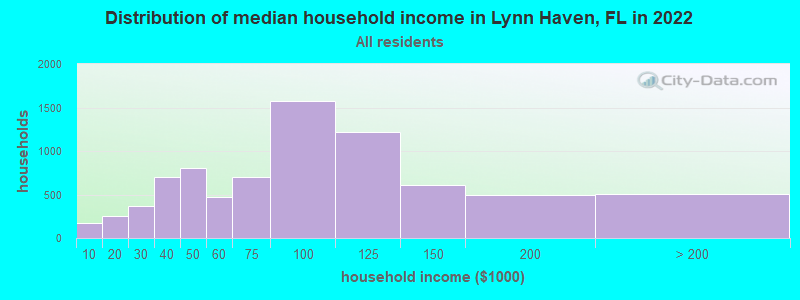
Lynn Haven, FL household income distribution

- 167Less than $10,000
- 254$10,000 to $19,999
- 369$20,000 to $29,999
- 705$30,000 to $39,999
- 809$40,000 to $49,999
- 468$50,000 to $59,999
- 706$60,000 to $74,999
- 1,575$75,000 to $99,999
- 1,221$100,000 to $124,999
- 607$125,000 to $149,999
- 492$150,000 to $199,999
- 506$200,000 or more
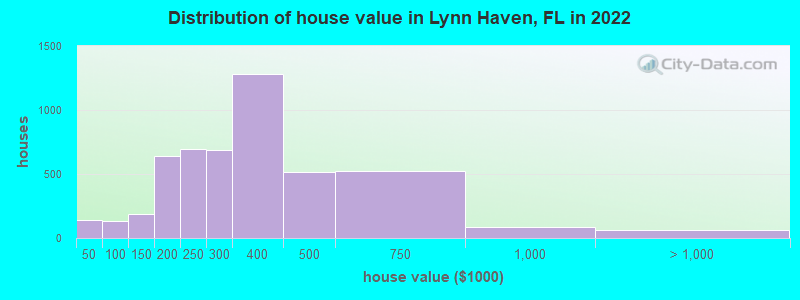
Home value of owner - occupied houses in 2022 in Lynn Haven, FL
-
- 52Less than $10,000
- 9$20,000 to $24,999
- 18$30,000 to $34,999
- 58$35,000 to $39,999
- 67$50,000 to $59,999
- 34$70,000 to $79,999
- 11$80,000 to $89,999
- 19$90,000 to $99,999
- 89$100,000 to $124,999
- 95$125,000 to $149,999
- 315$150,000 to $174,999
- 323$175,000 to $199,999
- 694$200,000 to $249,999
- 688$250,000 to $299,999
- 1,284$300,000 to $399,999
- 517$400,000 to $499,999
- 523$500,000 to $749,999
- 83$750,000 to $999,999
- 41$1,000,000 to $1,499,999
- 23$2,000,000 or more
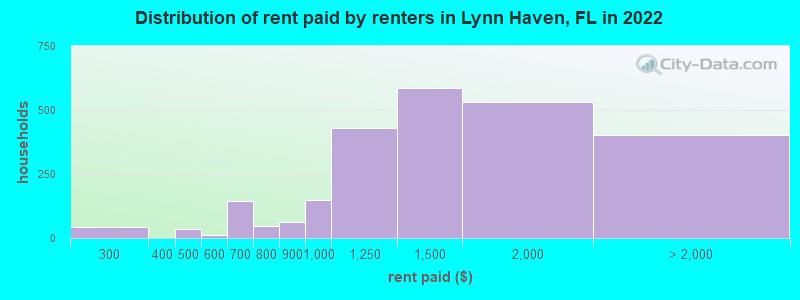
Rent paid by renters in 2022 in Lynn Haven, FL
-
- 43$200 to $249
- 14$400 to $449
- 21$450 to $499
- 11$550 to $599
- 129$600 to $649
- 13$650 to $699
- 47$750 to $799
- 61$800 to $899
- 149$900 to $999
- 428$1,000 to $1,249
- 586$1,250 to $1,499
- 530$1,500 to $1,999
- 205$2,000 to $2,499
- 43$2,500 to $2,999
- 80$3,000 to $3,499
- 25$3,500 or more
- 47No cash rent
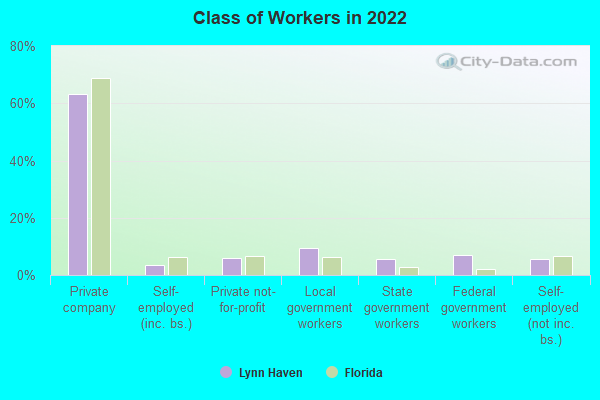
Percentage of workers working in this county: 95.5%
Number of people working at home: 1,038 (9.9% of all workers)
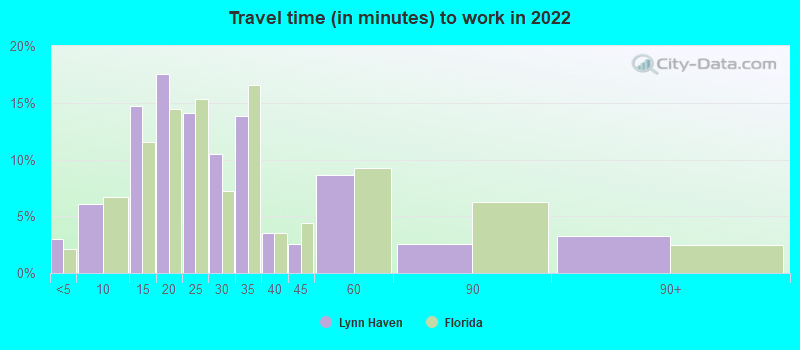
Travel time to work (commute)
- Less than 5 minutes: 263
- 5 to 9 minutes: 521
- 10 to 14 minutes: 2,012
- 15 to 19 minutes: 1,748
- 20 to 24 minutes: 1,087
- 25 to 29 minutes: 711
- 30 to 34 minutes: 1,573
- 35 to 39 minutes: 358
- 40 to 44 minutes: 270
- 45 to 59 minutes: 256
- 60 to 89 minutes: 394
- 90 or more minutes: 275
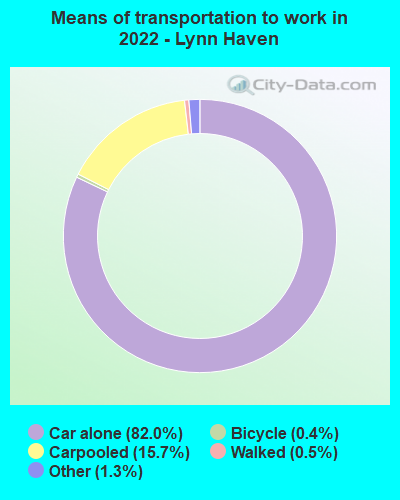
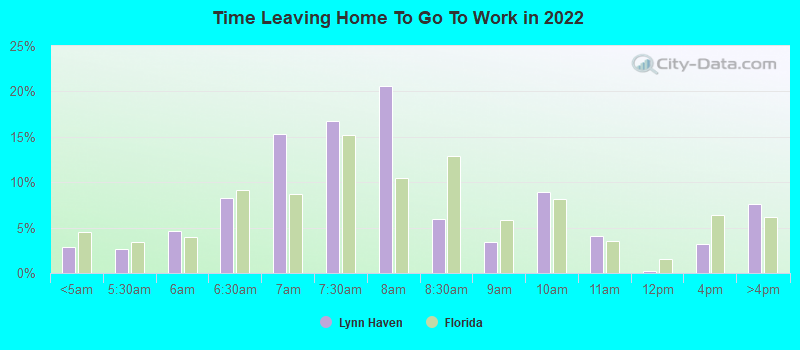
Means of transportation to work:
- Drove a car alone: 6,876 (71.7%)
- Carpooled: 1,400 (14.6%)
- Taxi: 119 (1.2%)
- Bicycle: 35 (0.4%)
- Walked: 48 (0.5%)
- Worked at home: 920 (9.6%)
- Unemployment by race in 2022
- Unemployment rate for White non-Hispanic residents
- 0.9%Males
- 3.2%Females
- Unemployment rate for Black residents
- 17.9%Males
- 3.1%Females
- Unemployment rate for two or more race residents
- 12.2%Females
- Unemployment rate for Hispanic or Latino residents
- 1.8%Males
- 8.3%Females
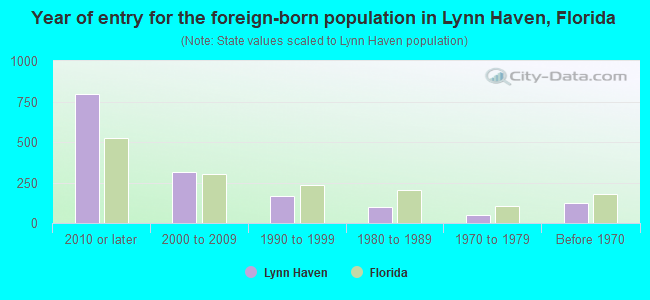
- Year of entry for the foreign-born population in Lynn Haven, Florida
- 7952010 or later
- 3142000 to 2009
- 1681990 to 1999
- 991980 to 1989
- 481970 to 1979
- 121Before 1970
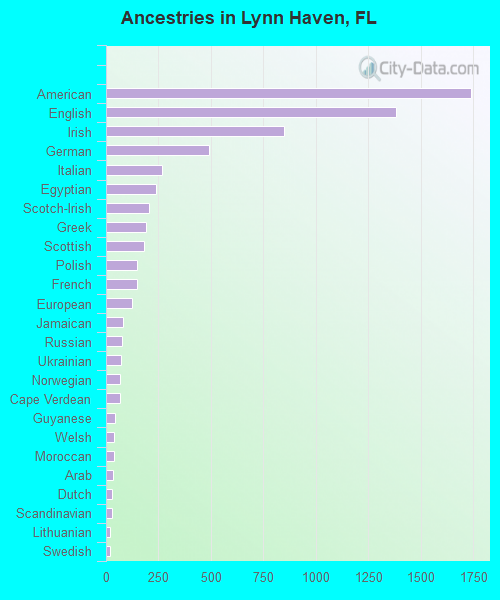
First ancestries reported:
- American: 1,739 (18.0%)
- English: 1,382 (14.3%)
- Irish: 850 (8.8%)
- German: 492 (5.1%)
- Italian: 265 (2.7%)
- Egyptian: 236 (2.4%)
- Scotch-Irish: 206 (2.1%)
- Greek: 191 (2.0%)
- Scottish: 182 (1.9%)
- Polish: 148 (1.5%)
- French: 146 (1.5%)
- European: 122 (1.3%)
- Jamaican: 80 (0.8%)
- Russian: 74 (0.8%)
- Ukrainian: 73 (0.8%)
- Norwegian: 68 (0.7%)
- Cape Verdean: 68 (0.7%)
- Guyanese: 42 (0.4%)
- Welsh: 38 (0.4%)
- Moroccan: 37 (0.4%)
- Arab: 33 (0.3%)
- Dutch: 30 (0.3%)
- Scandinavian: 27 (0.3%)
- Lithuanian: 17 (0.2%)
- Swedish: 17 (0.2%)
- Portuguese: 16 (0.2%)
- Pennsylvania German: 13 (0.1%)
- British: 12 (0.1%)
- Eastern European: 11 (0.1%)
- Yugoslavian: 8 (0.08%)
Most common places of birth for foreign-born residents (%):
| Lynn Haven: | 13.8% (194) |
| Florida: | 1.8% (84,403) |
| Lynn Haven: | 11.7% (164) |
| Florida: | 0.3% (13,998) |
| Lynn Haven: | 9.6% (135) |
| Florida: | 2.3% (107,160) |
| Lynn Haven: | 5.9% (83) |
| Florida: | 1.2% (54,272) |
| Lynn Haven: | 5.8% (82) |
| Florida: | 5.0% (227,319) |
| Lynn Haven: | 5.8% (81) |
| Florida: | 1.2% (54,585) |
| Lynn Haven: | 5.4% (76) |
| Florida: | 5.6% (257,152) |
| Lynn Haven: | 4.4% (62) |
| Florida: | 0.5% (21,886) |
| Lynn Haven: | 4.1% (58) |
| Florida: | 0.7% (31,076) |
| Lynn Haven: | 4.0% (56) |
| Florida: | 2.1% (94,349) |
| Lynn Haven: | 3.8% (54) |
| Florida: | 2.4% (109,132) |
| Lynn Haven: | 3.6% (50) |
| Florida: | 1.1% (49,838) |
| Lynn Haven: | 3.5% (49) |
| Florida: | 1.3% (60,604) |
| Lynn Haven: | 3.1% (43) |
| Florida: | 0.6% (25,219) |
| Lynn Haven: | 2.7% (38) |
| Florida: | 5.7% (262,042) |
| Lynn Haven: | 2.1% (30) |
| Florida: | 0.2% (9,164) |
| Lynn Haven: | 1.8% (26) |
| Florida: | 1.2% (56,071) |
| Lynn Haven: | 1.8% (26) |
| Florida: | 0.5% (22,972) |
| Lynn Haven: | 1.8% (25) |
| Florida: | 0.7% (33,556) |
| Lynn Haven: | 1.7% (24) |
| Florida: | 0.4% (19,445) |
Place of birth for U.S.-born residents:
- This state: 8,134
- Other state: 9,895
- Northeast: 1,893
- Midwest: 2,117
- South: 4,582
- West: 1,197
81.3% of Lynn Haven residents lived in the same house 1 years ago.
Out of people who lived in different houses, 24.4% lived in this county.
Out of people who lived in different counties, 13.0% lived in Florida.
| Lynn Haven: | 81.3% |
| State average: | 86.3% |
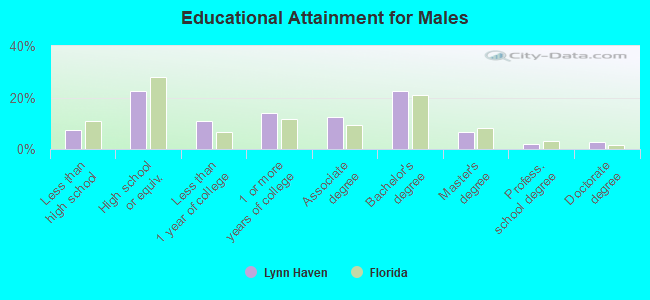
Education attainment for males 25 years and older:
- No schooling: 144
- Nursery to 4th grade: 0
- 5th and 6th grade: 66
- 7th and 8th grade: 0
- 9th grade: 22
- 10th grade: 19
- 11th grade: 56
- 12th grade, no diploma: 133
- High school graduate (or equivalency): 1,354
- Less than 1 year of college: 647
- Some college more than 1 year, no degree: 836
- Associate degree: 744
- Bachelor's degree: 1,361
- Master's degree: 393
- Professional school degree: 110
- Doctorate degree: 157
Education attainment for females 25 years and older:
- No schooling: 82
- Nursery to 4th grade: 0
- 5th and 6th grade: 37
- 7th and 8th grade: 33
- 9th grade: 18
- 10th grade: 121
- 11th grade: 25
- 12th grade, no diploma: 72
- High school graduate (or equivalency): 1,548
- Less than 1 year of college: 579
- Some college more than 1 year, no degree: 1,076
- Associate degree: 1,046
- Bachelor's degree: 1,632
- Master's degree: 550
- Professional school degree: 96
- Doctorate degree: 7


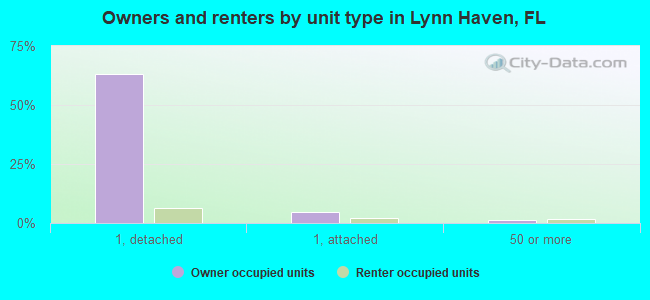
Housing units in structures:
- One, detached: 6,008
- One, attached: 572
- Two: 23
- 3 or 4: 302
- 5 to 9: 556
- 10 to 19: 736
- 20 to 49: 143
- 50 or more: 250
- Mobile homes: 217
- Boats, RVs, vans, etc.: 12
Housing units lacking complete kitchen facilities in 2022: 5.8%
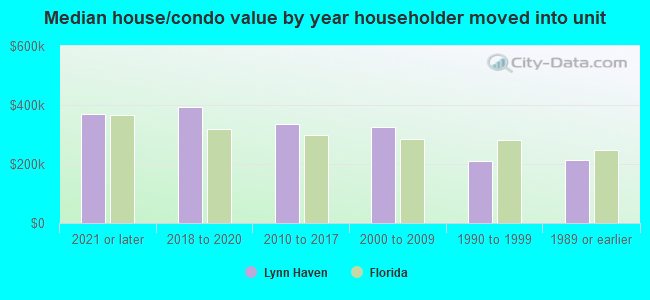
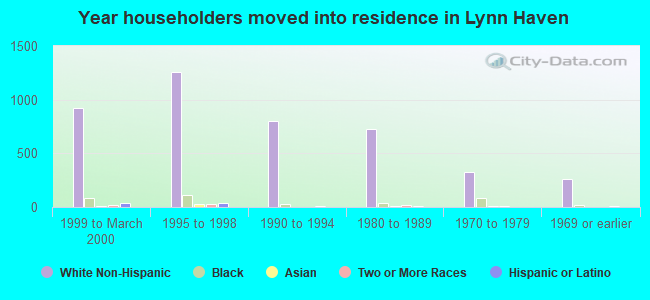
House/condo owner moved in on average 9 years ago
Renter moved in on average 1 years ago
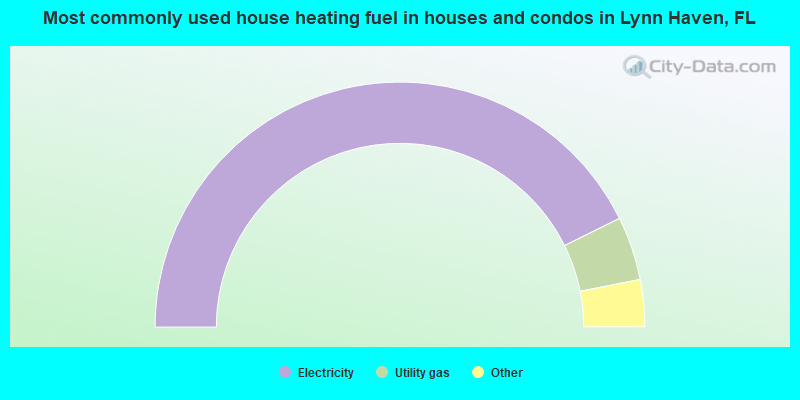
- 85.4%Electricity
- 8.4%Utility gas
- 2.8%Solar energy
- 2.7%Bottled, tank, or LP gas
- 0.5%No fuel used
- 0.1%Coal or coke
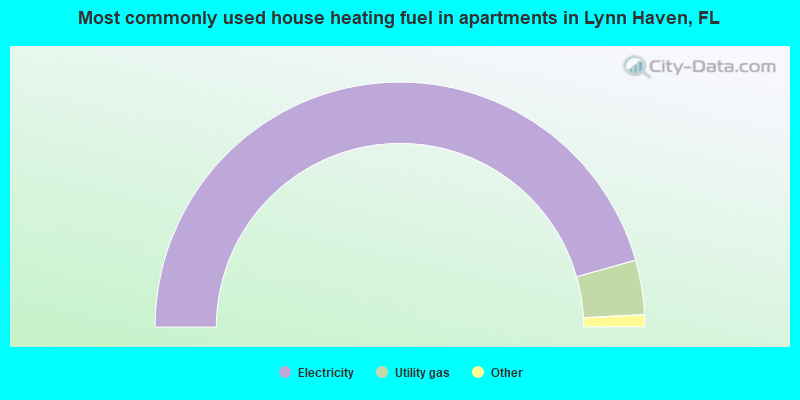
- 91.2%Electricity
- 7.2%Utility gas
- 1.0%No fuel used
- 0.5%Wood
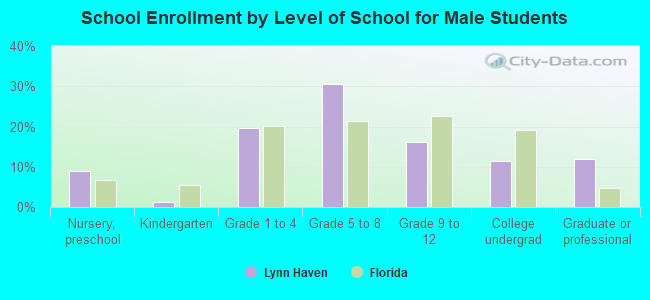
Private vs. public school enrollment:
| Here: | 16.7% |
| Florida: | 15.8% |
| Here: | 5.8% |
| Florida: | 12.9% |
| Here: | 3.8% |
| Florida: | 23.6% |