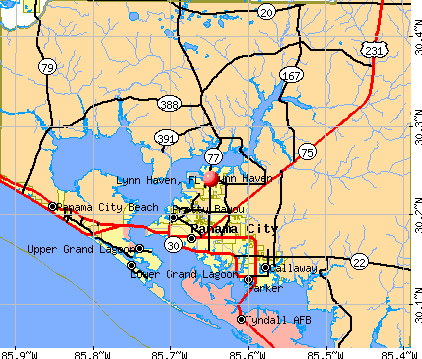
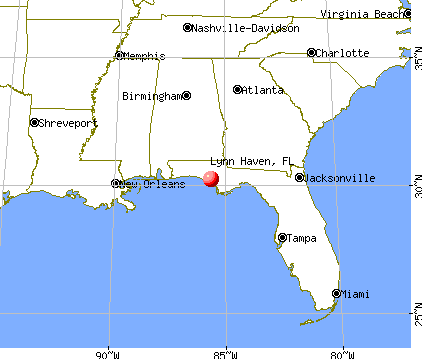
Lynn Haven, Florida

Lynn Haven: Alamogordo NM

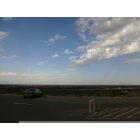
Lynn Haven: July 4th, 2009 sunset from A.L. Kinsaul Park waiting for the fireworks to begin!
Lynn Haven: Alamogordo NM
- add
your


Submit your own pictures of this city and show them to the world
- OSM Map
- General Map
- Google Map
- MSN Map
Population change since 2000: +61.0%
| Males: 9,419 | |
| Females: 10,625 |
| Median resident age: | 36.0 years |
| Florida median age: | 42.7 years |
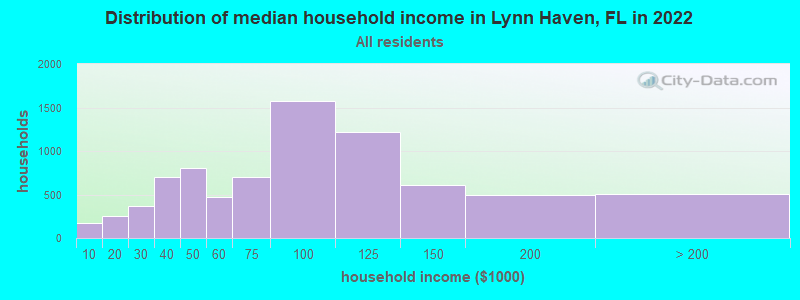
| Lynn Haven: | $81,681 |
| FL: | $69,303 |
Estimated per capita income in 2022: $40,975 (it was $20,330 in 2000)
Lynn Haven city income, earnings, and wages data
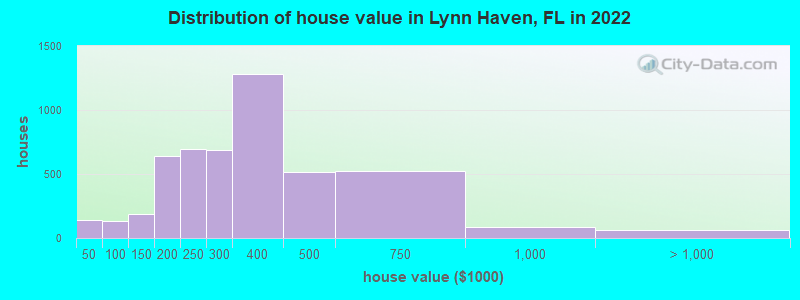
Estimated median house or condo value in 2022: $329,276 (it was $96,300 in 2000)
| Lynn Haven: | $329,276 |
| FL: | $354,100 |
Mean prices in 2022: all housing units: $333,457; detached houses: $332,920; townhouses or other attached units: $324,920; in 3-to-4-unit structures: $175,809; in 5-or-more-unit structures: $533,927; mobile homes: $28,974
Median gross rent in 2022: $1,464.
(5.4% for White Non-Hispanic residents, 3.8% for Black residents, 26.1% for Hispanic or Latino residents, 37.2% for two or more races residents)
Detailed information about poverty and poor residents in Lynn Haven, FL


Compare current foreclosures near Lynn Haven, FL:
| Photo | Address | Area | Beds / Baths | Price | Details |
|---|---|---|---|---|---|

|
#1
Grants Mill Ct
Lynn Haven, FL 32444
|
2,624 sq. feet
|
3 baths 4 beds |
$589,900
|
show details |

|
#2
Huntington Ridge Rd
Lynn Haven, FL 32444
|
2,263 sq. feet
|
2 baths 4 beds |
show details | |

|
#3
Azalea Cir
Lynn Haven, FL 32444
|
2,156 sq. feet
|
2 baths 3 beds |
show details | |

|
#4
Ravenwood Ct
Lynn Haven, FL 32444
|
1,543 sq. feet
|
2 baths 3 beds |
show details | |

|
#5
E Pine Forest Dr
Lynn Haven, FL 32444
|
1,200 sq. feet
|
2 baths 3 beds |
show details | |

|
#6
Pine Tree Ln
Lynn Haven, FL 32444
|
2,217 sq. feet
|
2 baths 4 beds |
show details | |

|
#7
E 9th St
Lynn Haven, FL 32444
|
1,035 sq. feet
|
2 baths 2 beds |
show details | |

|
#8
Georgia Ct
Lynn Haven, FL 32444
|
1,056 sq. feet
|
1 baths 2 beds |
show details | |

|
#9
Cherry Ridge Rd
Lynn Haven, FL 32444
|
1,789 sq. feet
|
2 baths 3 beds |
show details | |

|
#10
Iowa Ave
Lynn Haven, FL 32444
|
1,364 sq. feet
|
2 baths 3 beds |
show details |
| Photo | Address | Area | Beds / Baths | Price | Details |
|---|---|---|---|---|---|

|
#11
Pennsylvania Ave
Lynn Haven, FL 32444
|
1,352 sq. feet
|
2 baths 2 beds |
show details | |

|
#12
W 5th St
Lynn Haven, FL 32444
|
- sq. feet
|
- baths - beds |
show details | |

|
#13
Landings Dr
Lynn Haven, FL 32444
|
- sq. feet
|
- baths - beds |
show details | |

|
#14
Missouri Ave
Lynn Haven, FL 32444
|
- sq. feet
|
- baths - beds |
show details | |

|
#15
E 8th St
Lynn Haven, FL 32444
|
- sq. feet
|
- baths - beds |
show details | |

|
#16
Martingale Loop
Lynn Haven, FL 32444
|
- sq. feet
|
- baths - beds |
show details | |

|
#17
New York Ave
Lynn Haven, FL 32444
|
- sq. feet
|
- baths - beds |
show details | |

|
#18
Caleigh Ct
Lynn Haven, FL 32444
|
- sq. feet
|
- baths - beds |
show details | |

|
#19
Michigan Ave
Lynn Haven, FL 32444
|
- sq. feet
|
- baths - beds |
show details | |

|
#20
Caleigh Ct
Lynn Haven, FL 32444
|
- sq. feet
|
- baths - beds |
show details |
| Photo | Address | Area | Beds / Baths | Price | Details |
|---|---|---|---|---|---|

|
#21
W 26th St Apt 77
Lynn Haven, FL 32444
|
- sq. feet
|
- baths - beds |
show details | |

|
#22
Raintree Dr
Panama City, FL 32404
|
1,742 sq. feet
|
2 baths 3 beds |
$299,900
|
show details |

|
#23
Waverly St
Youngstown, FL 32466
|
1,575 sq. feet
|
3 baths 3 beds |
$245,000
|
show details |

|
#24
Ferol Ln
Lynn Haven, FL 32444
|
- sq. feet
|
- baths - beds |
show details | |

|
#25
S Cedar Bluff Cir
Panama City, FL 32409
|
1,400 sq. feet
|
2 baths 4 beds |
show details | |

|
#26
Game Farm Rd
Panama City, FL 32405
|
1,035 sq. feet
|
1 baths 2 beds |
show details | |

|
#27
N Lagoon Dr
Panama City, FL 32408
|
3,750 sq. feet
|
4 baths 6 beds |
show details | |

|
#28
Isabella Ave
Panama City, FL 32401
|
1,782 sq. feet
|
2 baths 3 beds |
show details | |

|
#29
Santee Dr
Panama City, FL 32404
|
1,140 sq. feet
|
2 baths 3 beds |
show details | |

|
#30
Cactus Ave
Panama City, FL 32401
|
1,480 sq. feet
|
2 baths 4 beds |
show details |
| Photo | Address | Area | Beds / Baths | Price | Details |
|---|---|---|---|---|---|

|
#31
Oak Ave
Youngstown, FL 32466
|
1,224 sq. feet
|
2 baths 2 beds |
show details | |

|
#32
Starling Rd
Youngstown, FL 32466
|
1,344 sq. feet
|
2 baths 3 beds |
show details | |

|
#33
Creek Run Rd
Youngstown, FL 32466
|
1,809 sq. feet
|
2 baths 4 beds |
show details | |

|
#34
Sanders Ln
Panama City, FL 32401
|
928 sq. feet
|
1 baths 3 beds |
show details | |

|
#35
Hubbard Rd
Panama City, FL 32409
|
1,216 sq. feet
|
2 baths 3 beds |
show details | |

|
#36
Beck Ave Apt 11
Panama City, FL 32401
|
803 sq. feet
|
1 baths 2 beds |
show details | |

|
#37
Maine Ave
Panama City, FL 32401
|
1,426 sq. feet
|
2 baths 3 beds |
show details | |

|
#38
E 3rd St
Panama City, FL 32401
|
1,824 sq. feet
|
2 baths 3 beds |
show details | |

|
#39
Wilson Ave Apt 11
Panama City, FL 32401
|
570 sq. feet
|
1 baths 1 beds |
show details | |

|
#40
White Western Springs Rd
Panama City, FL 32409
|
1,809 sq. feet
|
2 baths 3 beds |
show details |
| Photo | Address | Area | Beds / Baths | Price | Details |
|---|---|---|---|---|---|

|
#41
Tates Ln
Panama City, FL 32409
|
920 sq. feet
|
2 baths 2 beds |
show details | |

|
#42
Cherry Ln
Panama City, FL 32404
|
1,499 sq. feet
|
2 baths 3 beds |
show details | |

|
#43
Shadow Bay Dr
Panama City, FL 32404
|
1,306 sq. feet
|
2 baths 3 beds |
show details | |

|
#44
Forsythe Dr
Panama City, FL 32404
|
1,693 sq. feet
|
2 baths 3 beds |
show details | |

|
#45
E 3rd St
Panama City, FL 32404
|
1,148 sq. feet
|
1 baths 3 beds |
show details | |

|
#46
Cypress St
Panama City, FL 32408
|
932 sq. feet
|
1 baths 2 beds |
show details | |

|
#47
Creek Bank Dr
Youngstown, FL 32466
|
1,296 sq. feet
|
2 baths 3 beds |
show details | |

|
#48
Keiber Cir
Youngstown, FL 32466
|
1,280 sq. feet
|
2 baths 3 beds |
show details | |

|
#49
Heritage Woods Dr
Panama City, FL 32404
|
1,532 sq. feet
|
2 baths 3 beds |
show details | |

|
Check over 1 million property listings on Foreclosure.com!
|
browse all offers | |||


- 14,69074.0%White alone
- 1,8539.3%Hispanic
- 1,5067.6%Black alone
- 1,3596.8%Two or more races
- 5422.7%Asian alone
- 160.08%Other race alone
- 60.03%American Indian alone
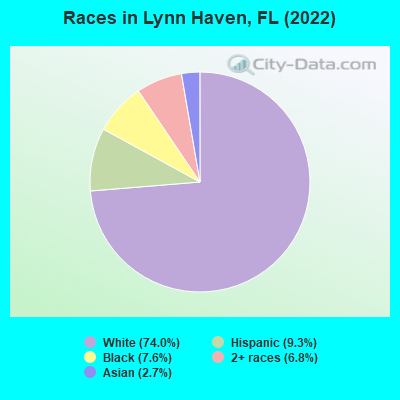
Races in Lynn Haven detailed stats: ancestries, foreign born residents, place of birth
According to our research of Florida and other state lists, there were 20 registered sex offenders living in Lynn Haven, Florida as of April 26, 2024.
The ratio of all residents to sex offenders in Lynn Haven is 1,024 to 1.
The ratio of registered sex offenders to all residents in this city is lower than the state average.
Type |
2009 |
2010 |
2011 |
2012 |
2013 |
2014 |
2015 |
2016 |
2017 |
2018 |
2019 |
2020 |
|---|---|---|---|---|---|---|---|---|---|---|---|---|
| Murders (per 100,000) | 0 (0.0) | 0 (0.0) | 0 (0.0) | 1 (5.3) | 0 (0.0) | 0 (0.0) | 0 (0.0) | 0 (0.0) | 0 (0.0) | 1 (4.7) | 0 (0.0) | 0 (0.0) |
| Rapes (per 100,000) | 4 (25.6) | 1 (5.4) | 2 (10.7) | 3 (15.9) | 3 (15.7) | 4 (20.4) | 3 (14.9) | 4 (19.5) | 5 (23.5) | 5 (23.5) | 5 (22.9) | 7 (33.8) |
| Robberies (per 100,000) | 11 (70.5) | 9 (48.7) | 6 (32.0) | 2 (10.6) | 4 (20.9) | 1 (5.1) | 8 (39.8) | 8 (39.0) | 1 (4.7) | 0 (0.0) | 4 (18.3) | 2 (9.6) |
| Assaults (per 100,000) | 53 (339.6) | 48 (259.6) | 58 (309.4) | 53 (281.0) | 56 (293.0) | 45 (230.0) | 40 (198.8) | 41 (200.0) | 34 (159.9) | 22 (103.4) | 20 (91.5) | 13 (62.7) |
| Burglaries (per 100,000) | 158 (1,012) | 67 (362.3) | 91 (485.5) | 64 (339.3) | 61 (319.2) | 41 (209.6) | 46 (228.7) | 55 (268.3) | 66 (310.4) | 39 (183.2) | 38 (173.8) | 20 (96.5) |
| Thefts (per 100,000) | 356 (2,281) | 512 (2,769) | 399 (2,129) | 483 (2,561) | 460 (2,407) | 430 (2,198) | 460 (2,287) | 361 (1,761) | 360 (1,693) | 150 (704.7) | 250 (1,144) | 164 (791.0) |
| Auto thefts (per 100,000) | 4 (25.6) | 13 (70.3) | 9 (48.0) | 13 (68.9) | 14 (73.3) | 16 (81.8) | 24 (119.3) | 23 (112.2) | 32 (150.5) | 13 (61.1) | 22 (100.6) | 9 (43.4) |
| Arson (per 100,000) | 0 (0.0) | 1 (5.4) | 0 (0.0) | 0 (0.0) | 0 (0.0) | 1 (5.1) | 0 (0.0) | 0 (0.0) | 1 (4.7) | 0 (0.0) | 0 (0.0) | 1 (4.8) |
| City-Data.com crime index | 273.7 | 212.6 | 203.0 | 214.4 | 201.9 | 173.0 | 180.6 | 165.5 | 153.7 | 94.8 | 108.1 | 84.3 |
The City-Data.com crime index weighs serious crimes and violent crimes more heavily. Higher means more crime, U.S. average is 246.1. It adjusts for the number of visitors and daily workers commuting into cities.
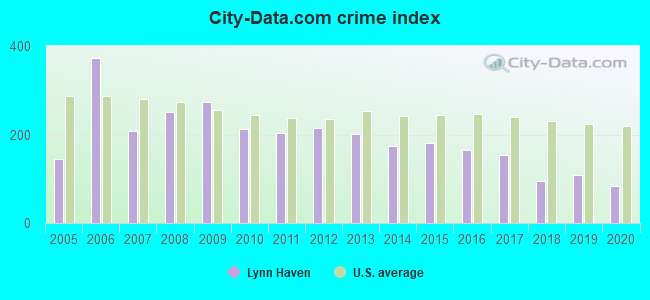
Crime rate in Lynn Haven detailed stats: murders, rapes, robberies, assaults, burglaries, thefts, arson
Full-time law enforcement employees in 2021, including police officers: 48 (37 officers - 35 male; 2 female).
| Officers per 1,000 residents here: | 1.81 |
| Florida average: | 2.33 |
 Recent articles from our blog. Our writers, many of them Ph.D. graduates or candidates, create easy-to-read articles on a wide variety of topics.


 | Lynn Haven FL -- is real estate there an worthy investment? (11 replies) |
| Non Liberal - Pro Constitutional Liberties city/town to move to? (86 replies) |
| Retire to florida? (59 replies) |
| Lynn haven..please help (0 replies) |
| Relocating from Atlanta, GA to Lynn Haven/Panama City Beach-Need Advice from locals PLEASE!!! :) :) (0 replies) |
| Moving to Panama City (9 replies) |
Latest news from Lynn Haven, FL collected exclusively by city-data.com from local newspapers, TV, and radio stations
Ancestries: American (19.2%), English (11.9%), Irish (8.1%), German (4.8%), Italian (2.6%), Scotch-Irish (2.4%).
Current Local Time: CST time zone
Elevation: 10 feet
Land area: 8.15 square miles.
Population density: 2,459 people per square mile (low).
1,406 residents are foreign born (2.7% Latin America, 1.7% Asia, 1.4% Europe, 0.8% Africa).
| This city: | 7.1% |
| Florida: | 21.1% |
Median real estate property taxes paid for housing units with mortgages in 2022: $2,024 (0.6%)
Median real estate property taxes paid for housing units with no mortgage in 2022: $1,851 (0.6%)
Nearest city with pop. 50,000+: Dothan, AL  (69.8 miles , pop. 57,737).
Nearest city with pop. 200,000+: Montgomery, AL (151.4 miles , pop. 201,568).
Nearest city with pop. 1,000,000+: Houston, TX (583.9 miles , pop. 1,953,631).
Nearest cities:
), ), ), ), ), )Latitude: 30.24 N, Longitude: 85.65 W
Daytime population change due to commuting: -860 (-4.3%)
Workers who live and work in this city: 2,501 (23.9%)
Area code: 850
Lynn Haven, Florida accommodation & food services, waste management - Economy and Business Data
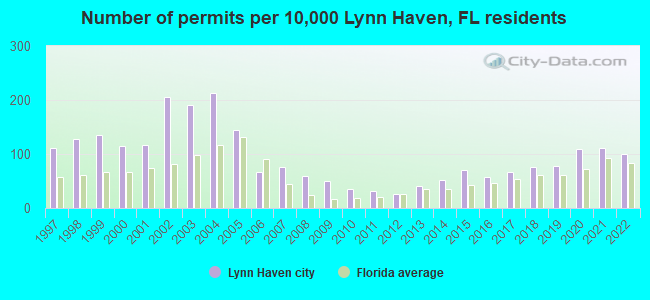
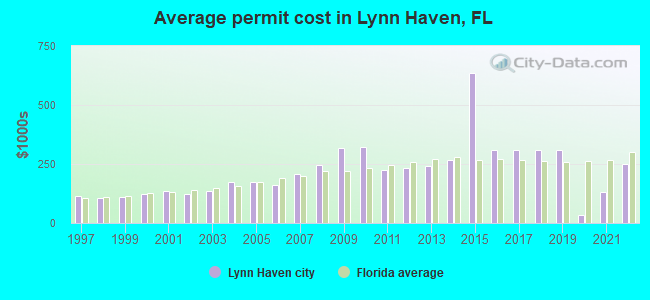
Single-family new house construction building permits:
- 2022: 124 buildings, average cost: $250,300
- 2021: 138 buildings, average cost: $129,500
- 2020: 136 buildings, average cost: $32,200
- 2019: 97 buildings, average cost: $309,100
- 2018: 95 buildings, average cost: $309,100
- 2017: 84 buildings, average cost: $309,100
- 2016: 72 buildings, average cost: $309,100
- 2015: 88 buildings, average cost: $634,300
- 2014: 63 buildings, average cost: $264,700
- 2013: 51 buildings, average cost: $242,900
- 2012: 32 buildings, average cost: $233,600
- 2011: 38 buildings, average cost: $222,900
- 2010: 44 buildings, average cost: $321,500
- 2009: 62 buildings, average cost: $317,300
- 2008: 74 buildings, average cost: $244,500
- 2007: 95 buildings, average cost: $205,700
- 2006: 84 buildings, average cost: $163,200
- 2005: 181 buildings, average cost: $172,400
- 2004: 265 buildings, average cost: $174,800
- 2003: 236 buildings, average cost: $136,000
- 2002: 257 buildings, average cost: $124,700
- 2001: 145 buildings, average cost: $135,800
- 2000: 142 buildings, average cost: $123,700
- 1999: 168 buildings, average cost: $112,300
- 1998: 159 buildings, average cost: $107,800
- 1997: 138 buildings, average cost: $114,900
| Here: | 3.0% |
| Florida: | 2.9% |
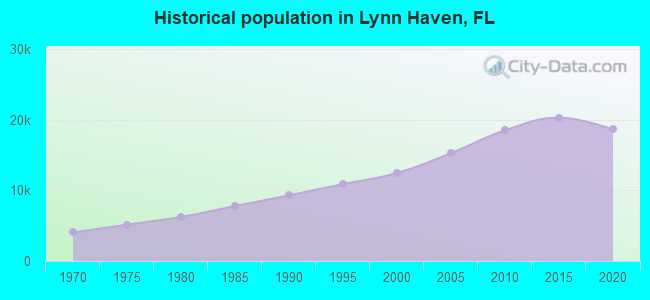
Population change in the 1990s: +2,619 (+26.6%).
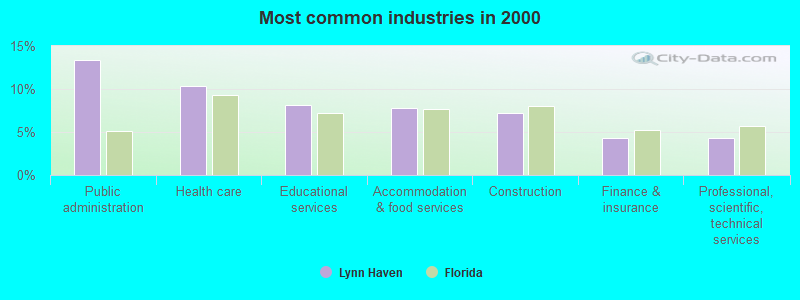
- Public administration (13.3%)
- Health care (10.3%)
- Educational services (8.1%)
- Accommodation & food services (7.7%)
- Construction (7.2%)
- Finance & insurance (4.3%)
- Professional, scientific, technical services (4.2%)
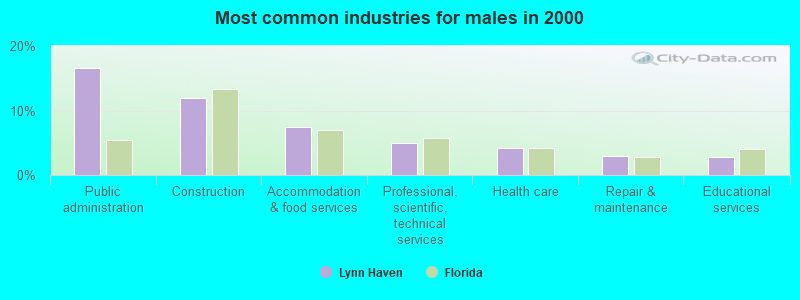
- Public administration (16.5%)
- Construction (12.0%)
- Accommodation & food services (7.5%)
- Professional, scientific, technical services (5.0%)
- Health care (4.2%)
- Repair & maintenance (3.0%)
- Educational services (2.7%)
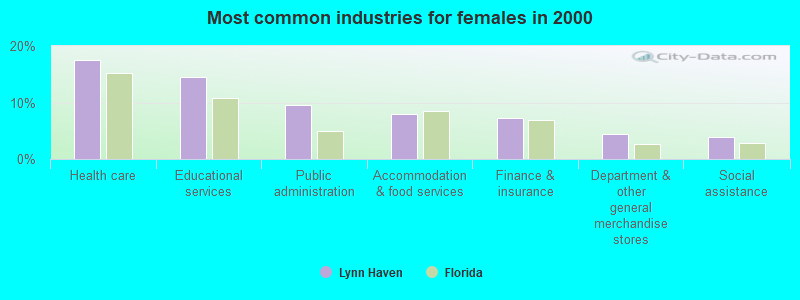
- Health care (17.4%)
- Educational services (14.4%)
- Public administration (9.6%)
- Accommodation & food services (8.0%)
- Finance & insurance (7.3%)
- Department & other general merchandise stores (4.3%)
- Social assistance (3.9%)
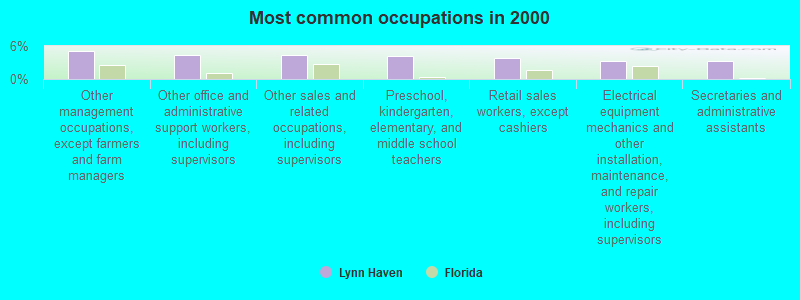
- Other management occupations, except farmers and farm managers (5.1%)
- Other office and administrative support workers, including supervisors (4.4%)
- Other sales and related occupations, including supervisors (4.3%)
- Preschool, kindergarten, elementary, and middle school teachers (4.2%)
- Retail sales workers, except cashiers (3.8%)
- Electrical equipment mechanics and other installation, maintenance, and repair workers, including supervisors (3.2%)
- Secretaries and administrative assistants (3.2%)
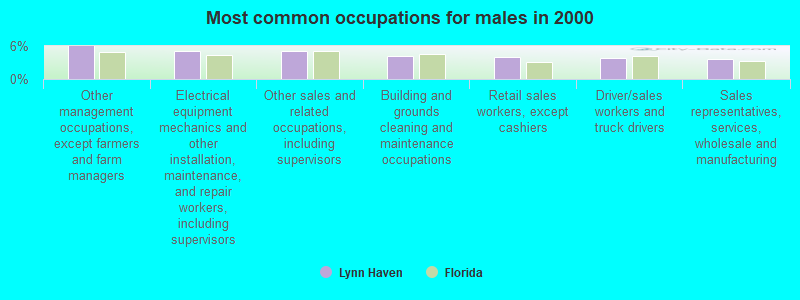
- Other management occupations, except farmers and farm managers (6.0%)
- Electrical equipment mechanics and other installation, maintenance, and repair workers, including supervisors (5.2%)
- Other sales and related occupations, including supervisors (5.1%)
- Building and grounds cleaning and maintenance occupations (4.2%)
- Retail sales workers, except cashiers (4.0%)
- Driver/sales workers and truck drivers (3.8%)
- Sales representatives, services, wholesale and manufacturing (3.7%)

- Other office and administrative support workers, including supervisors (8.5%)
- Preschool, kindergarten, elementary, and middle school teachers (8.0%)
- Secretaries and administrative assistants (6.7%)
- Registered nurses (5.8%)
- Other management occupations, except farmers and farm managers (4.0%)
- Information and record clerks, except customer service representatives (3.7%)
- Retail sales workers, except cashiers (3.6%)
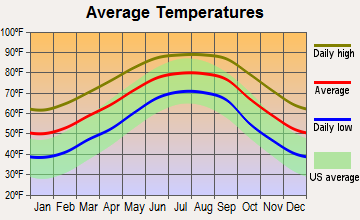
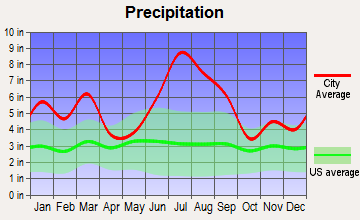
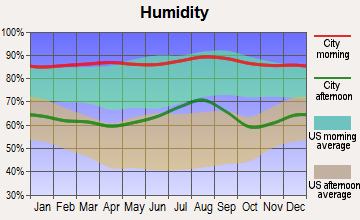
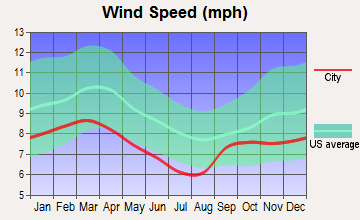
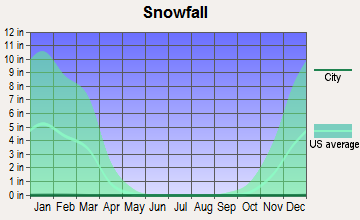
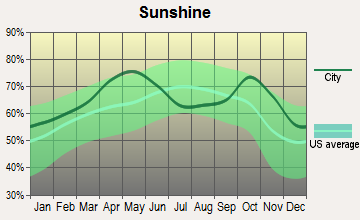
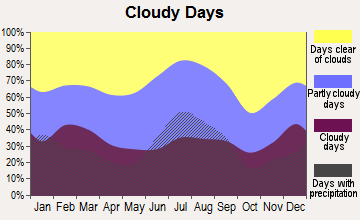
Average climate in Lynn Haven, Florida
Based on data reported by over 4,000 weather stations
|
|

(lower is better)
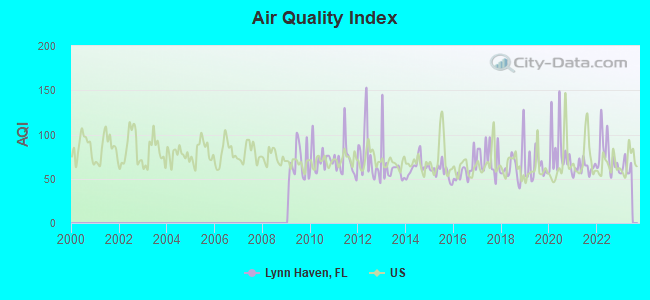
Air Quality Index (AQI) level in 2022 was 76.3. This is about average.
| City: | 76.3 |
| U.S.: | 72.6 |
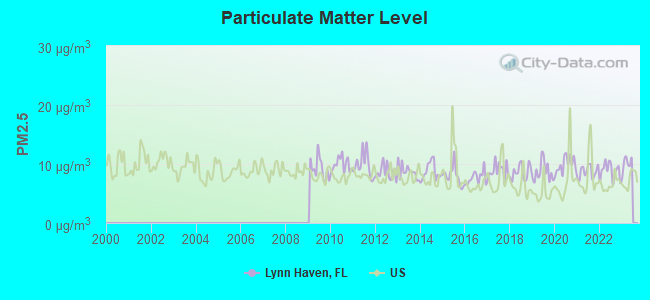
Particulate Matter (PM2.5) [µg/m3] level in 2022 was 8.81. This is about average. Closest monitor was 6.9 miles away from the city center.
| City: | 8.81 |
| U.S.: | 8.11 |
Tornado activity:
Lynn Haven-area historical tornado activity is near Florida state average. It is 2% smaller than the overall U.S. average.
On 12/10/1967, a category F3 (max. wind speeds 158-206 mph) tornado 7.6 miles away from the Lynn Haven city center killed one person and injured 50 people and caused between $500,000 and $5,000,000 in damages.
On 1/2/1999, a category F2 (max. wind speeds 113-157 mph) tornado 4.1 miles away from the city center injured 7 people and caused $4 million in damages.
Earthquake activity:
Lynn Haven-area historical earthquake activity is significantly above Florida state average. It is 71% smaller than the overall U.S. average.On 9/10/2006 at 14:56:08, a magnitude 5.9 (5.9 MB, 5.5 MS, 5.8 MW, Class: Moderate, Intensity: VI - VII) earthquake occurred 282.4 miles away from Lynn Haven center
On 10/24/1997 at 08:35:17, a magnitude 4.9 (4.8 MB, 4.2 MS, 4.9 LG, Depth: 6.2 mi, Class: Light, Intensity: IV - V) earthquake occurred 114.3 miles away from the city center
On 1/18/1999 at 07:00:53, a magnitude 4.8 (4.8 MB, 4.0 LG, Depth: 0.6 mi) earthquake occurred 238.4 miles away from the city center
On 4/29/2003 at 08:59:39, a magnitude 4.9 (4.4 MB, 4.6 MW, 4.9 LG) earthquake occurred 294.3 miles away from the city center
On 5/6/2018 at 16:47:09, a magnitude 4.6 (4.6 MB, Depth: 6.2 mi) earthquake occurred 245.7 miles away from Lynn Haven center
On 9/3/2020 at 15:07:53, a magnitude 3.8 (3.8 MW, Depth: 2.5 mi, Class: Light, Intensity: II - III) earthquake occurred 106.5 miles away from the city center
Magnitude types: regional Lg-wave magnitude (LG), body-wave magnitude (MB), surface-wave magnitude (MS), moment magnitude (MW)
Natural disasters:
The number of natural disasters in Bay County (32) is a lot greater than the US average (15).Major Disasters (Presidential) Declared: 22
Emergencies Declared: 5
Causes of natural disasters: Hurricanes: 16, Floods: 7, Tropical Storms: 6, Storms: 5, Fires: 3, Tornadoes: 3, Winds: 3, Heavy Rain: 1, Other: 1 (Note: some incidents may be assigned to more than one category).
Hospitals and medical centers near Lynn Haven:
- BAY CENTER (Nursing Home, about 4 miles away; PANAMA CITY, FL)
- COMMUNITY HEALTH AND REHABILITATION CENTER (Nursing Home, about 4 miles away; PANAMA CITY, FL)
- CARESOUTH HOMECARE PROFESSIONALS (Home Health Center, about 4 miles away; PANAMA CITY, FL)
- TENDER TOUCH HEALTH CARE SERVICES (Home Health Center, about 4 miles away; PANAMA CITY, FL)
- GULF COAST MEDICAL CENTER Acute Care Hospitals (about 4 miles away; PANAMA CITY, FL)
- FMC - PANAMA CITY (Dialysis Facility, about 4 miles away; PANAMA CITY, FL)
- ST ANDREWS BAY SKILLED NURSING AND REHABILITATION (Nursing Home, about 4 miles away; PANAMA CITY, FL)
Colleges/universities with over 2000 students nearest to Lynn Haven:
- Gulf Coast State College (about 7 miles; Panama City, FL; Full-time enrollment: 4,474)
- Northwest Florida State College (about 54 miles; Niceville, FL; FT enrollment: 5,052)
- Enterprise State Community College (about 75 miles; Enterprise, AL; FT enrollment: 2,101)
- George C Wallace State Community College-Dothan (about 76 miles; Dothan, AL; FT enrollment: 3,611)
- Tallahassee Community College (about 80 miles; Tallahassee, FL; FT enrollment: 10,904)
- Bainbridge State College (about 81 miles; Bainbridge, GA; FT enrollment: 2,308)
- Florida State University (about 82 miles; Tallahassee, FL; FT enrollment: 38,283)
Public high school in Lynn Haven:
Public elementary/middle schools in Lynn Haven:
- LYNN HAVEN ELEMENTARY SCHOOL (Students: 527, Location: 301 W 9TH ST, Grades: PK-5)
- MOWAT MIDDLE SCHOOL (Students: 266, Location: 1903 W HIGHWAY 390, Grades: 6-8)
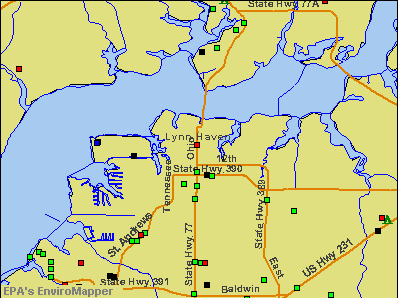
Points of interest:
Notable locations in Lynn Haven: Lynn Haven Golf Course (A), Lynn Haven Fire Department Station 2 (B), Lynn Haven Fire Department Station 1 (C). Display/hide their locations on the map
Churches in Lynn Haven include: Central Pentecostal Ministries (A), First Assembly of God of Lynn Haven (B), Grace Baptist Church (C), Neals Temple (D), Wesleyan Church (E). Display/hide their locations on the map
Cemetery: Lynn Haven Cemetery (1). Display/hide its location on the map
| This city: | 2.5 people |
| Florida: | 2.5 people |
| This city: | 68.8% |
| Whole state: | 65.2% |
| This city: | 5.9% |
| Whole state: | 7.3% |
Likely homosexual households (counted as self-reported same-sex unmarried-partner households)
- Lesbian couples: 0.5% of all households
- Gay men: 0.2% of all households
Banks with branches in Lynn Haven (2011 data):
- Regions Bank: Lynn Haven Branch at 2320 South U.S. Highway 77, branch established on 2002/11/12; Lynnhaven Branch at 630 Ohio Avenue Hwy 77, branch established on 1952/07/28. Info updated 2011/02/24: Bank assets: $123,368.2 mil, Deposits: $98,301.3 mil, headquarters in Birmingham, AL, positive income, Commercial Lending Specialization, 1778 total offices, Holding Company: Regions Financial Corporation
- Prosperity Bank: Lynn Haven Branch at 2606 South Highway 77, branch established on 2006/02/13. Info updated 2010/09/01: Bank assets: $779.3 mil, Deposits: $533.6 mil, headquarters in Saint Augustine, FL, positive income, Commercial Lending Specialization, 16 total offices, Holding Company: Prosperity Banking Company, The
- Hancock Bank: Ohio Avenue Branch at 1302 Ohio Avenue, branch established on 1995/06/26. Info updated 2011/06/14: Bank assets: $4,988.4 mil, Deposits: $4,121.5 mil, headquarters in Gulfport, MS, positive income, Commercial Lending Specialization, 81 total offices, Holding Company: Hancock Holding Company
- SunTrust Bank: Lynn Haven Branch at 700 Florida Avenue, branch established on 1974/05/15. Info updated 2010/05/27: Bank assets: $171,291.7 mil, Deposits: $129,833.2 mil, headquarters in Atlanta, GA, positive income, Commercial Lending Specialization, 1716 total offices, Holding Company: Suntrust Banks, Inc.
- Trustmark National Bank: Lynn Haven Branch at 1912 South Highway 77, branch established on 1984/11/19. Info updated 2012/03/26: Bank assets: $9,612.1 mil, Deposits: $7,410.1 mil, headquarters in Jackson, MS, positive income, Commercial Lending Specialization, 186 total offices, Holding Company: Trustmark Corporation
- BankTrust: Lynn Haven Branch at 2315 State Highway 77, branch established on 1997/11/12. Info updated 2012/01/30: Bank assets: $2,083.8 mil, Deposits: $1,812.7 mil, headquarters in Mobile, AL, positive income, Commercial Lending Specialization, 50 total offices, Holding Company: Banctrust Financial Group, Inc.
For population 15 years and over in Lynn Haven:
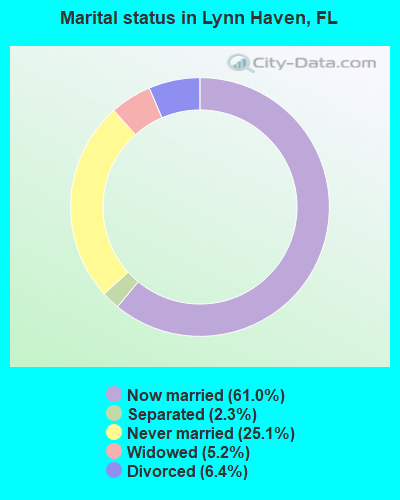
- Never married: 25.1%
- Now married: 61.0%
- Separated: 2.3%
- Widowed: 5.2%
- Divorced: 6.4%
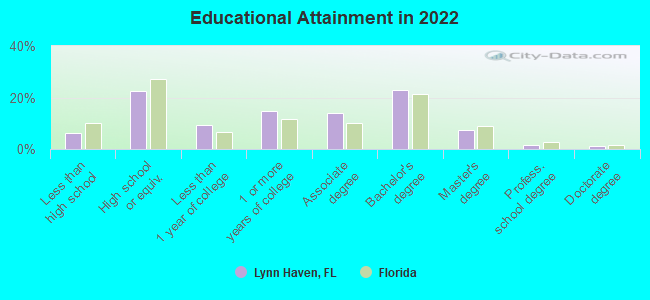
For population 25 years and over in Lynn Haven:
- High school or higher: 93.2%
- Bachelor's degree or higher: 31.9%
- Graduate or professional degree: 9.6%
- Unemployed: 2.5%
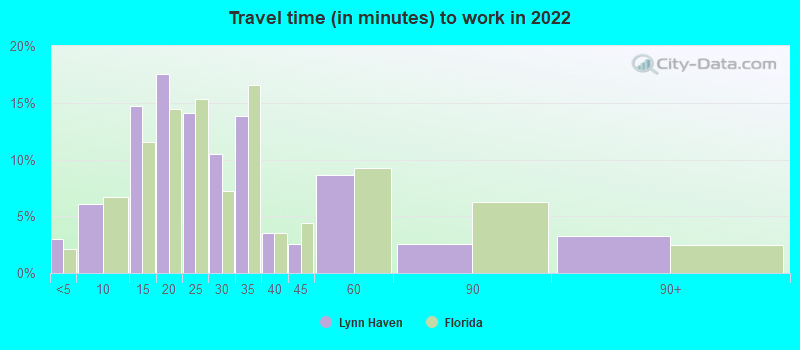
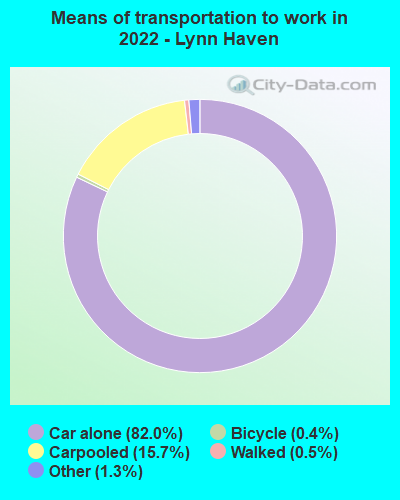
- Mean travel time to work (commute): 22.5 minutes
| Here: | 10.4 |
| Florida average: | 12.2 |
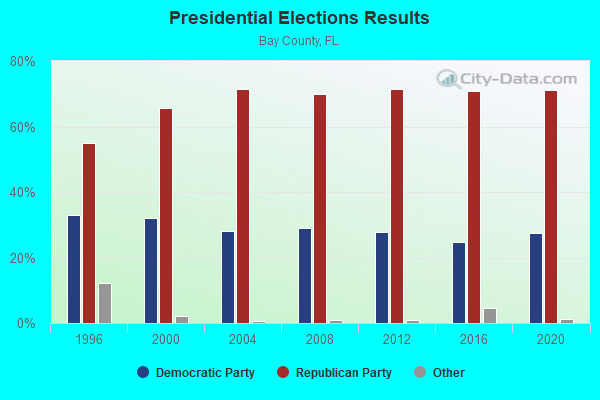
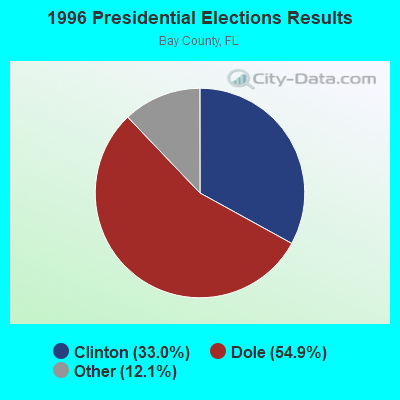


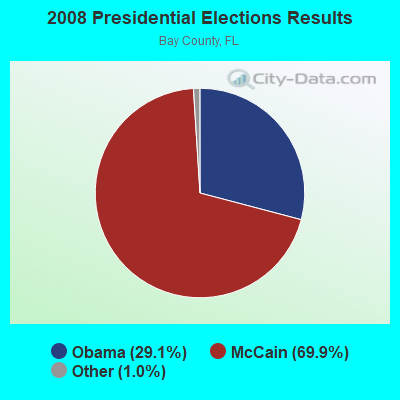

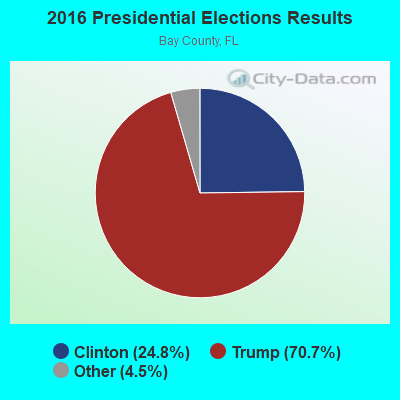

Graphs represent county-level data. Detailed 2008 Election Results
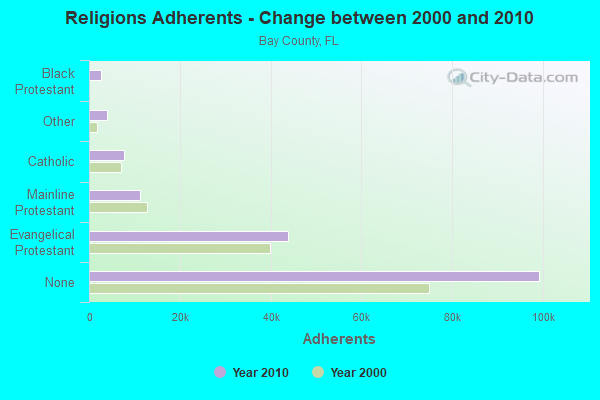
Religion statistics for Lynn Haven, FL (based on Bay County data)
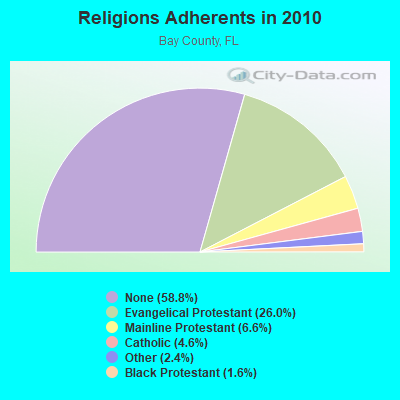
| Religion | Adherents | Congregations |
|---|---|---|
| Evangelical Protestant | 43,852 | 137 |
| Mainline Protestant | 11,220 | 31 |
| Catholic | 7,744 | 7 |
| Other | 4,068 | 18 |
| Black Protestant | 2,685 | 11 |
| Orthodox | 70 | 1 |
| None | 99,213 | - |
Food Environment Statistics:
| Bay County: | 1.83 / 10,000 pop. |
| Florida: | 2.04 / 10,000 pop. |
| Bay County: | 0.18 / 10,000 pop. |
| Florida: | 0.11 / 10,000 pop. |
| This county: | 1.04 / 10,000 pop. |
| Florida: | 1.28 / 10,000 pop. |
| This county: | 5.07 / 10,000 pop. |
| State: | 3.04 / 10,000 pop. |
| Bay County: | 9.17 / 10,000 pop. |
| State: | 7.45 / 10,000 pop. |
| This county: | 10.2% |
| Florida: | 9.2% |
| Bay County: | 25.0% |
| Florida: | 23.7% |
| Bay County: | 11.4% |
| Florida: | 14.0% |
Health and Nutrition:
| Lynn Haven: | 53.1% |
| State: | 51.4% |
| Lynn Haven: | 52.4% |
| Florida: | 49.4% |
| Lynn Haven: | 28.7 |
| State: | 28.6 |
| Lynn Haven: | 19.6% |
| Florida: | 19.5% |
| Lynn Haven: | 9.0% |
| State: | 10.7% |
| Lynn Haven: | 6.8 |
| Florida: | 6.9 |
| Lynn Haven: | 36.0% |
| Florida: | 34.7% |
| This city: | 59.8% |
| Florida: | 57.0% |
| This city: | 80.4% |
| Florida: | 79.2% |
More about Health and Nutrition of Lynn Haven, FL Residents
| Local government employment and payroll (March 2022) | |||||
| Function | Full-time employees | Monthly full-time payroll | Average yearly full-time wage | Part-time employees | Monthly part-time payroll |
|---|---|---|---|---|---|
| Police Protection - Officers | 30 | $146,987 | $58,795 | 0 | $0 |
| Firefighters | 23 | $90,724 | $47,334 | 0 | $0 |
| Sewerage | 16 | $72,748 | $54,561 | 0 | $0 |
| Parks and Recreation | 15 | $52,485 | $41,988 | 0 | $0 |
| Police - Other | 15 | $56,156 | $44,925 | 4 | $2,977 |
| Water Supply | 15 | $58,119 | $46,495 | 0 | $0 |
| Solid Waste Management | 13 | $44,903 | $41,449 | 0 | $0 |
| Other and Unallocable | 13 | $59,995 | $55,380 | 0 | $0 |
| Streets and Highways | 9 | $45,257 | $60,343 | 0 | $0 |
| Financial Administration | 4 | $26,912 | $80,736 | 0 | $0 |
| Local Libraries | 3 | $11,418 | $45,672 | 1 | $2,584 |
| Other Government Administration | 3 | $30,870 | $123,480 | 6 | $5,405 |
| Fire - Other | 1 | $3,115 | $37,380 | 0 | $0 |
| Totals for Government | 160 | $699,689 | $52,477 | 11 | $10,966 |
Lynn Haven government finances - Expenditure in 2017 (per resident):
- Construction - Water Utilities: $761,000 ($37.97)
Sewerage: $570,000 ($28.44)
Regular Highways: $494,000 ($24.65)
General - Other: $419,000 ($20.90)
- Current Operations - Police Protection: $2,763,000 ($137.85)
Water Utilities: $2,535,000 ($126.47)
Sewerage: $2,453,000 ($122.38)
Solid Waste Management: $1,855,000 ($92.55)
Parks and Recreation: $1,440,000 ($71.84)
Local Fire Protection: $1,366,000 ($68.15)
General - Other: $1,225,000 ($61.12)
Central Staff Services: $828,000 ($41.31)
Regular Highways: $559,000 ($27.89)
Natural Resources - Other: $540,000 ($26.94)
Judicial and Legal Services: $361,000 ($18.01)
Financial Administration: $300,000 ($14.97)
Protective Inspection and Regulation - Other: $280,000 ($13.97)
Libraries: $213,000 ($10.63)
- General - Interest on Debt: $619,000 ($30.88)
- Other Capital Outlay - Parks and Recreation: $143,000 ($7.13)
Police Protection: $119,000 ($5.94)
Local Fire Protection: $98,000 ($4.89)
Libraries: $18,000 ($0.90)
Central Staff Services: $11,000 ($0.55)
Financial Administration: $3,000 ($0.15)
- Water Utilities - Interest on Debt: $206,000 ($10.28)
Lynn Haven government finances - Revenue in 2017 (per resident):
- Charges - Sewerage: $3,206,000 ($159.95)
Natural Resources - Other: $2,671,000 ($133.26)
Solid Waste Management: $397,000 ($19.81)
Other: $182,000 ($9.08)
Parks and Recreation: $156,000 ($7.78)
Regular Highways: $95,000 ($4.74)
- Federal Intergovernmental - Other: $89,000 ($4.44)
- Miscellaneous - General Revenue - Other: $2,349,000 ($117.19)
Special Assessments: $1,342,000 ($66.95)
Sale of Property: $159,000 ($7.93)
Rents: $100,000 ($4.99)
Fines and Forfeits: $65,000 ($3.24)
Donations From Private Sources: $23,000 ($1.15)
Interest Earnings: $20,000 ($1.00)
- Revenue - Water Utilities: $3,912,000 ($195.17)
- State Intergovernmental - General Local Government Support: $2,265,000 ($113.00)
Highways: $168,000 ($8.38)
Other: $28,000 ($1.40)
- Tax - Property: $3,946,000 ($196.87)
Public Utilities Sales: $2,172,000 ($108.36)
Occupation and Business License - Other: $1,772,000 ($88.41)
Other License: $254,000 ($12.67)
Motor Fuels Sales: $241,000 ($12.02)
Lynn Haven government finances - Debt in 2017 (per resident):
- Long Term Debt - Outstanding Unspecified Public Purpose: $18,144,000 ($905.21)
Beginning Outstanding - Unspecified Public Purpose: $17,847,000 ($890.39)
Issue, Unspecified Public Purpose: $5,976,000 ($298.14)
Retired Unspecified Public Purpose: $5,651,000 ($281.93)
Lynn Haven government finances - Cash and Securities in 2017 (per resident):
- Other Funds - Cash and Securities: $13,028,000 ($649.97)
- Sinking Funds - Cash and Securities: $4,487,000 ($223.86)
10.59% of this county's 2021 resident taxpayers lived in other counties in 2020 ($63,036 average adjusted gross income)
| Here: | 10.59% |
| Florida average: | 8.80% |
0.16% of residents moved from foreign countries ($900 average AGI)
Bay County: 0.16% Florida average: 0.05%
Top counties from which taxpayers relocated into this county between 2020 and 2021:
| from Walton County, FL | |
| from Leon County, FL | |
| from Washington County, FL |
7.99% of this county's 2020 resident taxpayers moved to other counties in 2021 ($51,725 average adjusted gross income)
| Here: | 7.99% |
| Florida average: | 7.45% |
0.09% of residents moved to foreign countries ($825 average AGI)
Bay County: 0.09% Florida average: 0.04%
Top counties to which taxpayers relocated from this county between 2020 and 2021:
| to Washington County, FL | |
| to Leon County, FL | |
| to Walton County, FL |
| Businesses in Lynn Haven, FL | ||||
| Name | Count | Name | Count | |
|---|---|---|---|---|
| Advance Auto Parts | 1 | Pizza Hut | 1 | |
| Arby's | 1 | Popeyes | 1 | |
| AutoZone | 1 | Publix Super Markets | 1 | |
| Burger King | 1 | SONIC Drive-In | 1 | |
| CVS | 1 | Starbucks | 1 | |
| Dairy Queen | 1 | Subway | 2 | |
| Domino's Pizza | 1 | T-Mobile | 1 | |
| FedEx | 2 | Taco Bell | 1 | |
| Goodwill | 1 | UPS | 1 | |
| H&R Block | 1 | Vans | 2 | |
| KFC | 1 | Waffle House | 1 | |
| Kroger | 1 | Walgreens | 1 | |
| Little Caesars Pizza | 1 | Walmart | 1 | |
| MasterBrand Cabinets | 3 | Wingate | 1 | |
Strongest AM radio stations in Lynn Haven:
- WDIZ (590 AM; 2 kW; PANAMA CITY, FL; Owner: CLEAR CHANNEL BROADCASTING LICENSES, INC.)
- WLTG (1430 AM; 5 kW; PANAMA CITY, FL; Owner: HOUR GROUP BROADCASTING, INC.)
- WZEP (1460 AM; 10 kW; DEFUNIAK SPRINGS, FL; Owner: WALTON COUNTY BROADCASTING, INC.)
- WSTT (730 AM; 25 kW; THOMASVILLE, GA; Owner: MARION R. WILLIAMS)
- WKGC (1480 AM; 0 kW; PANAMA CITY BEACH, FL; Owner: GULF COAST COMMUNITY COLLEGE)
- WYBT (1000 AM; daytime; 5 kW; BLOUNTSTOWN, FL; Owner: BLOUNTSTOWN COMMUNICATIONS, INC.)
- WASG (550 AM; 25 kW; ATMORE, AL; Owner: 550 AM, INC)
- WPCF (1290 AM; 0 kW; PANAMA CITY BEACH, FL; Owner: STYLES MEDIA GROUP, LLC)
- WEBY (1330 AM; 25 kW; MILTON, FL; Owner: SPINNAKER LICENSE CORPORATION)
- WGTX (1280 AM; 5 kW; DE FUNIAK SPRINGS, FL)
- WTCL (1580 AM; daytime; 10 kW; CHATTAHOOCHEE, FL; Owner: METZ, INC.)
- WFVR (910 AM; 50 kW; VALDOSTA, GA; Owner: RAMA COMMUNICATIONS, INC.)
- WOOF (560 AM; 5 kW; DOTHAN, AL; Owner: WOOF, INC.)
Strongest FM radio stations in Lynn Haven:
- WYOO (101.1 FM; SPRINGFIELD, FL; Owner: STYLES MEDIA GROUP, LLC)
- WRBA (95.9 FM; SPRINGFIELD, FL; Owner: WAITT BROADCASTING OF FLORIDA, L.L.C.)
- WLHR (107.9 FM; PANAMA CITY, FL; Owner: WAITT BROADCASTING OF FLORIDA, L.L.C.)
- WFSY (98.5 FM; PANAMA CITY, FL; Owner: CLEAR CHANNEL BROADCASTING LICENSES, INC.)
- WVVE (100.1 FM; PANAMA CITY BEACH, FL; Owner: STYLES MEDIA GROUP, LLC)
- WILN (105.9 FM; PANAMA CITY, FL; Owner: STYLES MEDIA GROUP, LLC)
- WMXP (103.5 FM; CALLAWAY, FL; Owner: WAITT BROADCASTING OF FLORIDA, L.L.C.)
- WASJ (105.1 FM; PANAMA CITY BEACH, FL; Owner: WAITT BROADCASTING OF FLORIDA, L.L.C.)
- WYYX (97.7 FM; BONIFAY, FL; Owner: STYLES MEDIA GROUP, LLC)
- WPAP-FM (92.5 FM; PANAMA CITY, FL; Owner: CLEAR CHANNEL BROADCASTING LICENSES, INC.)
- WKGC-FM (90.7 FM; PANAMA CITY, FL; Owner: GULF COAST COMMUNITY COLLEGE)
- WDJR (96.9 FM; ENTERPRISE, AL; Owner: GULF SOUTH COMMUNICATIONS, INC.)
- WFSW (89.1 FM; PANAMA CITY, FL; Owner: FLORIDA STATE UNIVERSITY)
- WFBX (94.5 FM; PARKER, FL; Owner: CLEAR CHANNEL BROADCASTING LICENSES, INC.)
- W203BJ (88.5 FM; PANAMA CITY, FL; Owner: CALVARY CHAPEL OF TWIN FALLS, INC.)
- WPBH (99.3 FM; MEXICO BEACH, FL; Owner: CLEAR CHANNEL BROADCASTING LICENSES, INC.)
TV broadcast stations around Lynn Haven:
- WPCY-LP (Channel 26; PANAMA CITY, FL; Owner: TIGER EYE BROADCASTING CORPORATION)
- WPCT (Channel 46; PANAMA CITY BEACH, FL; Owner: BEACH TV PROPERTIES, INC.)
- W17CG (Channel 17; PANAMA CITY, FL; Owner: RICHARD & LISA GOETZ)
- W14CN (Channel 14; PANAMA CITY, FL; Owner: RICHARD & LISA GOETZ)
- WMBB (Channel 13; PANAMA CITY, FL; Owner: MEDIA GENERAL BROADCASTING OF SO. CAROLINA HOLDINGS, INC.)
- W50BP (Channel 50; PANAMA CITY, FL; Owner: TIGER EYE BROADCASTING CORPORATION)
- WPGX (Channel 28; PANAMA CITY, FL; Owner: WAITT LICENSE CO. OF FLORIDA, INC.)
- W36BU (Channel 36; PANAMA CITY, FL; Owner: RICHARD & LISA GOETZ)
- WJHG-TV (Channel 7; PANAMA CITY, FL; Owner: WJHG LICENSEE CORP.)
- WBIF (Channel 51; MARIANNA, FL; Owner: MARIANNA BROADCASTING, INC.)
- W54CU (Channel 54; PANAMA CITY, FL; Owner: TRINITY BROADCASTING NETWORK)
- WTVY (Channel 4; DOTHAN, AL; Owner: GRAY MIDAMERICA TV LICENSEE CORP.)
- WPFN-CA (Channel 22; PANAMA CITY, FL; Owner: BEACH TV PROPERTIES, INC.)
- WFSG (Channel 56; PANAMA CITY, FL; Owner: BOARD OF REGENTS OF FLORIDA)
- National Bridge Inventory (NBI) Statistics
- 20Number of bridges
- 627ft / 191mTotal length
- $1,125,000Total costs
- 131,585Total average daily traffic
- 9,871Total average daily truck traffic
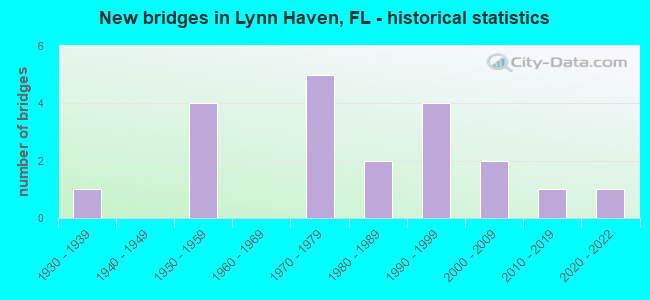
- New bridges - historical statistics
- 11930-1939
- 41950-1959
- 51970-1979
- 21980-1989
- 41990-1999
- 22000-2009
- 12010-2019
- 12020-2022
FCC Registered Antenna Towers:
32 (See the full list of FCC Registered Antenna Towers in Lynn Haven)FCC Registered Broadcast Land Mobile Towers:
7- Panama City Ccc 3609 Hwy 390 (Lat: 30.213806 Lon: -85.671861), Call Sign: KVA509,
Assigned Frequencies: 45.1600 MHz, Grant Date: 08/09/2012, Expiration Date: 11/02/2022, Cancellation Date: 09/10/2021, Registrant: Florida Department Of Correction, 501 Sout Calhoun Street, Tallahassee, FL 32399, Phone: (850) 717-3195, Email:
- Sr 391 4.8 Mi Sw Sr 77 (Lat: 30.269361 Lon: -85.700472), Call Sign: KFZ395,
Assigned Frequencies: 153.665 MHz, Grant Date: 09/05/2000, Expiration Date: 08/07/2005, Cancellation Date: 02/11/2005, Registrant: Mcdermott Will & Emery LLP, 600 Thirteenth Street, N.W., Washington, DC 20005-3096, Phone: (202) 756-8283, Fax: (202) 756-8087, Email:
- Lat: 30.246667 Lon: -85.635944, Call Sign: WQBY794,
Assigned Frequencies: 451.337 MHz, 451.362 MHz, 452.112 MHz, 452.137 MHz, Grant Date: 01/26/2015, Expiration Date: 01/07/2025, Certifier: Tom Wallwork, Registrant: Federal Licensing Inc, 1588 Fairfield Road, Gettysburg, PA 17325, Phone: (717) 334-9262, Fax: (717) 334-6440
- 2604 S Highway 77 (Lat: 30.223389 Lon: -85.649111), Call Sign: WQDZ960,
Assigned Frequencies: 469.212 MHz, 469.037 MHz, 469.237 MHz, 469.062 MHz, 469.262 MHz, 469.087 MHz, 469.287 MHz, 469.112 MHz, 469.312 MHz, 469.137 MHz... (+21 more), Grant Date: 12/12/2005, Expiration Date: 12/12/2015, Cancellation Date: 02/13/2016, Certifier: Andrew F Brush, Registrant: Panasonic System Solutions Company, 1707 N. Randall Rd, E1-D9, Elgin, IL 60123-7847, Phone: (847) 468-5318, Fax: (847) 574-7614, Email:
- 1508 Ohio Avenue (Lat: 30.235722 Lon: -85.635222), Call Sign: WQGL849,
Assigned Frequencies: 33.4000 MHz, 154.540 MHz, 33.1600 MHz, 154.515 MHz, 30.8400 MHz, 35.0200 MHz, 31.2400 MHz, 151.835 MHz, Grant Date: 02/27/2007, Expiration Date: 02/27/2017, Cancellation Date: 04/29/2017, Certifier: John Robinson, Registrant: Radio Licensing Contractors, Edmond, OK 73083, Phone: (479) 381-9273, Email:
- Lat: 30.220889 Lon: -85.662778, Call Sign: WRAN836,
Assigned Frequencies: 464.812 MHz, 464.837 MHz, 464.950 MHz, 469.812 MHz, 469.950 MHz, Grant Date: 01/17/2018, Expiration Date: 01/17/2028, Certifier: Sionna Courtney, Registrant: Precision Communications, Inc, 508 Mulberry Ave, Panama City, FL 32401, Phone: (850) 763-8499, Fax: (850) 763-8799, Email:
- Lat: 30.231111 Lon: -85.658333, Call Sign: WRER364,
Assigned Frequencies: 451.587 MHz, 452.412 MHz, 456.562 MHz, 456.587 MHz, 457.412 MHz, Grant Date: 12/04/2019, Expiration Date: 12/04/2029, Certifier: Ron Sharpe, Registrant: Mobile Communications America, 4408 Delwood Ln Suite 28, Panama City Beach, FL 32408, Phone: (850) 769-7170, Email:
FCC Registered Microwave Towers:
6- STATION, Plant Smith State Rd 391 4.8 Mi Sw State Rd 77 (Lat: 30.269361 Lon: -85.700472), Structure height: 49.1 m, Overall height: 52.1 m, Call Sign: WNTC319,
Assigned Frequencies: 952.656 MHz, 928.656 MHz, Grant Date: 01/22/2000, Expiration Date: 04/04/2010, Cancellation Date: 06/05/2010, Registrant: Mcdermott Will & Emery LLP, 600 Thirteenth Street, N.W., Washington, DC 20005-3096, Phone: (202) 756-8082, Fax: (202) 756-8087, Email:
- PRICE LYNN HAVEN, 403 E 19th St (Lat: 30.231389 Lon: -85.645833), Type: Ltower, Structure height: 56.4 m, Overall height: 61 m, Call Sign: WRCK399,
Assigned Frequencies: 11325.0 MHz, 11325.0 MHz, 11325.0 MHz, 19375.0 MHz, 11225.0 MHz, 19475.0 MHz, 11425.0 MHz, Grant Date: 10/24/2018, Expiration Date: 04/22/2019, Cancellation Date: 02/19/2019, Certifier: Gina Cacciatore, Registrant: Verizon Wireless, 5055 North Point Pkwy, Np2ne Network Engineering, Alpharetta, GA 30022, Phone: (770) 797-1070, Email:
- PRICE LYN HV, 403 E 19th St (Lat: 30.231389 Lon: -85.645833), Type: Ltower, Structure height: 56.4 m, Overall height: 61 m, Call Sign: WRCK764,
Assigned Frequencies: 18060.0 MHz, 18060.0 MHz, 18060.0 MHz, 18060.0 MHz, 18060.0 MHz, 18060.0 MHz, 18060.0 MHz, 18060.0 MHz, 18060.0 MHz, 18060.0 MHz, Grant Date: 10/26/2018, Expiration Date: 04/24/2019, Cancellation Date: 02/19/2019, Certifier: Gina Cacciatore, Registrant: Verizon Wireless, 5055 North Point Pkwy, Np2ne Network Engineering, Alpharetta, GA 30022, Phone: (770) 797-1070, Email:
- JA03MR004, 1901 Michigan Avenue (Lat: 30.230556 Lon: -85.646111), Type: Ltower, Structure height: 91.5 m, Overall height: 97.5 m, Call Sign: WRCL458,
Assigned Frequencies: 11135.0 MHz, 11175.0 MHz, 11135.0 MHz, 11175.0 MHz, 11135.0 MHz, 11175.0 MHz, 11135.0 MHz, 11175.0 MHz, 11135.0 MHz, 11175.0 MHz... (+10 more), Grant Date: 10/31/2018, Expiration Date: 04/29/2019, Cancellation Date: 11/06/2018, Certifier: Garrie C Losee, Registrant: Sprint Corporation, 12502 Sunrise Valley Drive, M/S: Varesa0209, Reston, VA 20196, Phone: (800) 572-8256, Fax: (703) 433-4483, Email:
- COMCAST MAW, 416 E 19th St (Lat: 30.230500 Lon: -85.646222), Type: Mast, Structure height: 19.2 m, Call Sign: WRCM261,
Assigned Frequencies: 17815.0 MHz, 17915.0 MHz, Grant Date: 11/06/2018, Expiration Date: 05/05/2019, Cancellation Date: 02/19/2019, Certifier: Gina Cacciatore, Registrant: Verizon Wireless (Vaw) LLC, 5055 North Point Pkwy, Np2ne Network Engineering, Alpharetta, GA 30022, Phone: (770) 797-1070, Email:
- STATION, Plant Smith State Rd 391 4.8 Mi Sw Of State Rd 77 (Lat: 30.269361 Lon: -85.700472), Structure height: 49.1 m, Overall height: 52.1 m, Call Sign: WAA611,
Assigned Frequencies: 1915.00 MHz, 1975.00 MHz, Grant Date: 07/28/1994, Expiration Date: 07/28/1999, Cancellation Date: 06/16/1997, Phone: (904) 444-6540
FCC Registered Maritime Coast & Aviation Ground Towers:
1- 401 Florida Ave (Lat: 30.250194 Lon: -85.636028), Type: Building, Overall height: 5 m, Call Sign: WHG971, Licensee ID: L01210119,
Assigned Frequencies: 156.450 MHz, 4.12640 MHz, 156.800 MHz, 6.23140 MHz, 8.29540 MHz, 12.3574 MHz, Grant Date: 04/05/2001, Expiration Date: 04/17/2011, Cancellation Date: 06/18/2011, Registrant: Bartholomew O Niquet, 401 Florida Ave, Lynn Haven, FL 32444
FCC Registered Amateur Radio Licenses:
149 (See the full list of FCC Registered Amateur Radio Licenses in Lynn Haven)FAA Registered Aircraft Manufacturers and Dealers:
2 (See the full list of FAA Registered Manufacturers and Dealers in Lynn Haven)FAA Registered Aircraft:
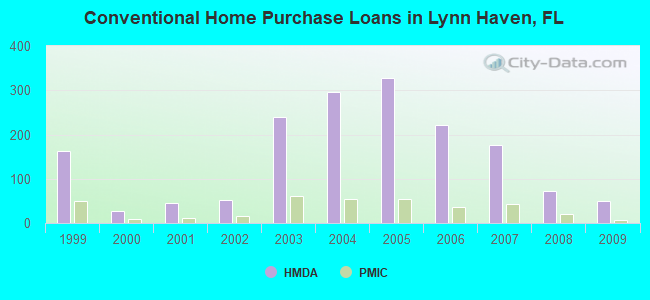
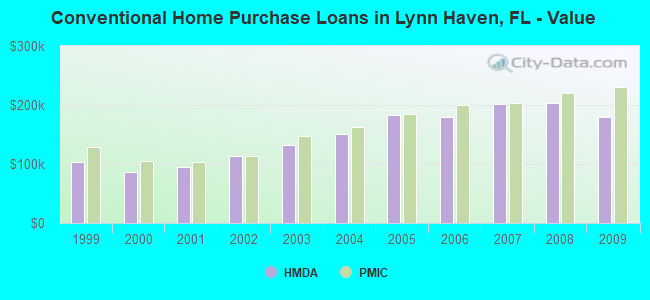
18 (See the full list of FAA Registered Aircraft)| Home Mortgage Disclosure Act Aggregated Statistics For Year 2009 (Based on 5 partial tracts) | ||||||||||||
| A) FHA, FSA/RHS & VA Home Purchase Loans | B) Conventional Home Purchase Loans | C) Refinancings | D) Home Improvement Loans | F) Non-occupant Loans on < 5 Family Dwellings (A B C & D) | G) Loans On Manufactured Home Dwelling (A B C & D) | |||||||
|---|---|---|---|---|---|---|---|---|---|---|---|---|
| Number | Average Value | Number | Average Value | Number | Average Value | Number | Average Value | Number | Average Value | Number | Average Value | |
| LOANS ORIGINATED | 93 | $195,568 | 49 | $179,813 | 231 | $184,601 | 15 | $75,978 | 15 | $127,529 | 2 | $52,570 |
| APPLICATIONS APPROVED, NOT ACCEPTED | 5 | $159,944 | 1 | $535,490 | 22 | $200,827 | 1 | $19,290 | 1 | $86,170 | 1 | $91,840 |
| APPLICATIONS DENIED | 10 | $131,026 | 11 | $107,922 | 79 | $179,607 | 12 | $48,642 | 7 | $150,784 | 5 | $76,186 |
| APPLICATIONS WITHDRAWN | 15 | $205,853 | 7 | $225,284 | 55 | $198,017 | 4 | $85,155 | 2 | $212,370 | 1 | $124,340 |
| FILES CLOSED FOR INCOMPLETENESS | 1 | $231,190 | 2 | $116,450 | 11 | $195,776 | 0 | $0 | 1 | $55,760 | 0 | $0 |
Detailed HMDA statistics for the following Tracts: 0013.00 , 0014.01, 0014.02, 0015.02
| Private Mortgage Insurance Companies Aggregated Statistics For Year 2009 (Based on 5 partial tracts) | ||||
| A) Conventional Home Purchase Loans | B) Refinancings | |||
|---|---|---|---|---|
| Number | Average Value | Number | Average Value | |
| LOANS ORIGINATED | 6 | $230,098 | 6 | $208,313 |
| APPLICATIONS APPROVED, NOT ACCEPTED | 4 | $284,688 | 3 | $239,550 |
| APPLICATIONS DENIED | 1 | $103,870 | 2 | $253,615 |
| APPLICATIONS WITHDRAWN | 0 | $0 | 0 | $0 |
| FILES CLOSED FOR INCOMPLETENESS | 1 | $132,010 | 0 | $0 |
Detailed PMIC statistics for the following Tracts: 0013.00 , 0014.01, 0014.02, 0015.02
2002 - 2018 National Fire Incident Reporting System (NFIRS) incidents
- Fire incident types reported to NFIRS in Lynn Haven, FL
- 30536.1%Outside Fires
- 30436.0%Structure Fires
- 15418.2%Mobile Property/Vehicle Fires
- 819.6%Other
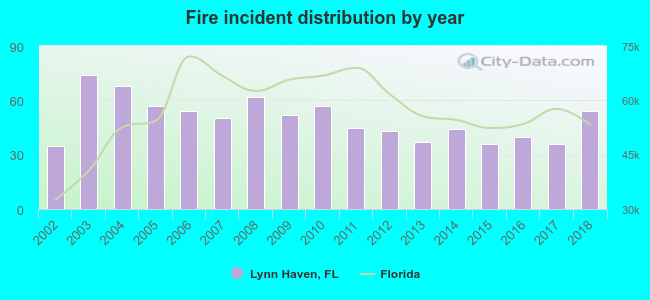 According to the data from the years 2002 - 2018 the average number of fire incidents per year is 50. The highest number of fire incidents - 74 took place in 2003, and the least - 35 in 2002. The data has a rising trend.
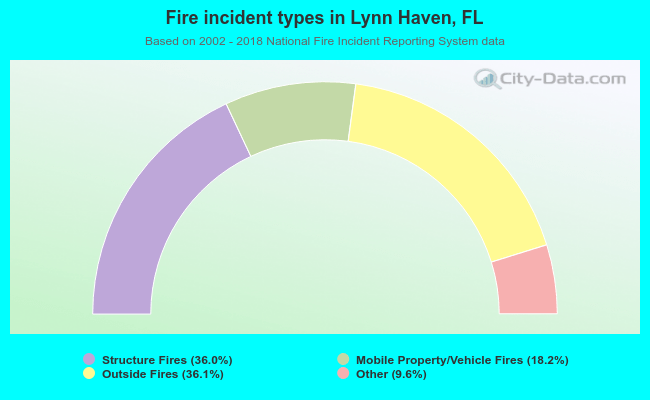 When looking into fire subcategories, the most reports belonged to: Outside Fires (36.1%), and Structure Fires (36.0%).
| Most common first names in Lynn Haven, FL among deceased individuals | ||
| Name | Count | Lived (average) |
|---|---|---|
| James | 97 | 71.4 years |
| William | 86 | 72.4 years |
| Robert | 79 | 69.6 years |
| Mary | 77 | 74.5 years |
| John | 75 | 74.1 years |
| Charles | 44 | 72.1 years |
| Thomas | 36 | 73.6 years |
| George | 29 | 72.3 years |
| Ruth | 26 | 79.9 years |
| Joseph | 26 | 75.6 years |
| Most common last names in Lynn Haven, FL among deceased individuals | ||
| Last name | Count | Lived (average) |
|---|---|---|
| Smith | 33 | 74.6 years |
| Jones | 26 | 76.5 years |
| Brown | 26 | 77.3 years |
| Williams | 25 | 78.3 years |
| Johnson | 25 | 73.4 years |
| Taylor | 19 | 72.2 years |
| Griffin | 19 | 73.2 years |
| Davis | 18 | 75.0 years |
| Anderson | 15 | 75.7 years |
| Barnes | 13 | 75.5 years |
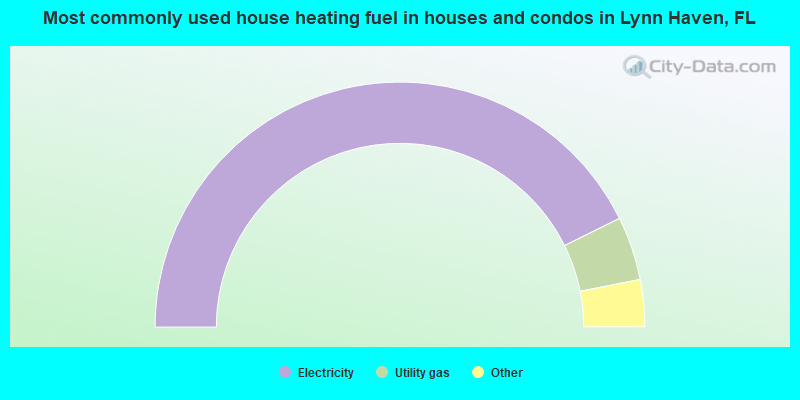
- 85.4%Electricity
- 8.4%Utility gas
- 2.8%Solar energy
- 2.7%Bottled, tank, or LP gas
- 0.5%No fuel used
- 0.1%Coal or coke
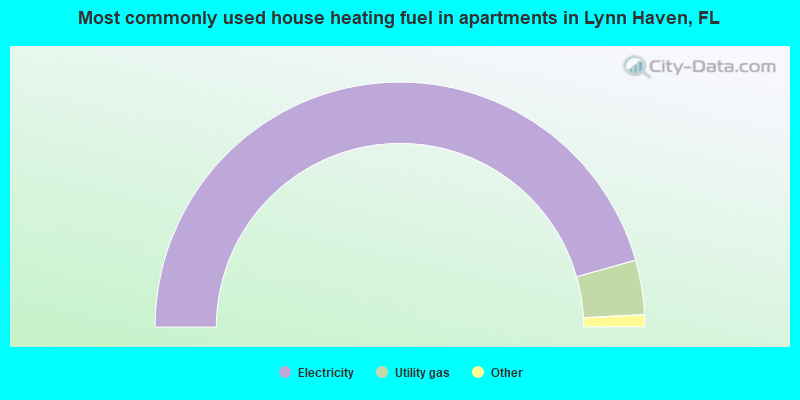
- 91.2%Electricity
- 7.2%Utility gas
- 1.0%No fuel used
- 0.5%Wood
Lynn Haven compared to Florida state average:
- Unemployed percentage significantly below state average.
- Hispanic race population percentage below state average.
- Foreign-born population percentage below state average.
- Length of stay since moving in significantly above state average.
- House age below state average.

|
|
Total of 36 patent applications in 2008-2024.