Housing density: 1,160 houses/condos per square mile
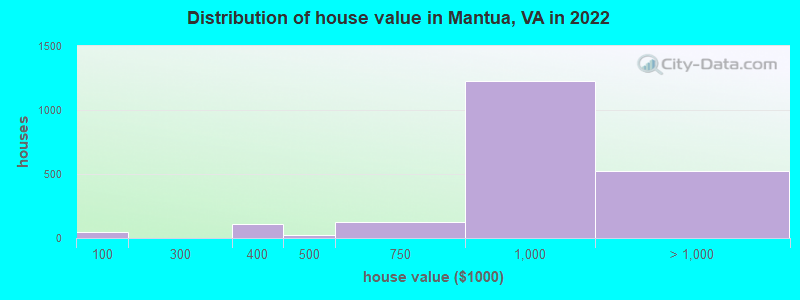
Median price asked for vacant for-sale houses and condos in 2022 in this county: $1,038,941.
Median contract rent in 2022: $1,767
Median rent asked for vacant for-rent units in 2022: $1,757
Median gross rent in Mantua, VA in 2022: $1,803
Housing units in Mantua with a mortgage: 1,361 (109 second mortgage, 0 home equity loan, 97 both second mortgage and home equity loan) Houses without a mortgage: 90
Median household income for houses/condos with a mortgage: $250,911
Median household income for apartments without a mortgage: $184,247
Median monthly housing costs: $2,673
Compare current foreclosures near Mantua, VA:
#1
$289,000
Pooks Hill Rd Apt 1612s
Bethesda, MD 20814
1,250
sq. feet
1
baths
2
beds
#2
$265,900
Crafford Pl
Fort Washington, MD 20744
1,890
sq. feet
1
baths
3
beds
#3
$359,900
Wilson Ln Apt 204
Mc Lean, VA 22102
925
sq. feet
1
baths
2
beds
#4
$395,000
17th St NW Apt 504
Washington, DC 20009
800
sq. feet
1
baths
1
beds
#5
$259,900
Cathedral Ave NW Apt 108
Washington, DC 20016
765
sq. feet
1
baths
1
beds
#6
$277,900
T St SE Apt 3
Washington, DC 20020
-
sq. feet
2
baths
4
beds
#7
$89,750
Wilson Bridge Dr Unit #6770 A-2
Oxon Hill, MD 20745
-
sq. feet
1
baths
1
beds
#8
$331,760
Snowflower Blvd
Oxon Hill, MD 20745
-
sq. feet
2
baths
3
beds
#9
$139,900
Delaware Ave SW Apt N720
Washington, DC 20024
-
sq. feet
1
baths
1
beds
#10
Beechcliff Dr
Alexandria, VA 22306
2,365
sq. feet
3
baths
3
beds
#11
Oakwood St SE Apt B5
Washington, DC 20032
628
sq. feet
1
baths
1
beds
#12
Wilson Boulevard, Unit 101, Falls Church, Va 22044
Size of family households: 876 2-persons, 287 3-persons, 733 4-persons, 134 5-persons, 27 6-persons, 10 7-or-more-persons.
Size of nonfamily households: 434 1-person, 90 2-persons, 37 3-persons.
1,600 married couples with children.
129 single-parent households (73 men, 56 women).
76.8% of residents of Mantua speak English at home.
6.0% of residents speak Spanish at home (53% speak English very well, 20% speak English well, 13% speak English not well, 14% don't speak English at all).
8.1% of residents speak other Indo-European language at home (66% speak English very well, 21% speak English well, 3% speak English not well, 10% don't speak English at all).
6.4% of residents speak Asian or Pacific Island language at home (49% speak English very well, 44% speak English well, 7% speak English not well).
3.0% of residents speak other language at home (97% speak English very well, 3% speak English well).
Foreign born population: 1,429 (19.1%)
(63.2% of them are naturalized citizens)
Year of entry for the foreign-born population in Mantua, Virginia
5532010 or later
2782000 to 2009
3911990 to 1999
2631980 to 1989
2001970 to 1979
195Before 1970
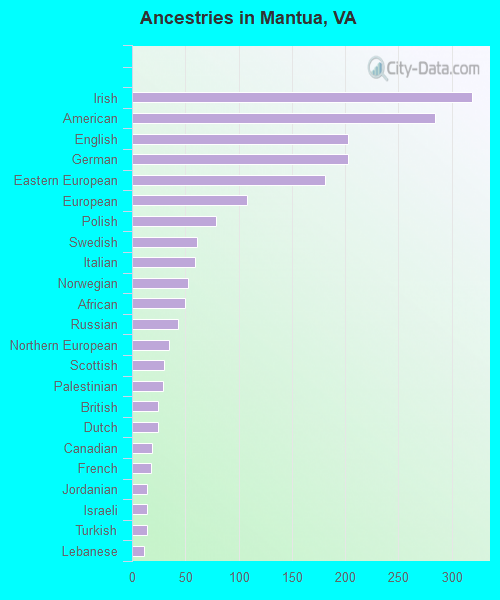
First ancestries reported:
Irish: 319 (8.6%)
American: 284 (7.6%)
English: 203 (5.4%)
German: 203 (5.4%)
Eastern European: 181 (4.9%)
European: 108 (2.9%)
Polish: 79 (2.1%)
Swedish: 61 (1.6%)
Italian: 59 (1.6%)
Norwegian: 53 (1.4%)
African: 50 (1.3%)
Russian: 43 (1.2%)
Northern European: 35 (0.9%)
Scottish: 30 (0.8%)
Palestinian: 29 (0.8%)
British: 24 (0.6%)
Dutch: 24 (0.6%)
Canadian: 19 (0.5%)
French: 18 (0.5%)
Jordanian: 14 (0.4%)
Israeli: 14 (0.4%)
Turkish: 14 (0.4%)
Lebanese: 11 (0.3%)
Most common places of birth for foreign-born residents (%):
India
Mantua:
13.1% (187)
Virginia:
9.0% (97,830)
Colombia
Mantua:
8.3% (119)
Virginia:
1.3% (14,435)
Israel
Mantua:
7.8% (112)
Virginia:
0.1% (1,474)
China, excluding Hong Kong and Taiwan
Mantua:
7.1% (102)
Virginia:
3.9% (42,989)
Korea
Mantua:
6.6% (95)
Virginia:
4.9% (52,857)
Lebanon
Mantua:
6.4% (92)
Virginia:
0.5% (5,428)
Bolivia
Mantua:
6.1% (87)
Virginia:
2.4% (25,722)
Pakistan
Mantua:
5.6% (80)
Virginia:
2.3% (24,582)
Vietnam
Mantua:
5.2% (74)
Virginia:
4.2% (45,750)
Burma (Myanmar)
Mantua:
4.3% (61)
Virginia:
0.2% (1,815)
Sweden
Mantua:
3.7% (53)
Virginia:
0.1% (1,352)
Singapore
Mantua:
2.9% (42)
Virginia:
0.1% (711)
Netherlands
Mantua:
2.6% (37)
Virginia:
0.2% (2,246)
Russia
Mantua:
2.4% (34)
Virginia:
0.9% (9,440)
Peru
Mantua:
1.7% (25)
Virginia:
2.4% (26,366)
Ethiopia
Mantua:
1.6% (23)
Virginia:
2.9% (32,082)
Place of birth for U.S.-born residents:
This state: 2,080
Other state: 3,776
Northeast: 1,406
Midwest: 664
South: 1,316
West: 404
85.7% of Mantua residents lived in the same house 1 years ago. Out of people who lived in different houses, 39.3% lived in this county. Out of people who lived in different counties, 22.1% lived in Virginia.
Mantua:
85.7%
State average:
86.6%
Education attainment for males 25 years and older:
No schooling: 0
Nursery to 4th grade: 0
5th and 6th grade: 0
7th and 8th grade: 0
9th grade: 0
10th grade: 0
11th grade: 0
12th grade, no diploma: 17
High school graduate (or equivalency): 233
Less than 1 year of college: 63
Some college more than 1 year, no degree: 50
Associate degree: 22
Bachelor's degree: 840
Master's degree: 653
Professional school degree: 426
Doctorate degree: 208
Education attainment for females 25 years and older:
No schooling: 48
Nursery to 4th grade: 36
5th and 6th grade: 0
7th and 8th grade: 20
9th grade: 0
10th grade: 0
11th grade: 0
12th grade, no diploma: 69
High school graduate (or equivalency): 111
Less than 1 year of college: 82
Some college more than 1 year, no degree: 59
Associate degree: 125
Bachelor's degree: 757
Master's degree: 871
Professional school degree: 161
Doctorate degree: 112
Housing units in structures:
One, detached: 1,797
One, attached: 259
3 or 4: 43
5 to 9: 68
10 to 19: 324
20 to 49: 70
50 or more: 245
House/condo owner moved in on average 13 years ago