Marion, MI (Michigan) Houses and Residents
| Marion: | $97,973 |
| Michigan: | $224,400 |
Mean price in 2022:
Detached houses: $116,896
Here: $116,896 State: $280,038 Mobile homes: $25,111
Here: $25,111 State: $72,868
Total population: 855 (Urban population: 0, Rural population: 806 (all nonfarm))
Houses: 329 (300 occupied: 209 owner occupied, 95 renter occupied)
| % of renters here: | 31% |
| State: | 27% |
Housing density: 243 houses/condos per square mile
Median price asked for vacant for-sale houses and condos in 2022 in this county: $125,067.
Median contract rent in 2022: $479 (lower quartile is $281, upper quartile is $609)
Median rent asked for vacant for-rent units in 2022: $589
Median gross rent in Marion, MI in 2022: $589
Housing units in Marion with a mortgage: 117 (5 second mortgage, 0 home equity loan, 5 both second mortgage and home equity loan)
Houses without a mortgage: 0
Median household income for houses/condos with a mortgage: $55,429
Median household income for apartments without a mortgage: $42,226
Median monthly housing costs: $629
Compare current foreclosures near Marion, MI:
| Photo | Address | Area | Beds / Baths | Price | Details |
|---|---|---|---|---|---|

|
#1
S Case St
Marion, MI 49665
|
- sq. feet
|
- baths - beds |
show details | |

|
#2
S Blevins St
Marion, MI 49665
|
- sq. feet
|
- baths - beds |
show details | |

|
#3
W Watergate Rd
Mc Bain, MI 49657
|
- sq. feet
|
2 baths 2 beds |
show details | |

|
#4
N Hemlock St
Evart, MI 49631
|
1,100 sq. feet
|
1 baths 3 beds |
show details | |

|
#5
Pocohontas St
Harrison, MI 48625
|
584 sq. feet
|
1 baths 2 beds |
show details | |

|
#6
N River St
Evart, MI 49631
|
1,120 sq. feet
|
1 baths 3 beds |
show details | |

|
#7
17 Mile Rd
Leroy, MI 49655
|
- sq. feet
|
- baths - beds |
show details | |

|
#8
S Pine St
Evart, MI 49631
|
- sq. feet
|
- baths - beds |
show details | |

|
#9
Cadillac Shores Dr Apt 101
Cadillac, MI 49601
|
- sq. feet
|
- baths - beds |
show details | |

|
#10
S Vandermeulen Rd
Lake City, MI 49651
|
- sq. feet
|
- baths - beds |
show details |
| Photo | Address | Area | Beds / Baths | Price | Details |
|---|---|---|---|---|---|

|
#11
Anna Cir
Cadillac, MI 49601
|
- sq. feet
|
- baths - beds |
show details | |

|
#12
W Lake George Dr
Lake George, MI 48633
|
- sq. feet
|
- baths - beds |
show details | |

|
#13
W Kelly Rd
Lake City, MI 49651
|
- sq. feet
|
- baths - beds |
show details | |

|
#14
White Pine Village Dr
Cadillac, MI 49601
|
- sq. feet
|
- baths - beds |
show details | |

|
#15
Farrar St
Cadillac, MI 49601
|
- sq. feet
|
- baths - beds |
show details | |

|
#16
Ludington Dr
Lake, MI 48632
|
- sq. feet
|
- baths - beds |
show details | |

|
#17
W Stoney Corners Rd
Mc Bain, MI 49657
|
- sq. feet
|
- baths - beds |
show details | |

|
#18
W North St
Cadillac, MI 49601
|
- sq. feet
|
- baths - beds |
show details | |

|
#19
Farrar St
Cadillac, MI 49601
|
- sq. feet
|
- baths - beds |
show details | |

|
#20
Linden St
Cadillac, MI 49601
|
- sq. feet
|
- baths - beds |
show details |
| Photo | Address | Area | Beds / Baths | Price | Details |
|---|---|---|---|---|---|

|
#21
S 41 Rd
Cadillac, MI 49601
|
- sq. feet
|
- baths - beds |
show details | |

|
#22
S Dorr Rd
Falmouth, MI 49632
|
- sq. feet
|
- baths - beds |
show details | |

|
#23
180th Ave
Tustin, MI 49688
|
- sq. feet
|
- baths - beds |
show details | |

|
#24
Timberlane Trl
Lake, MI 48632
|
- sq. feet
|
- baths - beds |
show details | |

|
#25
180th Ave
Tustin, MI 49688
|
- sq. feet
|
- baths - beds |
show details | |

|
#26
30th Ave
Sears, MI 49679
|
- sq. feet
|
- baths - beds |
show details | |

|
#27
W Kelly Rd
Lake City, MI 49651
|
- sq. feet
|
- baths - beds |
show details | |

|
#28
River Rd
Evart, MI 49631
|
- sq. feet
|
- baths - beds |
show details | |

|
#29
Mackinaw Trl
Tustin, MI 49688
|
- sq. feet
|
- baths - beds |
show details | |

|
#30
W Lotan Rd
Lake City, MI 49651
|
- sq. feet
|
- baths - beds |
show details |
| Photo | Address | Area | Beds / Baths | Price | Details |
|---|---|---|---|---|---|

|
#31
S Vandermeulen Rd
Lake City, MI 49651
|
- sq. feet
|
- baths - beds |
show details | |

|
#32
18 Mile Rd
Leroy, MI 49655
|
- sq. feet
|
- baths - beds |
show details | |

|
#33
N Harding Ave
Harrison, MI 48625
|
- sq. feet
|
- baths - beds |
show details | |

|
#34
N Cottage Grv
Mc Bain, MI 49657
|
- sq. feet
|
- baths - beds |
show details | |

|
#35
200th Ave
Tustin, MI 49688
|
- sq. feet
|
- baths - beds |
show details | |

|
Check over 1 million property listings on Foreclosure.com!
|
browse all offers | |||

Latest news about housing in Marion, MI collected exclusively by city-data.com from local newspapers, TV, and radio stations

 | Detroit old City and Superstars Homes (actually works now) (18 replies) |
| Detroit in Pictures Old City and Former superstars homes (9 replies) |
| Has SE Michigan always been so ... grungy? (74 replies) |
| Don't 2 universities contribute to MI's blockbuster status in higher education? (22 replies) |
| Marion Michigan (24 replies) |
| Thinking of Moving to Flint, am I crazy? (51 replies) |

Median year apartment built: 1972
Household type by relationship:
Households: 651- Male householders: 148 (86 living alone), Female householders: 149 (37 living alone)
72 spouses (71 opposite-sex spouses), 44 unmarried partners, (44 opposite-sex unmarried partners), 167 children (159 natural, 1 adopted, 5 stepchildren), 3 grandchildren, 8 brothers or sisters, 10 parents, 0 foster children, 24 other relatives, 18 non-relatives
Size of family households: 80 2-persons, 35 3-persons, 21 4-persons, 9 5-persons, 2 6-persons, 2 7-or-more-persons.
Size of nonfamily households: 129 1-person, 24 2-persons, 1 3-persons.
30 married couples with children.
77 single-parent households (19 men, 58 women).
99.8% of residents of Marion speak English at home.
| Here: | 5.8 |
| State: | 6.5 |
| Here: | 3.6 |
| State: | 4.3 |

- Bedrooms in owner-occupied houses and condos in Marion, Michigan
- 0no bedroom
- 81 bedroom
- 492 bedrooms
- 1143 bedrooms
- 224 bedrooms
- 155+ bedrooms

- Bedrooms in renter-occupied apartments in Marion, Michigan
- 1no bedroom
- 151 bedroom
- 602 bedrooms
- 163 bedrooms
- 34 bedrooms
- 05+ bedrooms

- Cars and other vehicles available in Marion in owner-occupied houses/condos
- 1no vehicle
- 971 vehicle
- 832 vehicles
- 273 vehicles
- 24 vehicles
- 05+ vehicles

- Cars and other vehicles available in Marion in renter-occupied apartments
- 41no vehicle
- 371 vehicle
- 142 vehicles
- 43 vehicles
- 04 vehicles
- 05+ vehicles

- Rooms in owner-occupied houses in Marion, Michigan
- 01 room
- 02 rooms
- 23 rooms
- 204 rooms
- 575 rooms
- 726 rooms
- 177 rooms
- 168 rooms
- 239+ rooms

- Rooms in renter-occupied apartments in Marion, Michigan
- 11 room
- 02 rooms
- 443 rooms
- 144 rooms
- 35 rooms
- 66 rooms
- 127 rooms
- 88 rooms
- 79+ rooms


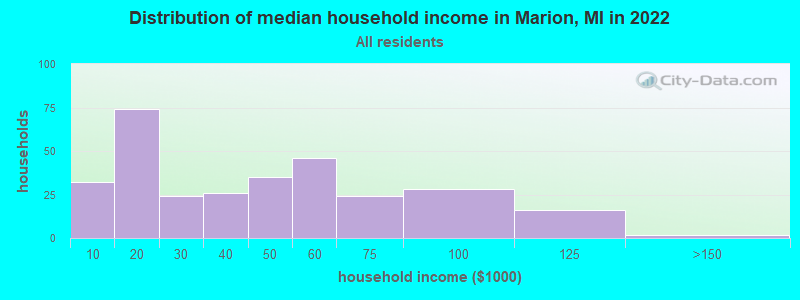
Marion, MI household income distribution

- 32Less than $10,000
- 74$10,000 to $19,999
- 24$20,000 to $29,999
- 26$30,000 to $39,999
- 35$40,000 to $49,999
- 46$50,000 to $59,999
- 24$60,000 to $74,999
- 28$75,000 to $99,999
- 16$100,000 to $124,999
- 2$125,000 to $149,999
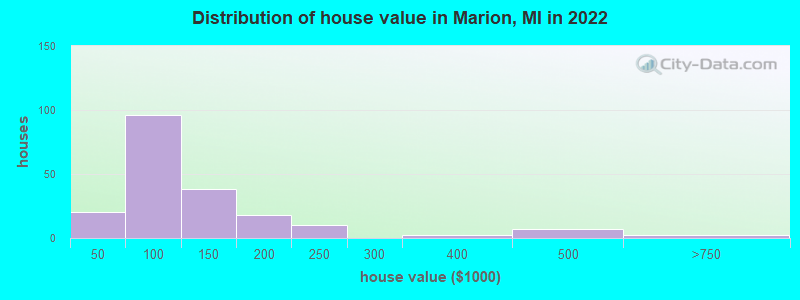
Home value of owner - occupied houses in 2022 in Marion, MI
-
- 5$20,000 to $24,999
- 3$25,000 to $29,999
- 4$35,000 to $39,999
- 6$40,000 to $49,999
- 16$50,000 to $59,999
- 10$60,000 to $69,999
- 34$70,000 to $79,999
- 16$80,000 to $89,999
- 12$90,000 to $99,999
- 29$100,000 to $124,999
- 8$125,000 to $149,999
- 12$150,000 to $174,999
- 5$175,000 to $199,999
- 9$200,000 to $249,999
- 2$300,000 to $399,999
- 7$400,000 to $499,999
- 2$500,000 to $749,999
Rent paid by renters in 2022 in Marion, MI
-
- 2Less than $100
- 2$100 to $149
- 6$200 to $249
- 13$250 to $299
- 6$350 to $399
- 4$400 to $449
- 6$450 to $499
- 16$550 to $599
- 4$600 to $649
- 3$650 to $699
- 1$700 to $749
- 0$750 to $799
- 5$800 to $899
- 9No cash rent


Percentage of workers working in this county: 44.9%
Number of people working at home: 4 (2.0% of all workers)
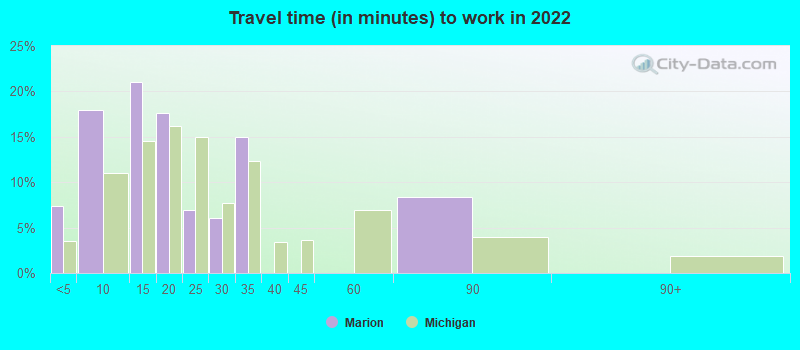
Travel time to work (commute)
- Less than 5 minutes: 29
- 5 to 9 minutes: 20
- 10 to 14 minutes: 7
- 15 to 19 minutes: 1
- 20 to 24 minutes: 11
- 25 to 29 minutes: 26
- 30 to 34 minutes: 78
- 35 to 39 minutes: 0
- 40 to 44 minutes: 3
- 45 to 59 minutes: 1
- 60 to 89 minutes: 0
- 90 or more minutes: 9
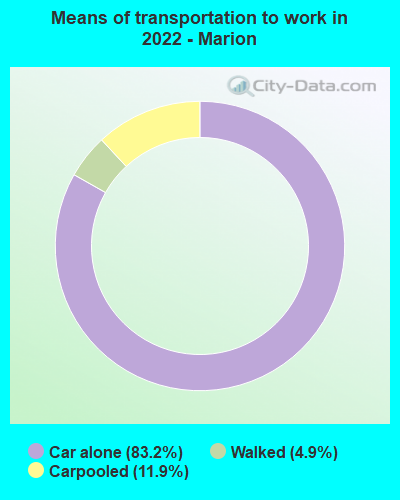
Means of transportation to work:
- Drove a car alone: 232 (79.2%)
- Carpooled: 33 (11.3%)
- Walked: 13 (4.4%)
- Worked at home: 4 (1.4%)

- Unemployment by race in 2022
- Unemployment rate for White non-Hispanic residents
- 10.3%Males
- 13.2%Females

- Year of entry for the foreign-born population in Marion, Michigan
- 51995 to March 2000
- 01990 to 1994
- 01985 to 1989
- 01980 to 1984
- 01975 to 1979
- 21970 to 1974
- 01965 to 1969
- 0Before 1965

First ancestries reported:
- American: 50 (22.6%)
- English: 47 (21.2%)
- German: 19 (8.6%)
- Norwegian: 16 (7.2%)
- Dutch: 7 (3.2%)
- Irish: 7 (3.2%)
- Scottish: 7 (3.2%)
- Polish: 6 (2.7%)
- Swedish: 5 (2.3%)
- Finnish: 3 (1.4%)
- French Canadian: 2 (0.9%)
- European: 1 (0.5%)
- Welsh: 1 (0.5%)
Most common places of birth for foreign-born residents (%):
| Marion: | 42.9% (3) |
| Michigan: | 0.3% (1,476) |
| Marion: | 28.6% (2) |
| Michigan: | 4.4% (22,814) |
| Marion: | 28.6% (2) |
| Michigan: | 1.6% (8,579) |
Place of birth for U.S.-born residents:
- This state: 578
- Other state: 72
- Northeast: 7
- Midwest: 21
- South: 9
- West: 35
88.4% of Marion residents lived in the same house 1 years ago.
Out of people who lived in different houses, 21.5% lived in this county.
Out of people who lived in different counties, 84.3% lived in Michigan.
| Marion: | 88.4% |
| State average: | 88.4% |
Education attainment for males 25 years and older:
- No schooling: 2
- Nursery to 4th grade: 0
- 5th and 6th grade: 0
- 7th and 8th grade: 0
- 9th grade: 2
- 10th grade: 13
- 11th grade: 1
- 12th grade, no diploma: 6
- High school graduate (or equivalency): 109
- Less than 1 year of college: 18
- Some college more than 1 year, no degree: 56
- Associate degree: 9
- Bachelor's degree: 23
- Master's degree: 7
- Professional school degree: 0
- Doctorate degree: 0

Education attainment for females 25 years and older:
- No schooling: 0
- Nursery to 4th grade: 0
- 5th and 6th grade: 0
- 7th and 8th grade: 0
- 9th grade: 1
- 10th grade: 1
- 11th grade: 3
- 12th grade, no diploma: 4
- High school graduate (or equivalency): 122
- Less than 1 year of college: 14
- Some college more than 1 year, no degree: 37
- Associate degree: 13
- Bachelor's degree: 6
- Master's degree: 3
- Professional school degree: 0
- Doctorate degree: 0


Housing units in structures:
- One, detached: 260
- One, attached: 2
- Two: 6
- 3 or 4: 8
- 5 to 9: 6
- 10 to 19: 5
- 20 to 49: 16
- Mobile homes: 26
Housing units lacking complete kitchen facilities in 2022: 2.4%
House/condo owner moved in on average 15 years ago
Renter moved in on average 7 years ago

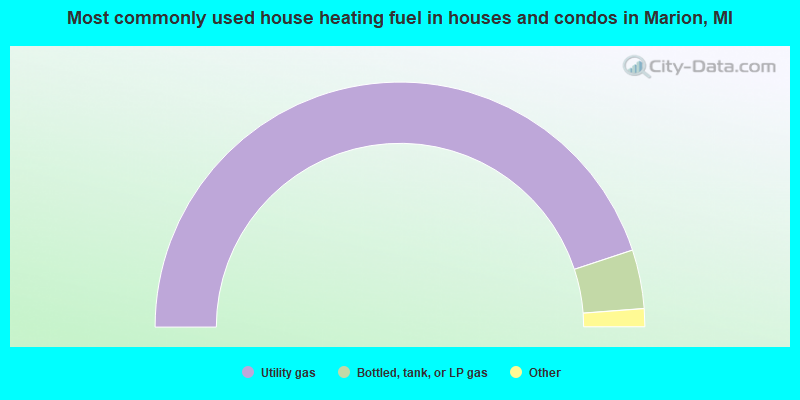
- 90.2%Utility gas
- 7.8%Bottled, tank, or LP gas
- 1.0%Electricity
- 1.0%Wood
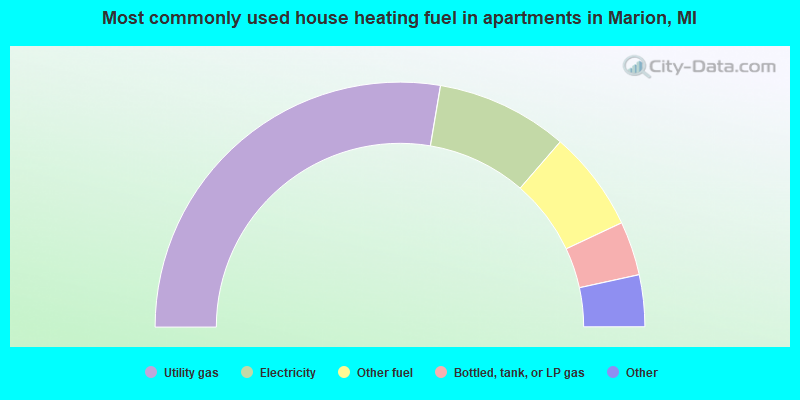
- 57.4%Utility gas
- 18.1%Electricity
- 13.8%Other fuel
- 7.4%Bottled, tank, or LP gas
- 2.1%No fuel used
- 1.1%Fuel oil, kerosene, etc.
Private vs. public school enrollment:
| Here: | 0.0% |
| Michigan: | 12.4% |
| Here: | 0.0% |
| Michigan: | 9.8% |


