Marrowstone, WA (Washington) Houses and Residents
| Marrowstone: | $559,275 |
| Washington: | $569,500 |
Mean price in 2022:
Detached houses: $1,188,879
Here: $1,188,879 State: $734,307 Mobile homes: $240,842
Here: $240,842 State: $218,362
Total population: 844 (Urban population: 0, Rural population: 876 (all nonfarm))
Houses: 651 (457 occupied: 343 owner occupied, 115 renter occupied)
| % of renters here: | 25% |
| State: | 36% |
Housing density: 103 houses/condos per square mile
Median price asked for vacant for-sale houses and condos in 2022: $1,556,713.
Median contract rent in 2022: $1,281 (lower quartile is $1,152, upper quartile is $1,712)
Median gross rent in Marrowstone, WA in 2022: $1,465
Housing units in Marrowstone with a mortgage: 66 (7 second mortgage, 0 home equity loan, 8 both second mortgage and home equity loan)
Houses without a mortgage: 0
Median monthly housing costs: $925
Compare current foreclosures near Marrowstone, WA:
| Photo | Address | Area | Beds / Baths | Price | Details |
|---|---|---|---|---|---|

|
#1
Cape George Rd
Port Townsend, WA 98368
|
1,080 sq. feet
|
2 baths 3 beds |
show details | |

|
#2
NE 3rd Ave
Oak Harbor, WA 98277
|
1,138 sq. feet
|
1 baths 3 beds |
show details | |

|
#3
Autumn Ln
Clinton, WA 98236
|
1,940 sq. feet
|
3 baths 2 beds |
show details | |

|
#4
Donald Ave
Oak Harbor, WA 98277
|
1,006 sq. feet
|
1 baths 1 beds |
show details | |

|
#5
Herring Street And 4361 Douglas Street
Langley, WA 98260
|
1,191 sq. feet
|
1 baths 2 beds |
show details | |

|
#6
Lola Ln
Langley, WA 98260
|
1,311 sq. feet
|
2 baths 2 beds |
show details | |

|
#7
S Camano Dr
Camano Island, WA 98282
|
1,772 sq. feet
|
1 baths 2 beds |
show details | |

|
#8
Flagler Rd
Nordland, WA 98358
|
864 sq. feet
|
1 baths 1 beds |
show details | |

|
#9
Parker Rd
Coupeville, WA 98239
|
964 sq. feet
|
2 baths 3 beds |
show details | |

|
#10
Buck Rd NE
Hansville, WA 98340
|
1,342 sq. feet
|
2 baths 3 beds |
show details |
| Photo | Address | Area | Beds / Baths | Price | Details |
|---|---|---|---|---|---|

|
#11
Thompson Dr
Camano Island, WA 98282
|
1,475 sq. feet
|
3 baths 3 beds |
show details | |

|
#12
Seaside Dr
Coupeville, WA 98239
|
1,983 sq. feet
|
3 baths 4 beds |
show details | |

|
#13
Dogwood Ln
Camano Island, WA 98282
|
2,652 sq. feet
|
3 baths 4 beds |
show details | |

|
#14
Sierra Park Ln
Camano Island, WA 98282
|
1,238 sq. feet
|
2 baths 3 beds |
show details | |

|
#15
Summit St
Camano Island, WA 98282
|
1,439 sq. feet
|
2 baths 2 beds |
show details | |

|
#16
Hodges Ave
Langley, WA 98260
|
1,056 sq. feet
|
2 baths 3 beds |
show details | |

|
#17
S Sapphire Dr
Camano Island, WA 98282
|
1,476 sq. feet
|
2 baths 2 beds |
show details | |

|
#18
SW Talon Loop
Oak Harbor, WA 98277
|
1,809 sq. feet
|
2 baths 3 beds |
show details | |

|
#19
Guemes Ave
Clinton, WA 98236
|
876 sq. feet
|
1 baths 2 beds |
show details | |

|
#20
SW Xavier Dr
Oak Harbor, WA 98277
|
2,170 sq. feet
|
2 baths 3 beds |
show details |
| Photo | Address | Area | Beds / Baths | Price | Details |
|---|---|---|---|---|---|

|
#21
Colonial Way
Oak Harbor, WA 98277
|
1,424 sq. feet
|
2 baths 3 beds |
show details | |

|
#22
Links Way
Oak Harbor, WA 98277
|
2,766 sq. feet
|
2 baths 3 beds |
show details | |

|
#23
SW Periwinkle Ln
Oak Harbor, WA 98277
|
1,980 sq. feet
|
2 baths 4 beds |
show details | |

|
#24
Columbia Beach Dr
Clinton, WA 98236
|
3,156 sq. feet
|
3 baths 3 beds |
show details | |

|
#25
Admiralty Way
Camano Island, WA 98282
|
2,127 sq. feet
|
3 baths 3 beds |
show details | |

|
#26
Dolphin St
Camano Island, WA 98282
|
1,432 sq. feet
|
2 baths 2 beds |
show details | |

|
#27
Thompson Rd
Langley, WA 98260
|
2,208 sq. feet
|
1 baths 1 beds |
show details | |

|
#28
Seaview Ave
Coupeville, WA 98239
|
1,746 sq. feet
|
2 baths 3 beds |
show details | |

|
#29
Frayne St
Port Hadlock, WA 98339
|
1,404 sq. feet
|
2 baths 3 beds |
show details | |

|
#30
Rainier Ln
Port Ludlow, WA 98365
|
1,470 sq. feet
|
2 baths 3 beds |
show details |
| Photo | Address | Area | Beds / Baths | Price | Details |
|---|---|---|---|---|---|

|
#31
Haines St
Port Townsend, WA 98368
|
1,336 sq. feet
|
2 baths 3 beds |
show details | |

|
#32
Mountain View Ln
Freeland, WA 98249
|
1,414 sq. feet
|
2 baths 3 beds |
show details | |

|
#33
SE 2nd Ct
Oak Harbor, WA 98277
|
1,670 sq. feet
|
2 baths - beds |
show details | |

|
#34
Classic Rd
Greenbank, WA 98253
|
- sq. feet
|
2 baths 3 beds |
show details | |

|
#35
Bower Ln # A
Camano Island, WA 98282
|
1,056 sq. feet
|
2 baths - beds |
show details | |

|
#36
SW Beeksma Dr
Oak Harbor, WA 98277
|
2,144 sq. feet
|
3 baths - beds |
show details | |

|
#37
Marine Dr
Marysville, WA 98271
|
720 sq. feet
|
- baths 1 beds |
show details | |

|
#38
El Toro St
Coupeville, WA 98239
|
- sq. feet
|
- baths - beds |
show details | |

|
#39
Leahy Dr
Coupeville, WA 98239
|
- sq. feet
|
- baths - beds |
show details | |

|
#40
Gylany Way
Greenbank, WA 98253
|
- sq. feet
|
- baths - beds |
show details |
| Photo | Address | Area | Beds / Baths | Price | Details |
|---|---|---|---|---|---|

|
#41
Noble Ln
Port Hadlock, WA 98339
|
1,080 sq. feet
|
- baths - beds |
show details | |

|
#42
NE Ernst St Spc 78
Oak Harbor, WA 98277
|
- sq. feet
|
- baths - beds |
show details | |

|
#43
Columbia Beach Dr
Clinton, WA 98236
|
- sq. feet
|
- baths - beds |
show details | |

|
#44
Vine Maple Ln
Camano Island, WA 98282
|
1,782 sq. feet
|
- baths - beds |
show details | |

|
#45
Shady Glen Ln
Greenbank, WA 98253
|
- sq. feet
|
- baths - beds |
show details | |

|
#46
Heggenes Rd
Clinton, WA 98236
|
- sq. feet
|
- baths - beds |
show details | |

|
#47
Goldfinch St Apt C
Oak Harbor, WA 98277
|
- sq. feet
|
- baths - beds |
show details | |

|
#48
SE 8th Ave Apt A101
Oak Harbor, WA 98277
|
- sq. feet
|
- baths - beds |
show details | |

|
#49
SW Harrier Cir Apt 2
Oak Harbor, WA 98277
|
- sq. feet
|
- baths - beds |
show details | |

|
Check over 1 million property listings on Foreclosure.com!
|
browse all offers | |||

Latest news about housing in Marrowstone, WA collected exclusively by city-data.com from local newspapers, TV, and radio stations

 | Moving to Bremerton (42 replies) |
| Fort Worden in Port Townsend - Future Pub, Dinner Theater, Culinary School (67 replies) |
| Are they rural liberal areas in Washington? (120 replies) |
| Port Townsend, Sequim & Port Angeles weather comparison (134 replies) |
| Navy guy moving to Bremerton (briefly) (6 replies) |
| Friday Harbor vs Chelan (4 replies) |

Median year apartment built: 1980
Household type by relationship:
Households: 893- Male householders: 236 (56 living alone), Female householders: 212 (76 living alone)
310 spouses (296 opposite-sex spouses), 16 unmarried partners, (16 opposite-sex unmarried partners), 88 children (88 natural, 0 adopted, 0 stepchildren), 0 grandchildren, 0 brothers or sisters, 0 parents, 0 foster children, 0 other relatives, 28 non-relatives
Size of family households: 262 2-persons, 8 3-persons, 21 4-persons, 10 5-persons.
Size of nonfamily households: 141 1-person, 17 2-persons.
54 married couples with children.
10 single-parent households (0 men, 10 women).
98.3% of residents of Marrowstone speak English at home.
0.8% of residents speak Spanish at home (100% speak English very well).
1.2% of residents speak other Indo-European language at home (100% speak English very well).
Foreign born population: 50 (5.6%)
(78.0% of them are naturalized citizens)
| Here: | 5.4 |
| State: | 6.5 |
| Here: | 2.9 |
| State: | 3.9 |

- Bedrooms in owner-occupied houses and condos in Marrowstone, Washington
- 37no bedroom
- 511 bedroom
- 1392 bedrooms
- 923 bedrooms
- 04 bedrooms
- 255+ bedrooms

- Bedrooms in renter-occupied apartments in Marrowstone, Washington
- 59no bedroom
- 201 bedroom
- 182 bedrooms
- 83 bedrooms
- 114 bedrooms
- 05+ bedrooms

- Cars and other vehicles available in Marrowstone in owner-occupied houses/condos
- 0no vehicle
- 701 vehicle
- 1562 vehicles
- 813 vehicles
- 364 vehicles
- 05+ vehicles

- Cars and other vehicles available in Marrowstone in renter-occupied apartments
- 0no vehicle
- 531 vehicle
- 522 vehicles
- 73 vehicles
- 04 vehicles
- 45+ vehicles

- Rooms in owner-occupied houses in Marrowstone, Washington
- 371 room
- 252 rooms
- 93 rooms
- 294 rooms
- 825 rooms
- 826 rooms
- 437 rooms
- 38 rooms
- 339+ rooms

- Rooms in renter-occupied apartments in Marrowstone, Washington
- 01 room
- 402 rooms
- 383 rooms
- 84 rooms
- 05 rooms
- 126 rooms
- 97 rooms
- 78 rooms
- 09+ rooms


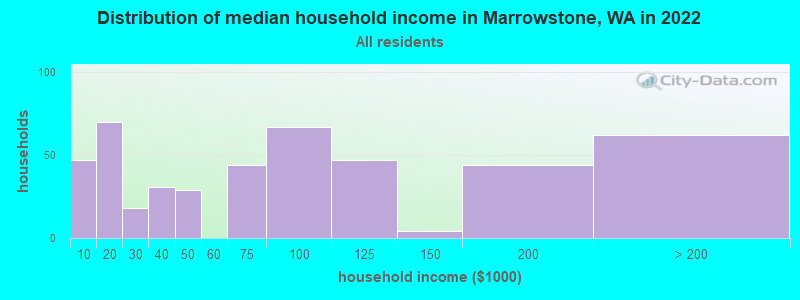
Marrowstone, WA household income distribution

- 47Less than $10,000
- 70$10,000 to $19,999
- 18$20,000 to $29,999
- 31$30,000 to $39,999
- 29$40,000 to $49,999
- 44$60,000 to $74,999
- 67$75,000 to $99,999
- 47$100,000 to $124,999
- 4$125,000 to $149,999
- 44$150,000 to $199,999
- 62$200,000 or more
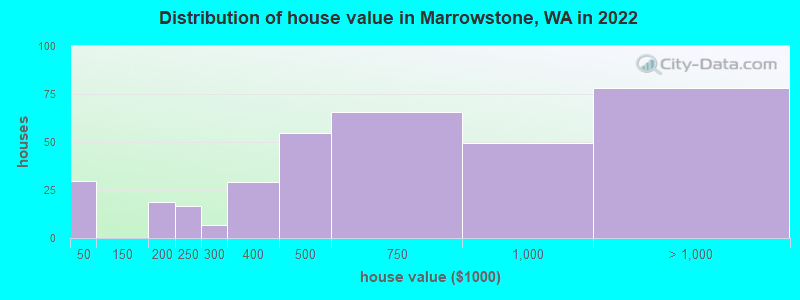
Home value of owner - occupied houses in 2022 in Marrowstone, WA
-
- 24Less than $10,000
- 4$20,000 to $24,999
- 18$150,000 to $174,999
- 16$200,000 to $249,999
- 7$250,000 to $299,999
- 29$300,000 to $399,999
- 54$400,000 to $499,999
- 65$500,000 to $749,999
- 49$750,000 to $999,999
- 53$1,000,000 to $1,499,999
- 14$1,500,000 to $1,999,999
- 10$2,000,000 or more
Rent paid by renters in 2022 in Marrowstone, WA
-
- 7$150 to $199
- 36$1,000 to $1,249
- 8$1,250 to $1,499
- 31$1,500 to $1,999
- 3$2,000 to $2,499
- 26No cash rent


Percentage of workers working in this county: 91.8%
Number of people working at home: 199 (56.4% of all workers)
Travel time to work (commute)
- Less than 5 minutes: 0
- 5 to 9 minutes: 0
- 10 to 14 minutes: 17
- 15 to 19 minutes: 30
- 20 to 24 minutes: 26
- 25 to 29 minutes: 0
- 30 to 34 minutes: 64
- 35 to 39 minutes: 16
- 40 to 44 minutes: 4
- 45 to 59 minutes: 19
- 60 to 89 minutes: 0
- 90 or more minutes: 7
Means of transportation to work:
- Drove a car alone: 229 (76.6%)
- Carpooled: 44 (14.7%)
- Walked: 13 (4.3%)
- Worked at home: 13 (4.3%)

- Unemployment by race in 2022
- Unemployment rate for White non-Hispanic residents
- 5.2%Males

- Year of entry for the foreign-born population in Marrowstone, Washington
- 02010 or later
- 02000 to 2009
- 01990 to 1999
- 01980 to 1989
- 01970 to 1979
- 7Before 1970

First ancestries reported:
- German: 59 (25.3%)
- European: 43 (18.4%)
- English: 31 (13.3%)
- Dutch: 21 (9.0%)
- American: 17 (7.3%)
- Scandinavian: 16 (6.9%)
- British: 12 (5.1%)
- Italian: 6 (2.6%)
- Northern European: 6 (2.6%)
- Danish: 4 (1.7%)
Most common places of birth for foreign-born residents (%):
| Marrowstone: | 50.0% (25) |
| Washington: | 1.6% (17,761) |
| Marrowstone: | 30.0% (15) |
| Washington: | 0.3% (3,995) |
| Marrowstone: | 22.0% (11) |
| Washington: | 4.1% (47,238) |
Place of birth for U.S.-born residents:
- This state: 192
- Other state: 645
- Northeast: 116
- Midwest: 80
- South: 87
- West: 364
77.2% of Marrowstone residents lived in the same house 1 years ago.
Out of people who lived in different houses, 0.0% lived in this county.
Out of people who lived in different counties, 76.2% lived in Washington.
| Marrowstone: | 77.2% |
| State average: | 85.2% |
Education attainment for males 25 years and older:
- No schooling: 0
- Nursery to 4th grade: 0
- 5th and 6th grade: 0
- 7th and 8th grade: 0
- 9th grade: 0
- 10th grade: 0
- 11th grade: 11
- 12th grade, no diploma: 28
- High school graduate (or equivalency): 63
- Less than 1 year of college: 0
- Some college more than 1 year, no degree: 89
- Associate degree: 7
- Bachelor's degree: 137
- Master's degree: 67
- Professional school degree: 11
- Doctorate degree: 2

Education attainment for females 25 years and older:
- No schooling: 9
- Nursery to 4th grade: 0
- 5th and 6th grade: 0
- 7th and 8th grade: 0
- 9th grade: 0
- 10th grade: 0
- 11th grade: 0
- 12th grade, no diploma: 37
- High school graduate (or equivalency): 53
- Less than 1 year of college: 65
- Some college more than 1 year, no degree: 36
- Associate degree: 0
- Bachelor's degree: 106
- Master's degree: 49
- Professional school degree: 13
- Doctorate degree: 33


Housing units in structures:
- One, detached: 513
- One, attached: 12
- Two: 20
- Mobile homes: 76
- Boats, RVs, vans, etc.: 28
Median worth of mobile homes: $196,381
Housing units lacking complete kitchen facilities in 2022: 13.8%
House/condo owner moved in on average 10 years ago
Renter moved in on average 3 years ago

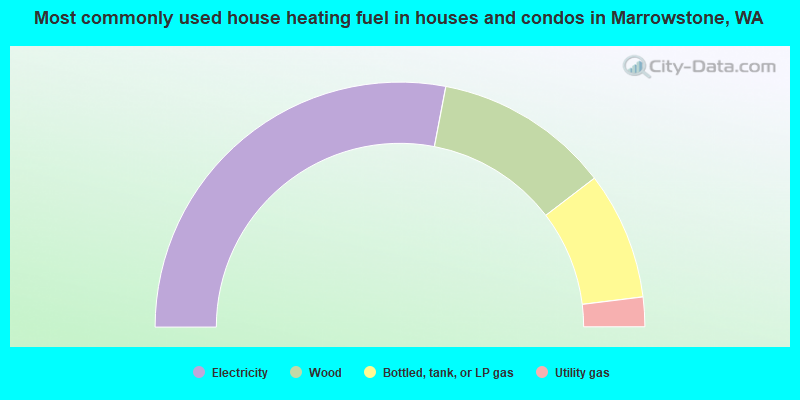
- 56.0%Electricity
- 23.2%Wood
- 16.9%Bottled, tank, or LP gas
- 3.9%Utility gas
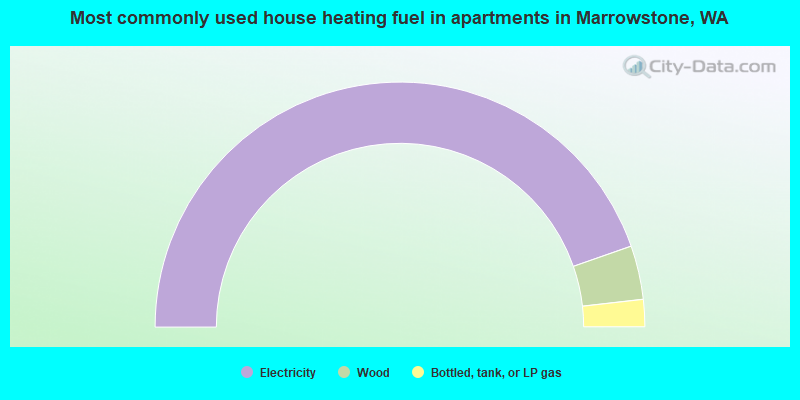
- 89.3%Electricity
- 7.1%Wood
- 3.6%Bottled, tank, or LP gas
Private vs. public school enrollment:
| Here: | 0.0% |
| Washington: | 12.4% |
| Here: | 0.0% |
| Washington: | 9.2% |
| Here: | 50.0% |
| Washington: | 16.5% |


