Marysville, OH (Ohio) Houses and Residents
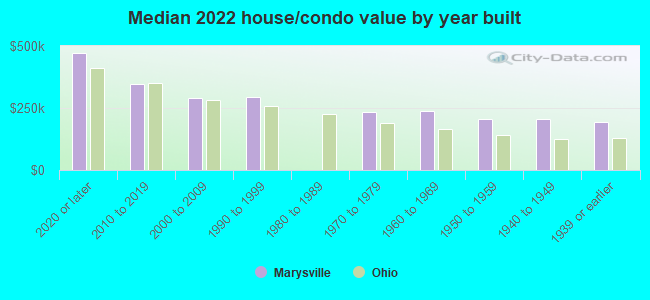
| Marysville: | $298,838 |
| Ohio: | $204,100 |
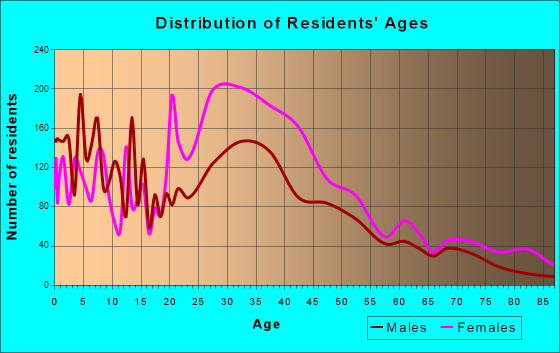
Total population: 22,708 (Urban population: 14,467 (all inside urban clusters), Rural population: 1,263 (4 farm, 1,259 nonfarm))
Houses: 10,411 (10,160 occupied: 7,373 owner occupied, 2,993 renter occupied)
| % of renters here: | 29% |
| State: | 33% |
Housing density: 671 houses/condos per square mile
Median price asked for vacant for-sale houses and condos in 2022 in this county: $60,948.
Median contract rent in 2022: $886 (lower quartile is $661, upper quartile is $1,088)
Median rent asked for vacant for-rent units in 2022: $3,004
Median gross rent in Marysville, OH in 2022: $1,049
Housing units in Marysville with a mortgage: 5,244 (300 second mortgage, 67 home equity loan, 165 both second mortgage and home equity loan)
Houses without a mortgage: 140
Median household income for houses/condos with a mortgage: $118,007
Median household income for apartments without a mortgage: $70,916
Median monthly housing costs: $1,289
Compare current foreclosures in Marysville, OH:
| Photo | Address | Area | Beds / Baths | Price | Details |
|---|---|---|---|---|---|

|
#1
Rainbow Dr
Marysville, OH 43040
|
1,140 sq. feet
|
1 baths 3 beds |
show details | |

|
#2
Taylor Rd
Marysville, OH 43040
|
1,612 sq. feet
|
1 baths 3 beds |
show details | |

|
#3
Smokey Rd
Marysville, OH 43040
|
2,506 sq. feet
|
1 baths 4 beds |
show details | |

|
#4
Saffron Dr
Marysville, OH 43040
|
1,569 sq. feet
|
1 baths 4 beds |
show details | |

|
#5
Rebecca Dr
Marysville, OH 43040
|
1,592 sq. feet
|
1 baths 4 beds |
show details | |

|
#6
Valley Dr
Marysville, OH 43040
|
1,556 sq. feet
|
2 baths 4 beds |
show details | |

|
#7
Mulberry St
Marysville, OH 43040
|
1,364 sq. feet
|
1 baths 3 beds |
show details | |

|
#8
Creekview Dr
Marysville, OH 43040
|
1,428 sq. feet
|
1 baths 3 beds |
show details | |

|
#9
W 3rd St
Marysville, OH 43040
|
1,080 sq. feet
|
1 baths 2 beds |
show details | |

|
#10
E 6th St
Marysville, OH 43040
|
1,678 sq. feet
|
1 baths 3 beds |
show details |
| Photo | Address | Area | Beds / Baths | Price | Details |
|---|---|---|---|---|---|

|
#11
Poppy Ln
Marysville, OH 43040
|
1,200 sq. feet
|
1 baths 3 beds |
show details | |

|
#12
Hinton Mill Rd
Marysville, OH 43040
|
2,368 sq. feet
|
1 baths 4 beds |
show details | |

|
#13
Monteclair Ct
Marysville, OH 43040
|
1,605 sq. feet
|
1 baths 3 beds |
show details | |

|
#14
Valley Dr
Marysville, OH 43040
|
1,584 sq. feet
|
1 baths 4 beds |
show details | |

|
#15
Watkins Rd
Marysville, OH 43040
|
1,248 sq. feet
|
1 baths 4 beds |
show details | |

|
#16
Taylor Ave
Marysville, OH 43040
|
1,351 sq. feet
|
1 baths 3 beds |
show details | |

|
#17
Pleasant Ridge Dr
Marysville, OH 43040
|
984 sq. feet
|
1 baths 3 beds |
show details | |

|
#18
Morningstar Dr
Marysville, OH 43040
|
1,614 sq. feet
|
1 baths 3 beds |
show details | |

|
#19
Navin Rd
Marysville, OH 43040
|
1,680 sq. feet
|
2 baths 3 beds |
show details | |

|
#20
Tarragon Dr
Marysville, OH 43040
|
1,230 sq. feet
|
1 baths 3 beds |
show details |
| Photo | Address | Area | Beds / Baths | Price | Details |
|---|---|---|---|---|---|

|
#21
State Route 38
Marysville, OH 43040
|
2,642 sq. feet
|
1 baths 5 beds |
show details | |

|
#22
Lora Lee Dr
Marysville, OH 43040
|
2,016 sq. feet
|
1 baths 3 beds |
show details | |

|
#23
London Ave
Marysville, OH 43040
|
1,648 sq. feet
|
1 baths 3 beds |
show details | |

|
#24
Mill Rd
Marysville, OH 43040
|
1,524 sq. feet
|
1 baths 3 beds |
show details | |

|
#25
N Maple St
Marysville, OH 43040
|
2,176 sq. feet
|
1 baths 4 beds |
show details | |

|
#26
Payne Rd
Marysville, OH 43040
|
1,913 sq. feet
|
1 baths 3 beds |
show details | |

|
#27
Adena Pointe Dr
Marysville, OH 43040
|
- sq. feet
|
- baths - beds |
show details | |

|
#28
1 H Spiegler Court
Marysville, OH 43040
|
- sq. feet
|
- baths - beds |
show details | |

|
#29
Pellman Loop
Marysville, OH 43040
|
- sq. feet
|
- baths - beds |
show details | |

|
#30
Stolte Dr
Marysville, OH 43040
|
- sq. feet
|
- baths - beds |
show details |
| Photo | Address | Area | Beds / Baths | Price | Details |
|---|---|---|---|---|---|

|
#31
Riverwind Dr
Marysville, OH 43040
|
- sq. feet
|
- baths - beds |
show details | |

|
#32
W 6th St
Marysville, OH 43040
|
- sq. feet
|
- baths - beds |
show details | |

|
#33
N Court St
Marysville, OH 43040
|
- sq. feet
|
- baths - beds |
show details | |

|
#34
Jasmine Dr # B
Marysville, OH 43040
|
- sq. feet
|
- baths - beds |
show details | |

|
#35
Windmill Dr
Marysville, OH 43040
|
- sq. feet
|
- baths - beds |
show details | |

|
#36
Watermill Pl
Marysville, OH 43040
|
- sq. feet
|
- baths - beds |
show details | |

|
#37
Lakeview Dr
Marysville, OH 43040
|
- sq. feet
|
- baths - beds |
show details | |

|
#38
Northcrest Dr
Marysville, OH 43040
|
- sq. feet
|
- baths - beds |
show details | |

|
#39
Spiegel Ct, Apt 1b
Marysville, OH 43040
|
- sq. feet
|
- baths - beds |
show details | |

|
#40
Woodcrest Dr
Marysville, OH 43040
|
- sq. feet
|
- baths - beds |
show details |
| Photo | Address | Area | Beds / Baths | Price | Details |
|---|---|---|---|---|---|

|
#41
Millcrest Dr
Marysville, OH 43040
|
- sq. feet
|
- baths - beds |
show details | |

|
#42
Collins Ave
Marysville, OH 43040
|
- sq. feet
|
- baths - beds |
show details | |

|
#43
Gallop Ln
Marysville, OH 43040
|
- sq. feet
|
- baths - beds |
show details | |

|
#44
Kenmore Xing, Unit 106
Marysville, OH 43040
|
- sq. feet
|
- baths - beds |
show details | |

|
#45
W 5th St Apt A
Marysville, OH 43040
|
- sq. feet
|
- baths - beds |
show details | |

|
#46
Watermill Pl
Marysville, OH 43040
|
- sq. feet
|
- baths - beds |
show details | |

|
#47
Coleridge Blvd
Marysville, OH 43040
|
- sq. feet
|
- baths - beds |
show details | |

|
#48
N Maple St
Marysville, OH 43040
|
- sq. feet
|
- baths - beds |
show details | |

|
#49
Dickson Dr
Marysville, OH 43040
|
- sq. feet
|
- baths - beds |
show details | |

|
Check over 1 million property listings on Foreclosure.com!
|
browse all offers | |||

Latest news about housing in Marysville, OH collected exclusively by city-data.com from local newspapers, TV, and radio stations

 | Columbus suburbs with houses not so close to each other (7 replies) |
| Where should I buy a house/condo around here? (84 replies) |
| Blendon Woods/Gahanna/Blacklick area condos? (2 replies) |
| Condos in Columbus on N. High Street, near OSU.. why so expensive? (6 replies) |
| Farm house (3 replies) |
| Where do affordable houses move fastest? (8 replies) |
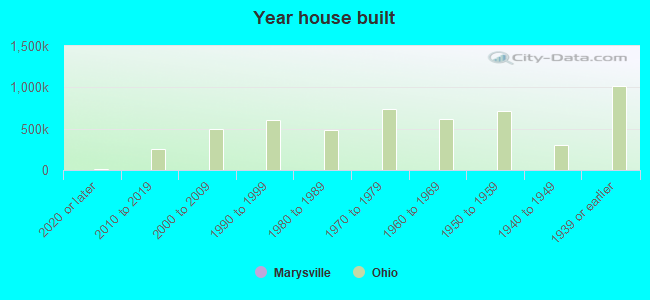
Median year apartment built: 1992
Household type by relationship:
Households: 27,225- Male householders: 5,172 (1,495 living alone), Female householders: 4,739 (1,149 living alone)
5,207 spouses (5,184 opposite-sex spouses), 1,065 unmarried partners, (993 opposite-sex unmarried partners), 6,806 children (6,066 natural, 157 adopted, 583 stepchildren), 260 grandchildren, 108 brothers or sisters, 253 parents, 16 foster children, 171 other relatives, 578 non-relatives
- In group quarters: 2,844
Size of family households: 3,076 2-persons, 1,562 3-persons, 1,643 4-persons, 386 5-persons, 182 6-persons, 71 7-or-more-persons.
Size of nonfamily households: 2,559 1-person, 815 2-persons, 39 3-persons, 25 4-persons.
3,466 married couples with children.
1,250 single-parent households (609 men, 641 women).
93.6% of residents of Marysville speak English at home.
1.7% of residents speak Spanish at home (60% speak English very well, 24% speak English well, 15% speak English not well).
1.6% of residents speak other Indo-European language at home (88% speak English very well, 12% speak English well).
1.3% of residents speak Asian or Pacific Island language at home (82% speak English very well, 16% speak English well, 2% don't speak English at all).
1.2% of residents speak other language at home (74% speak English very well, 24% speak English well, 1% speak English not well).
Foreign born population: 1,208 (4.4%)
(45.1% of them are naturalized citizens)
| Here: | 7.0 |
| State: | 6.7 |
| Here: | 4.6 |
| State: | 4.4 |
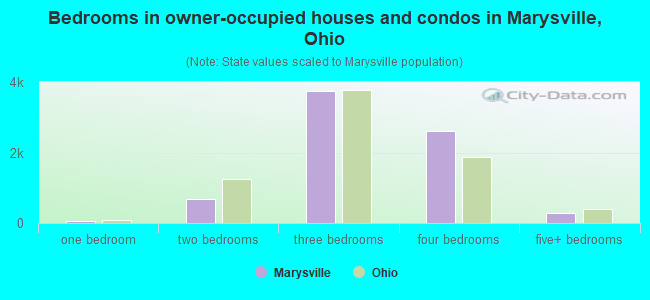
- Bedrooms in owner-occupied houses and condos in Marysville, Ohio
- 0no bedroom
- 431 bedroom
- 6842 bedrooms
- 3,7533 bedrooms
- 2,6164 bedrooms
- 2775+ bedrooms
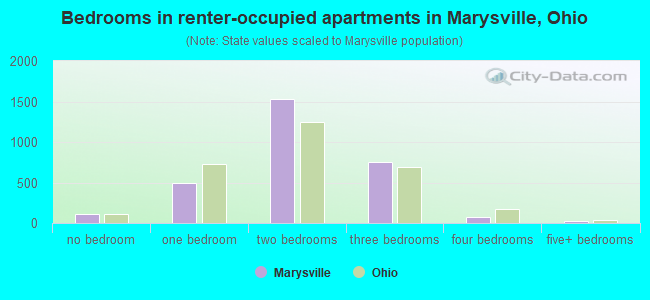
- Bedrooms in renter-occupied apartments in Marysville, Ohio
- 115no bedroom
- 4891 bedroom
- 1,5342 bedrooms
- 7553 bedrooms
- 754 bedrooms
- 265+ bedrooms
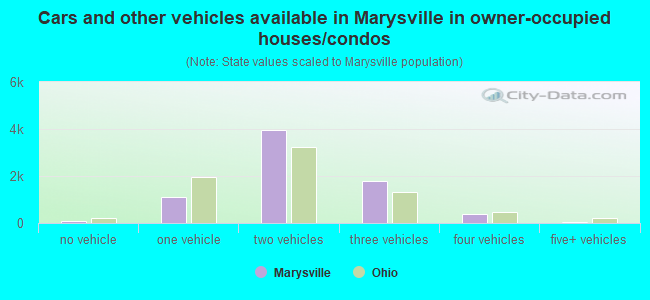
- Cars and other vehicles available in Marysville in owner-occupied houses/condos
- 98no vehicle
- 1,1161 vehicle
- 3,9642 vehicles
- 1,7773 vehicles
- 3944 vehicles
- 255+ vehicles
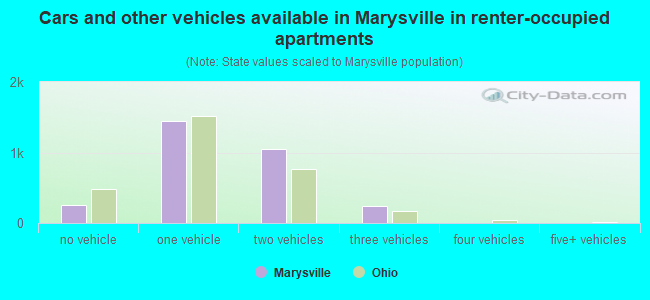
- Cars and other vehicles available in Marysville in renter-occupied apartments
- 255no vehicle
- 1,4431 vehicle
- 1,0552 vehicles
- 2413 vehicles
- 04 vehicles
- 05+ vehicles
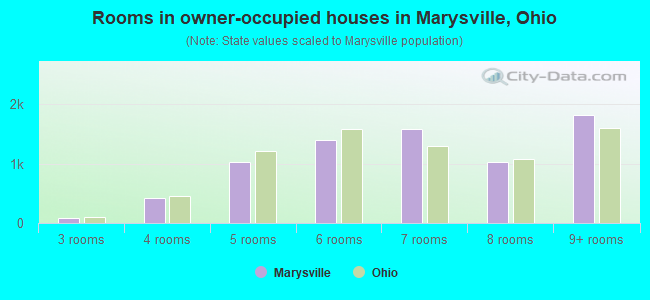
- Rooms in owner-occupied houses in Marysville, Ohio
- 01 room
- 02 rooms
- 783 rooms
- 4304 rooms
- 1,0275 rooms
- 1,3986 rooms
- 1,5837 rooms
- 1,0338 rooms
- 1,8239+ rooms
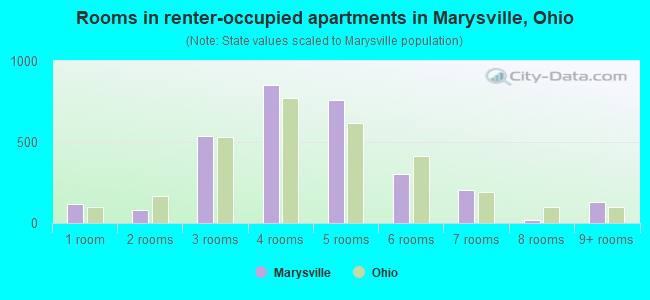
- Rooms in renter-occupied apartments in Marysville, Ohio
- 1151 room
- 782 rooms
- 5363 rooms
- 8504 rooms
- 7585 rooms
- 3036 rooms
- 2057 rooms
- 178 rooms
- 1319+ rooms
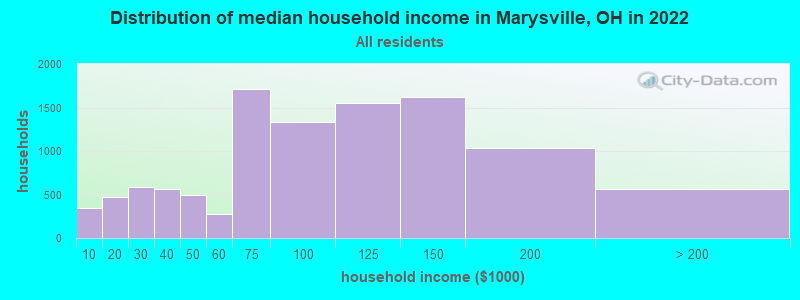
Marysville, OH household income distribution

- 350Less than $10,000
- 467$10,000 to $19,999
- 586$20,000 to $29,999
- 562$30,000 to $39,999
- 499$40,000 to $49,999
- 279$50,000 to $59,999
- 1,716$60,000 to $74,999
- 1,338$75,000 to $99,999
- 1,553$100,000 to $124,999
- 1,619$125,000 to $149,999
- 1,034$150,000 to $199,999
- 563$200,000 or more
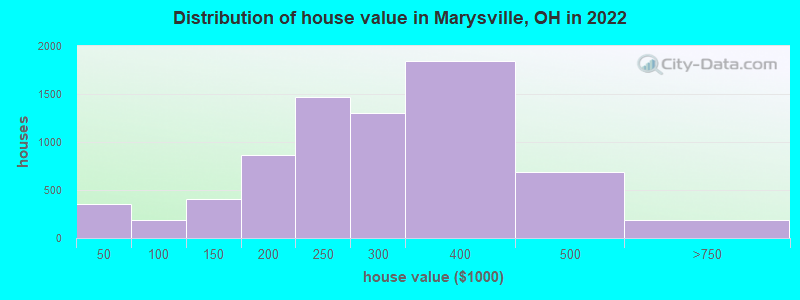
Home value of owner - occupied houses in 2022 in Marysville, OH
-
- 74Less than $10,000
- 78$10,000 to $14,999
- 6$15,000 to $19,999
- 90$20,000 to $24,999
- 44$25,000 to $29,999
- 35$30,000 to $34,999
- 22$40,000 to $49,999
- 21$50,000 to $59,999
- 51$60,000 to $69,999
- 46$70,000 to $79,999
- 35$80,000 to $89,999
- 5$90,000 to $99,999
- 93$100,000 to $124,999
- 315$125,000 to $149,999
- 363$150,000 to $174,999
- 505$175,000 to $199,999
- 1,463$200,000 to $249,999
- 1,301$250,000 to $299,999
- 1,842$300,000 to $399,999
- 687$400,000 to $499,999
- 155$500,000 to $749,999
- 30$750,000 to $999,999
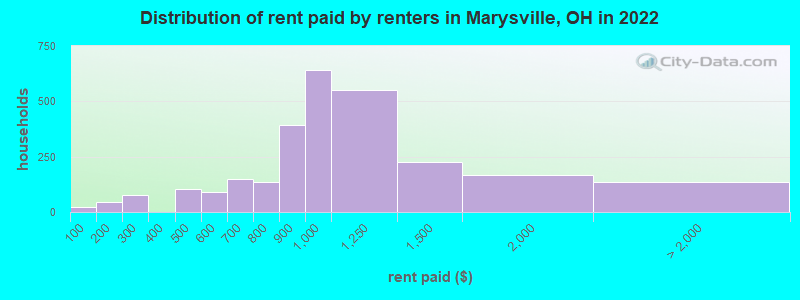
Rent paid by renters in 2022 in Marysville, OH
-
- 22Less than $100
- 46$100 to $149
- 53$200 to $249
- 22$250 to $299
- 81$400 to $449
- 21$450 to $499
- 82$500 to $549
- 9$550 to $599
- 47$600 to $649
- 101$650 to $699
- 120$700 to $749
- 15$750 to $799
- 391$800 to $899
- 642$900 to $999
- 551$1,000 to $1,249
- 225$1,250 to $1,499
- 168$1,500 to $1,999
- 35$2,000 to $2,499
- 34$3,000 to $3,499
- 8$3,500 or more
- 57No cash rent
Percentage of workers working in this county: 57.5%
Number of people working at home: 3,331 (25.8% of all workers)
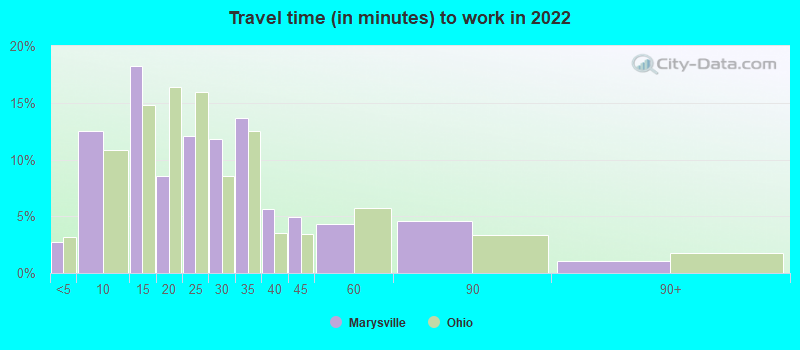
Travel time to work (commute)
- Less than 5 minutes: 295
- 5 to 9 minutes: 1,697
- 10 to 14 minutes: 1,585
- 15 to 19 minutes: 1,217
- 20 to 24 minutes: 2,010
- 25 to 29 minutes: 1,074
- 30 to 34 minutes: 929
- 35 to 39 minutes: 566
- 40 to 44 minutes: 1,251
- 45 to 59 minutes: 674
- 60 to 89 minutes: 240
- 90 or more minutes: 223
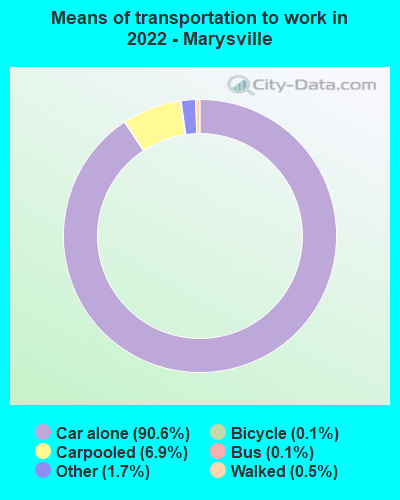
Means of transportation to work:
- Drove a car alone: 11,034 (72.4%)
- Carpooled: 906 (5.9%)
- Bus: 14 (0.1%)
- Ferryboat: 4 (0.0%)
- Taxi: 250 (1.6%)
- Bicycle: 15 (0.1%)
- Walked: 60 (0.4%)
- Worked at home: 3,331 (21.9%)
- Unemployment by race in 2022
- Unemployment rate for White non-Hispanic residents
- 2.0%Males
- 2.2%Females
- Unemployment rate for Black residents
- 11.2%Males
- Unemployment rate for Asian residents
- 19.7%Females
- Unemployment rate for other race residents
- 9.9%Males
- Unemployment rate for Hispanic or Latino residents
- 2.7%Males
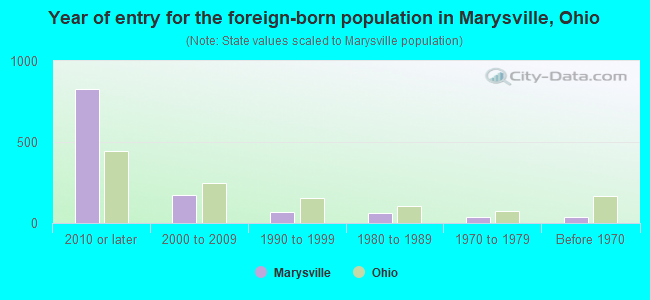
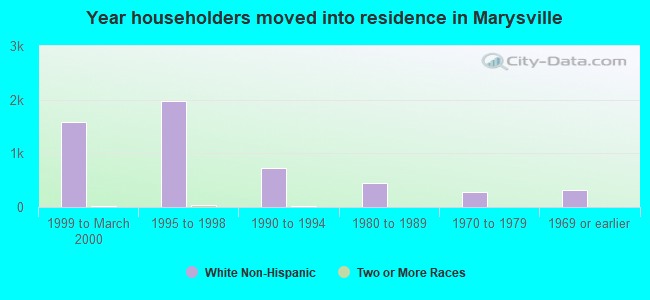
- Year of entry for the foreign-born population in Marysville, Ohio
- 8272010 or later
- 1702000 to 2009
- 661990 to 1999
- 601980 to 1989
- 341970 to 1979
- 34Before 1970
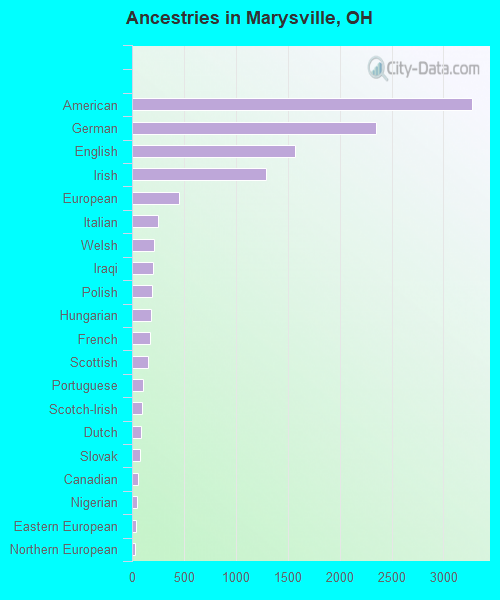
First ancestries reported:
- American: 3,275 (25.1%)
- German: 2,346 (18.0%)
- English: 1,569 (12.0%)
- Irish: 1,295 (9.9%)
- European: 455 (3.5%)
- Italian: 251 (1.9%)
- Welsh: 209 (1.6%)
- Iraqi: 205 (1.6%)
- Polish: 189 (1.4%)
- Hungarian: 185 (1.4%)
- French: 174 (1.3%)
- Scottish: 155 (1.2%)
- Portuguese: 105 (0.8%)
- Scotch-Irish: 98 (0.8%)
- Dutch: 85 (0.7%)
- Slovak: 80 (0.6%)
- Canadian: 56 (0.4%)
- Nigerian: 47 (0.4%)
- Eastern European: 41 (0.3%)
- Northern European: 32 (0.2%)
- Scandinavian: 27 (0.2%)
- Danish: 24 (0.2%)
- British: 22 (0.2%)
- Czech: 21 (0.2%)
- Greek: 19 (0.1%)
- Norwegian: 17 (0.1%)
- Ukrainian: 16 (0.1%)
- Jamaican: 15 (0.1%)
- African: 14 (0.1%)
- Finnish: 12 (0.09%)
- Swiss: 10 (0.08%)
- Lebanese: 8 (0.06%)
- Swedish: 8 (0.06%)
- Somali: 7 (0.05%)
- Czechoslovakian: 5 (0.04%)
Most common places of birth for foreign-born residents (%):
| Marysville: | 18.7% (207) |
| Ohio: | 7.8% (44,796) |
| Marysville: | 17.5% (194) |
| Ohio: | 11.6% (66,525) |
| Marysville: | 15.3% (169) |
| Ohio: | 0.6% (3,414) |
| Marysville: | 5.3% (59) |
| Ohio: | 6.2% (35,703) |
| Marysville: | 4.5% (50) |
| Ohio: | 0.1% (408) |
| Marysville: | 4.4% (49) |
| Ohio: | 2.6% (14,988) |
| Marysville: | 3.6% (40) |
| Ohio: | 1.2% (7,029) |
| Marysville: | 3.6% (40) |
| Ohio: | 0.0% (104) |
| Marysville: | 3.1% (34) |
| Ohio: | 1.4% (8,101) |
| Marysville: | 2.8% (31) |
| Ohio: | 0.2% (1,056) |
| Marysville: | 2.4% (26) |
| Ohio: | 3.1% (17,818) |
| Marysville: | 2.3% (25) |
| Ohio: | 0.1% (327) |
| Marysville: | 2.1% (23) |
| Ohio: | 1.4% (7,947) |
Place of birth for U.S.-born residents:
- This state: 20,365
- Other state: 5,230
- Northeast: 792
- Midwest: 1,560
- South: 2,083
- West: 791
82.9% of Marysville residents lived in the same house 1 years ago.
Out of people who lived in different houses, 25.4% lived in this county.
Out of people who lived in different counties, 87.4% lived in Ohio.
| Marysville: | 82.9% |
| State average: | 87.8% |
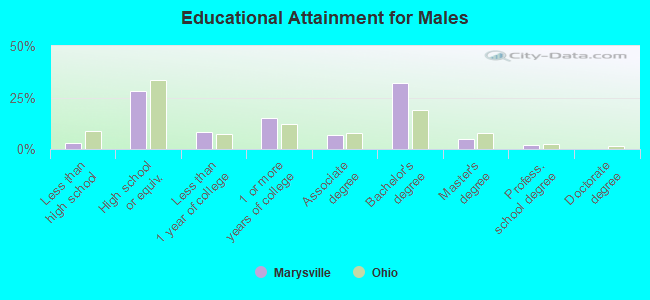
Education attainment for males 25 years and older:
- No schooling: 84
- Nursery to 4th grade: 0
- 5th and 6th grade: 1
- 7th and 8th grade: 0
- 9th grade: 95
- 10th grade: 25
- 11th grade: 47
- 12th grade, no diploma: 7
- High school graduate (or equivalency): 2,373
- Less than 1 year of college: 682
- Some college more than 1 year, no degree: 1,264
- Associate degree: 555
- Bachelor's degree: 2,709
- Master's degree: 427
- Professional school degree: 150
- Doctorate degree: 18
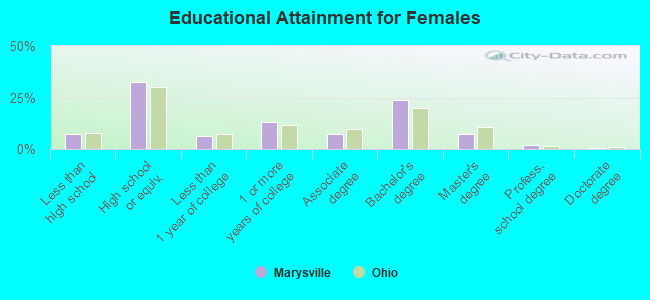
Education attainment for females 25 years and older:
- No schooling: 48
- Nursery to 4th grade: 0
- 5th and 6th grade: 14
- 7th and 8th grade: 58
- 9th grade: 199
- 10th grade: 173
- 11th grade: 235
- 12th grade, no diploma: 102
- High school graduate (or equivalency): 3,593
- Less than 1 year of college: 690
- Some college more than 1 year, no degree: 1,476
- Associate degree: 821
- Bachelor's degree: 2,639
- Master's degree: 792
- Professional school degree: 210
- Doctorate degree: 52
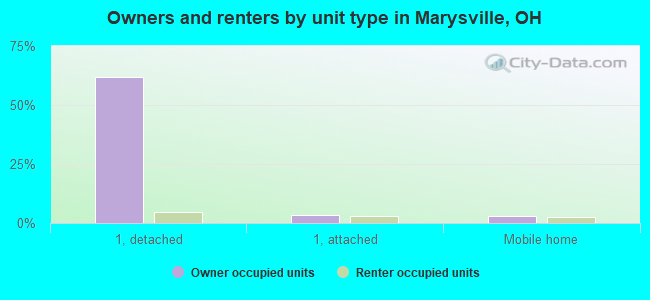
Housing units in structures:
- One, detached: 7,190
- One, attached: 688
- Two: 285
- 3 or 4: 766
- 5 to 9: 556
- 10 to 19: 188
- 20 to 49: 74
- 50 or more: 89
- Mobile homes: 562
- Boats, RVs, vans, etc.: 7
Median worth of mobile homes: $17,183
Housing units lacking complete kitchen facilities in 2022: 0.6%
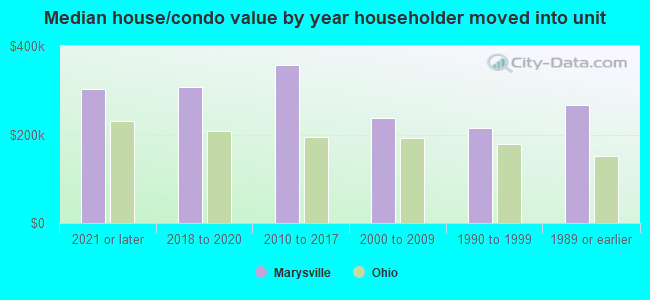
House/condo owner moved in on average 6 years ago
Renter moved in on average -1 years ago
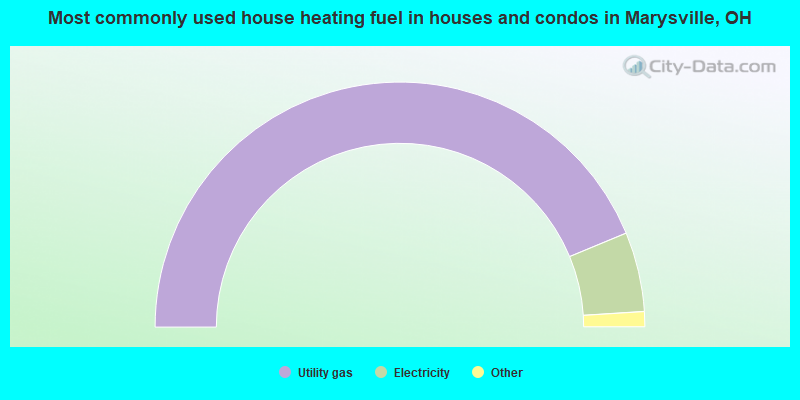
- 87.3%Utility gas
- 11.6%Electricity
- 0.6%Bottled, tank, or LP gas
- 0.5%Fuel oil, kerosene, etc.
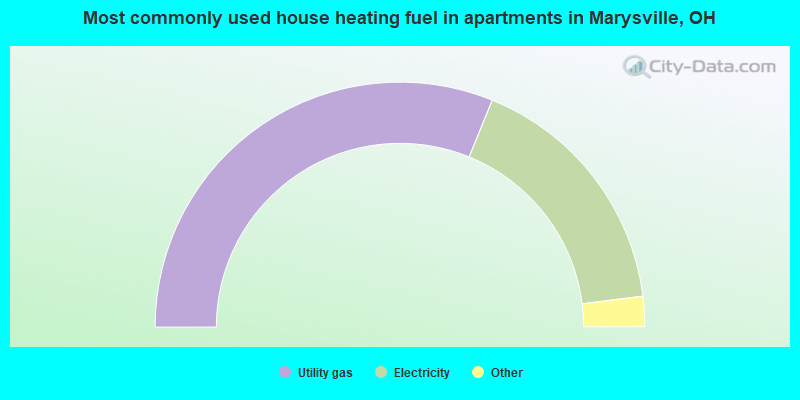
- 62.3%Utility gas
- 33.7%Electricity
- 2.7%Bottled, tank, or LP gas
- 1.3%No fuel used
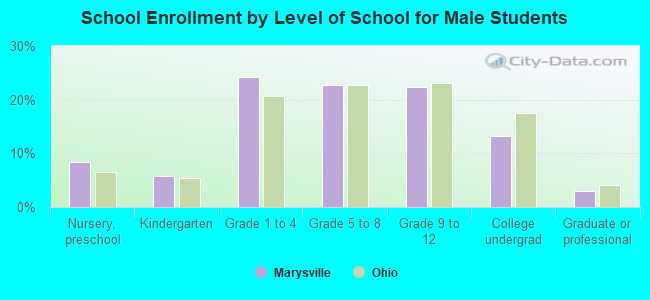
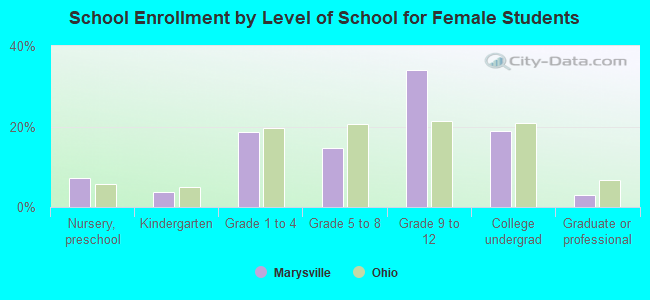
Private vs. public school enrollment:
| Here: | 19.6% |
| Ohio: | 16.0% |
| Here: | 4.5% |
| Ohio: | 13.1% |
| Here: | 19.8% |
| Ohio: | 22.3% |