Massapequa, NY (New York) Houses and Residents
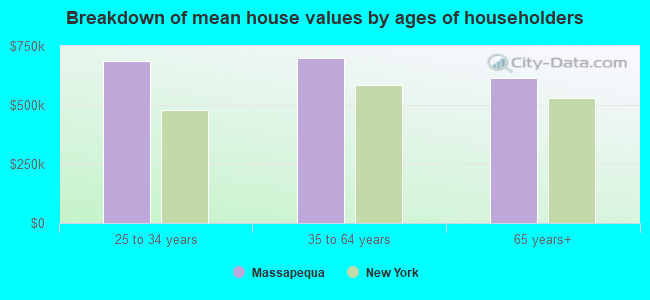
Estimated median house or condo value in 2022: $665,445 (it was $265,200 in 2000 )
Massapequa:
$665,445New York:
$400,400
Lower value quartile - upper value quartile: $556,241 - $813,167Mean price in 2022: Detached houses: $701,644 Here:
$701,644State:
$476,719
Townhouses or other attached units: $691,263 Here:
$691,263State:
$699,270
In 2-unit structures: $434,578 Here:
$434,578State:
$713,077
In 5-or-more-unit structures: $401,194 Here:
$401,194State:
$912,009
Total population: 21,685 (All urban)
Houses: 7,592 (7,392 occupied: 7,104 owner occupied, 275 renter occupied )
% of renters here:
4%State:
46%
Housing density: 2,080 houses/condos per square mile
Median price asked for vacant for-sale houses and condos in 2022: $302,880.
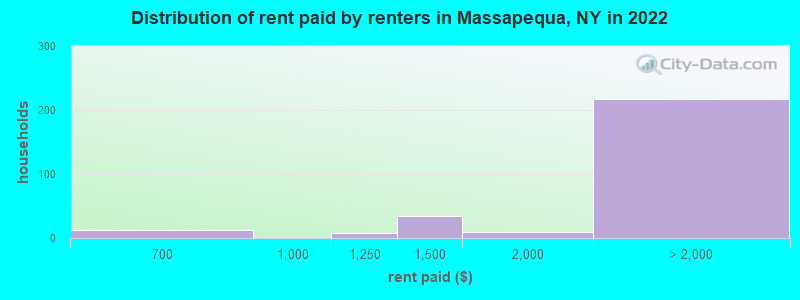
Median contract rent in 2022: over $2,000 (lower quartile is $1,757, upper quartile is over $2,000)
Median rent asked for vacant for-rent units in 2022: $1,670
Median gross rent in Massapequa, NY in 2022: over $2,000
Housing units in Massapequa with a mortgage: 4,794 (821 second mortgage, 16 home equity loan, 737 both second mortgage and home equity loan )Houses without a mortgage: 123
Median household income for houses/condos with a mortgage: $182,926
Median household income for apartments without a mortgage: $117,492
Median monthly housing costs: $2,914
Data:
Median house or condo value ($)
Median house or condo value ($ change since 2000)
Median house or condo value ($) - White
Median house or condo value ($) - Black or African American
Median house or condo value ($) - Asian
Median house or condo value ($) - Hispanic or Latino
Median house or condo value ($) - American Indian and Alaska Native
Median house or condo value ($) - Multirace
Median house or condo value ($) - Other Race
Median price asked for mobile homes ($)
Household density (households per square mile)
Mean house or condo value by units in structure - 1, detached ($)
Mean house or condo value by units in structure - 1, attached ($)
Mean house or condo value by units in structure - 2 ($)
Mean house or condo value by units in structure by units in structure - 3 or 4 ($)
Mean house or condo value by units in structure - 5 or more ($)
Mean house or condo value by units in structure - Boat, RV, van, etc. ($)
Mean house or condo value by units in structure - Mobile home ($)
Median contract rent ($)
Median contract rent - Lower quartile ($)
Median contract rent - Upper quartile ($)
Median gross rent ($)
Urban houses (%)
Rural houses (%)
Houses occupied (%)
Houses occupied (% change since 2000)
Houses owner occupied (%)
Houses owner occupied (% change since 2000)
Houses renter occupied (%)
Houses renter occupied (% change since 2000)
Vacant housing units - For rent (%)
Vacant housing units - For rent (% change since 2000)
Vacant housing units - For sale only (%)
Vacant housing units - For sale only (% change since 2000)
Vacant housing units - Rented or sold, not occupied (%)
Vacant housing units - Rented or sold, not occupied (% change since 2000)
Vacant housing units - For seasonal, recreational, or occasional use (%)
Vacant housing units - For seasonal, recreational, or occasional use (% change since 2000)
Vacant housing units - For migrant workers (%)
Vacant housing units - For migrant workers (% change since 2000)
Vacant housing units - Other vacant (%)
Vacant housing units - Other vacant (% change since 2000)
Median monthly housing costs ($)
Median household income for houses/condos with a mortgage ($)
Median household income for houses/condos without a mortgage ($)
Median household income ($)
Median household income ($) - White
Median household income ($) - Black or African American
Median household income ($) - Asian
Median household income ($) - Hispanic or Latino
Median household income ($) - American Indian and Alaska Native
Median household income ($) - Multirace
Median household income ($) - Other Race
Mortgage status - with mortgage (%)
Mortgage status - with second mortgage (%)
Mortgage status - with home equity loan (%)
Mortgage status - with both second mortgage and home equity loan (%)
Mortgage status - without a mortgage (%)
Median year house/condo built
Median year apartment built
Household type by relationship - Male householder living alone (%)
Household type by relationship - Male householder not living alone (%)
Household type by relationship - Female householder living alone (%)
Household type by relationship - Female householder not living alone (%)
Household type by relationship - Opposite-Sex spouse (%)
Household type by relationship - Same-Sex spouse (%)
Household type by relationship - Opposite-Sex unmarried partner (%)
Household type by relationship - Same-Sex unmarried partner (%)
Household type by relationship - In group quarters (%)
Size of family households - 2-person household (%)
Size of family households - 3-person household (%)
Size of family households - 4-person household (%)
Size of family households - 5-person household (%)
Size of family households - 6-person household (%)
Size of family households - 7-or-more-person household (%)
Size of nonfamily households - 1-person household (%)
Size of nonfamily households - 2-person household (%)
Size of nonfamily households - 3-person household (%)
Size of nonfamily households - 4-person household (%)
Size of nonfamily households - 5-person household (%)
Size of nonfamily households - 6-person household (%)
Size of nonfamily households - 7-or-moreperson household (%)
Year house built - Built 2010 or later (%)
Year house built - Built 2000 to 2009 (%)
Year house built - Built 1990 to 1999 (%)
Year house built - Built 1980 to 1989 (%)
Year house built - Built 1970 to 1979 (%)
Year house built - Built 1960 to 1969 (%)
Year house built - Built 1950 to 1959 (%)
Year house built - Built 1940 to 1949 (%)
Year house built - Built 1939 or earlier (%)
Median number of rooms in houses and condos
Median number of rooms in apartments
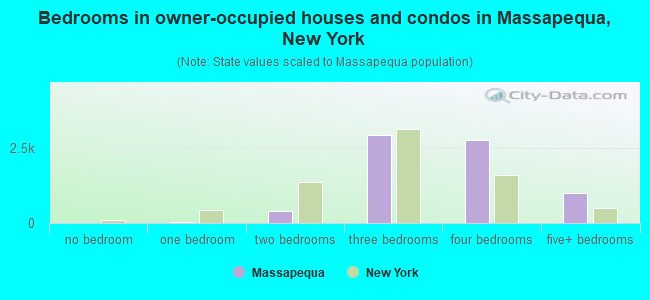
Median number of bedrooms in owner occupied houses
Mean number of bedrooms in owner occupied houses
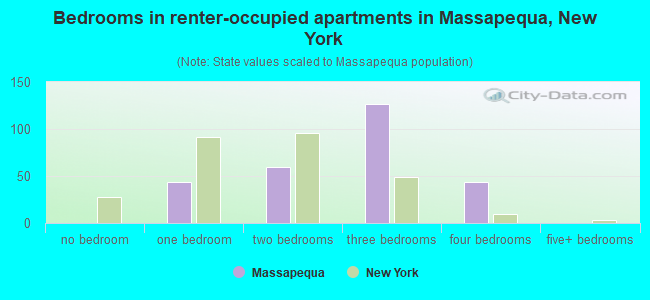
Median number of bedrooms in renter occupied houses
Mean number of bedrooms in renter occupied houses
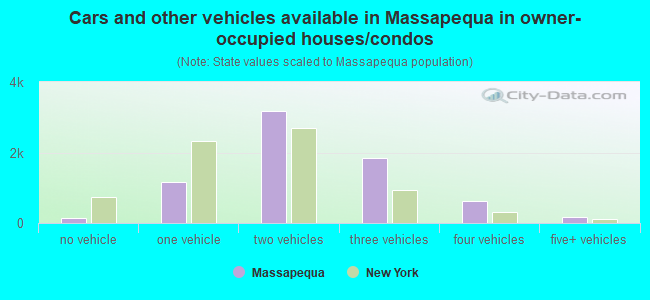
Median number of vehichles in owner occupied houses
Mean number of vehichles in owner occupied houses
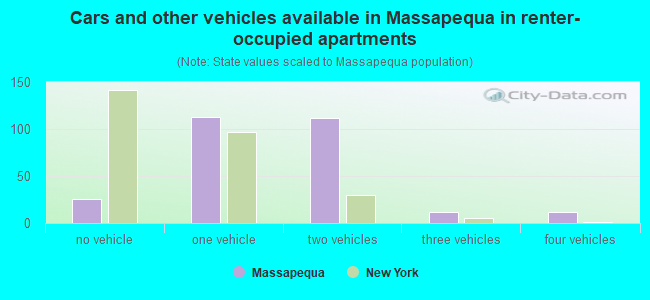
Median number of vehichles in renter occupied houses
Mean number of vehichles in renter occupied houses
Rooms in owner-occupied houses - 1 room (%)
Rooms in owner-occupied houses - 2 rooms (%)
Rooms in owner-occupied houses - 3 rooms (%)
Rooms in owner-occupied houses - 4 rooms (%)
Rooms in owner-occupied houses - 5 rooms (%)
Rooms in owner-occupied houses - 6 rooms (%)
Rooms in owner-occupied houses - 7 rooms (%)
Rooms in owner-occupied houses - 8 rooms (%)
Rooms in owner-occupied houses - 9+ rooms (%)
Rooms in renter-occupied houses - 1 room (%)
Rooms in renter-occupied houses - 2 rooms (%)
Rooms in renter-occupied houses - 3 rooms (%)
Rooms in renter-occupied houses - 4 rooms (%)
Rooms in renter-occupied houses - 5 rooms (%)
Rooms in renter-occupied houses - 6 rooms (%)
Rooms in renter-occupied houses - 7 rooms (%)
Rooms in renter-occupied houses - 8 rooms (%)
Rooms in renter-occupied houses - 9+ rooms (%)
Bedrooms in owner-occupied houses - no bedrooms (%)
Bedrooms in owner-occupied houses - 1 bedroom (%)
Bedrooms in owner-occupied houses - 2 bedrooms (%)
Bedrooms in owner-occupied houses - 3 bedrooms (%)
Bedrooms in owner-occupied houses - 4 bedrooms (%)
Bedrooms in owner-occupied houses - 5+ bedrooms (%)
Bedrooms in renter-occupied houses - no bedrooms (%)
Bedrooms in renter-occupied houses - 1 bedroom (%)
Bedrooms in renter-occupied houses - 2 bedrooms (%)
Bedrooms in renter-occupied houses - 3 bedrooms (%)
Bedrooms in renter-occupied houses - 4 bedrooms (%)
Bedrooms in renter-occupied houses - 5+ bedrooms (%)
Vehicles available in owner-occupied houses - no vehicle available (%)
Vehicles available in owner-occupied houses - 1 vehicle available(%)
Vehicles available in owner-occupied houses - 2 Vehicles available (%)
Vehicles available in owner-occupied houses - 3 Vehicles available (%)
Vehicles available in owner-occupied houses - 4 Vehicles available (%)
Vehicles available in owner-occupied houses - 5+ Vehicles available (%)
Vehicles available in renter-occupied houses - no vehicle available (%)
Vehicles available in renter-occupied houses - 1 vehicle available (%)
Vehicles available in renter-occupied houses - 2 Vehicles available (%)
Vehicles available in renter-occupied houses - 3 Vehicles available (%)
Vehicles available in renter-occupied houses - 4 Vehicles available (%)
Vehicles available in renter-occupied houses - 5+ Vehicles available (%)
Housing units in structures - 1, detached (%)
Housing units in structures - 1, attached (%)
Housing units in structures - 2 (%)
Housing units in structures - 3 or 4 (%)
Housing units in structures - 5 to 9 (%)
Housing units in structures - 10 to 19 (%)
Housing units in structures - 20 to 49 (%)
Housing units in structures - 50 or more (%)
Housing units in structures - Mobile home (%)
Housing units in structures - Boat, RV, van, etc. (%)
Housing units in structures - Owners - 1, detached (%)
Housing units in structures - Owners - 1, attached (%)
Housing units in structures - Owners - 2 (%)
Housing units in structures - Owners - 3 or 4 (%)
Housing units in structures - Owners - 5 to 9 (%)
Housing units in structures - Owners - 10 to 19 (%)
Housing units in structures - Owners - 20 to 49 (%)
Housing units in structures - Owners - 50 or more (%)
Housing units in structures - Owners - Mobile home (%)
Housing units in structures - Owners - Boat, RV, van, etc. (%)
Housing units in structures - Renters - 1, detached (%)
Housing units in structures - Renters - 1, attached (%)
Housing units in structures - Renters - 2 (%)
Housing units in structures - Renters - 3 or 4 (%)
Housing units in structures - Renters - 5 to 9 (%)
Housing units in structures - Renters - 10 to 19 (%)
Housing units in structures - Renters - 20 to 49 (%)
Housing units in structures - Renters - 50 or more (%)
Housing units in structures - Renters - Mobile home (%)
Housing units in structures - Renters - Boat, RV, van, etc. (%)
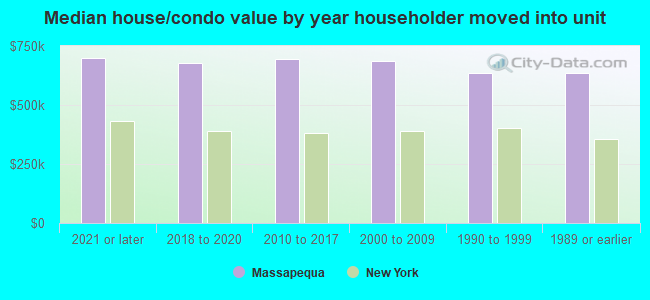
House/condo owner moved in on average (years ago)
Renter moved in on average (years ago)
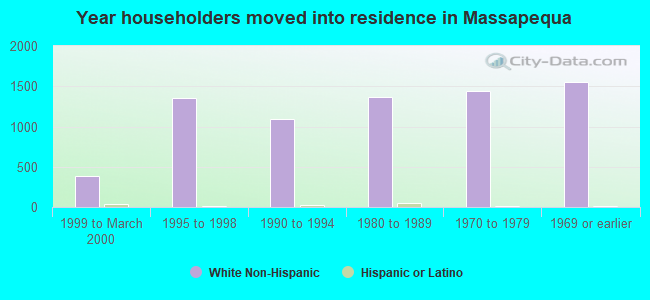
Year householder moved into unit - Moved in 1999 to March 2000 (%)
Year householder moved into unit - Moved in 1999 to March 2000 (%) - White
Year householder moved into unit - Moved in 1999 to March 2000 (%) - Black or African American
Year householder moved into unit - Moved in 1999 to March 2000 (%) - Asian
Year householder moved into unit - Moved in 1999 to March 2000 (%) - Hispanic or Latino
Year householder moved into unit - Moved in 1999 to March 2000 (%) - American Indian and Alaska Native
Year householder moved into unit - Moved in 1999 to March 2000 (%) - Multirace
Year householder moved into unit - Moved in 1999 to March 2000 (%) - Other Race
Year householder moved into unit - Moved in 1995 to 1998 (%)
Year householder moved into unit - Moved in 1995 to 1998 (%) - White
Year householder moved into unit - Moved in 1995 to 1998 (%) - Black or African American
Year householder moved into unit - Moved in 1995 to 1998 (%) - Asian
Year householder moved into unit - Moved in 1995 to 1998 (%) - Hispanic or Latino
Year householder moved into unit - Moved in 1995 to 1998 (%) - American Indian and Alaska Native
Year householder moved into unit - Moved in 1995 to 1998 (%) - Multirace
Year householder moved into unit - Moved in 1995 to 1998 (%) - Other Race
Year householder moved into unit - Moved in 1990 to 1994 (%)
Year householder moved into unit - Moved in 1990 to 1994 (%) - White
Year householder moved into unit - Moved in 1990 to 1994 (%) - Black or African American
Year householder moved into unit - Moved in 1990 to 1994 (%) - Asian
Year householder moved into unit - Moved in 1990 to 1994 (%) - Hispanic or Latino
Year householder moved into unit - Moved in 1990 to 1994 (%) - American Indian and Alaska Native
Year householder moved into unit - Moved in 1990 to 1994 (%) - Multirace
Year householder moved into unit - Moved in 1990 to 1994 (%) - Other Race
Year householder moved into unit - Moved in 1980 to 1989 (%)
Year householder moved into unit - Moved in 1980 to 1989 (%) - White
Year householder moved into unit - Moved in 1980 to 1989 (%) - Black or African American
Year householder moved into unit - Moved in 1980 to 1989 (%) - Asian
Year householder moved into unit - Moved in 1980 to 1989 (%) - Hispanic or Latino
Year householder moved into unit - Moved in 1980 to 1989 (%) - American Indian and Alaska Native
Year householder moved into unit - Moved in 1980 to 1989 (%) - Multirace
Year householder moved into unit - Moved in 1980 to 1989 (%) - Other Race
Year householder moved into unit - Moved in 1970 to 1979 (%)
Year householder moved into unit - Moved in 1970 to 1979 (%) - White
Year householder moved into unit - Moved in 1970 to 1979 (%) - Black or African American
Year householder moved into unit - Moved in 1970 to 1979 (%) - Asian
Year householder moved into unit - Moved in 1970 to 1979 (%) - Hispanic or Latino
Year householder moved into unit - Moved in 1970 to 1979 (%) - American Indian and Alaska Native
Year householder moved into unit - Moved in 1970 to 1979 (%) - Multirace
Year householder moved into unit - Moved in 1970 to 1979 (%) - Other Race
Year householder moved into unit - Moved in 1969 or earlier (%)
Year householder moved into unit - Moved in 1969 or earlier (%) - White
Year householder moved into unit - Moved in 1969 or earlier (%) - Black or African American
Year householder moved into unit - Moved in 1969 or earlier (%) - Asian
Year householder moved into unit - Moved in 1969 or earlier (%) - Hispanic or Latino
Year householder moved into unit - Moved in 1969 or earlier (%) - American Indian and Alaska Native
Year householder moved into unit - Moved in 1969 or earlier (%) - Multirace
Year householder moved into unit - Moved in 1969 or earlier (%) - Other Race
Housing units lacking complete plumbing facilities (%)
Housing units lacking complete kitchen facilities (%)
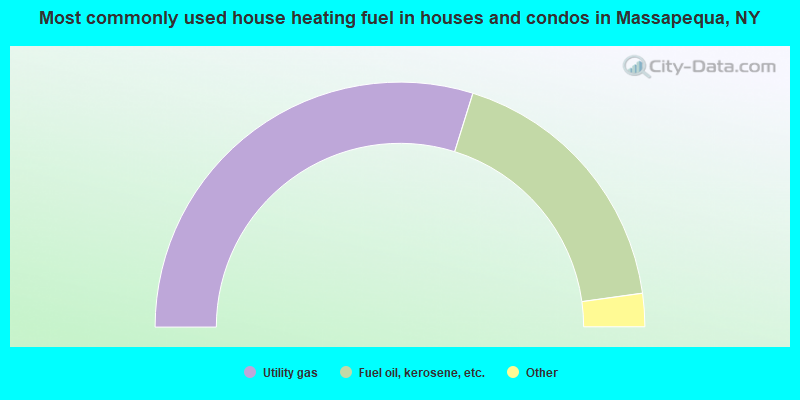
House heating fuel used in houses and condos - Utility gas (%)
House heating fuel used in houses and condos - Bottled, tank, or LP gas (%)
House heating fuel used in houses and condos - Electricity (%)
House heating fuel used in houses and condos - Fuel oil, kerosene, etc. (%)
House heating fuel used in houses and condos - Coal or coke (%)
House heating fuel used in houses and condos - Wood (%)
House heating fuel used in houses and condos - Solar energy (%)
House heating fuel used in houses and condos - Other fuel (%)
House heating fuel used in houses and condos - No fuel used (%)
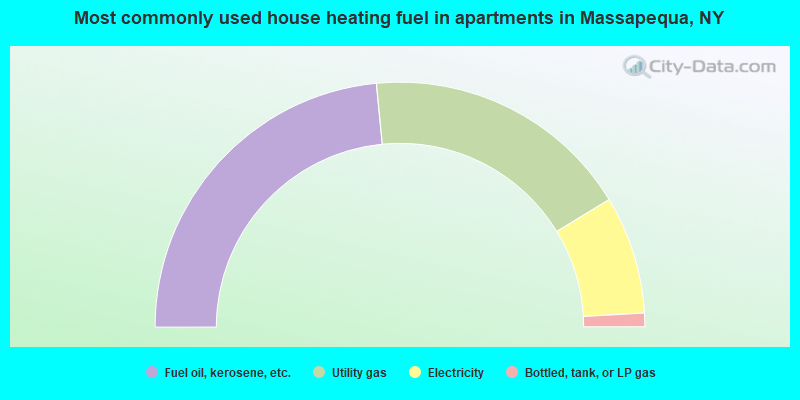
House heating fuel used in apartments - Utility gas (%)
House heating fuel used in apartments - Bottled, tank, or LP gas (%)
House heating fuel used in apartments - Electricity (%)
House heating fuel used in apartments - Fuel oil, kerosene, etc. (%)
House heating fuel used in apartments - Coal or coke (%)
House heating fuel used in apartments - Wood (%)
House heating fuel used in apartments - Solar energy (%)
House heating fuel used in apartments - Other fuel (%)
House heating fuel used in apartments - No fuel used (%)
Latest news about housing in Massapequa, NY collected exclusively by city-data.com from local newspapers, TV, and radio stations
Median year house/condo built: 1957Median year apartment built: 1959Household type by relationship:
Households: 21,759
Male householders: 3,966 (573 living alone ), Female householders: 3,362 (546 living alone )5,082 spouses (5,071 opposite-sex spouses ), 362 unmarried partners , (345 opposite-sex unmarried partners ), 7,464 children (7,260 natural , 27 adopted , 176 stepchildren ), 295 grandchildren , 55 brothers or sisters , 412 parents , 0 foster children , 297 other relatives , 409 non-relatives In group quarters: 49
Size of family households: 2,018 2-persons , 1,325 3-persons , 1,745 4-persons , 548 5-persons , 159 6-persons , 29 7-or-more-persons .
Size of nonfamily households: 1,168 1-person , 290 2-persons , 23 3-persons , 40 4-persons .
3,605 married couples with children. single-parent households (35 men , 234 women ).
90.1% of residents of Massapequa speak English at home. of residents speak Spanish at home (70% speak English very well , 22% speak English well , 7% speak English not well ).of residents speak other Indo-European language at home (82% speak English very well , 13% speak English well , 5% speak English not well ).of residents speak Asian or Pacific Island language at home (71% speak English very well , 9% speak English well , 21% speak English not well ).of residents speak other language at home (100% speak English very well ).
Foreign born population: 1,160 (5.3%)of them are naturalized citizens )
Median number of rooms in houses and condos:
Median number of rooms in apartments
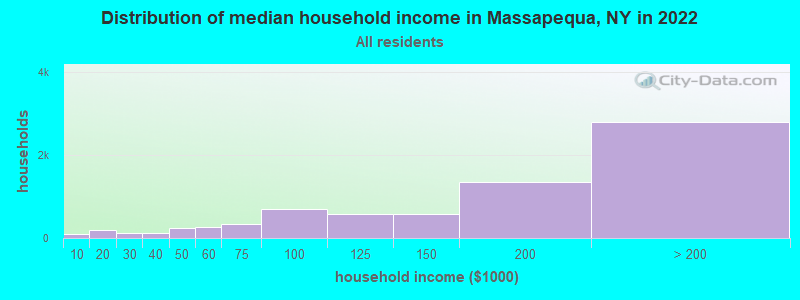
Massapequa, NY household income distribution 92 Less than $10,000190 $10,000 to $19,999116 $20,000 to $29,999124 $30,000 to $39,999252 $40,000 to $49,999274 $50,000 to $59,999333 $60,000 to $74,999689 $75,000 to $99,999565 $100,000 to $124,999580 $125,000 to $149,9991,353 $150,000 to $199,9992,788 $200,000 or more
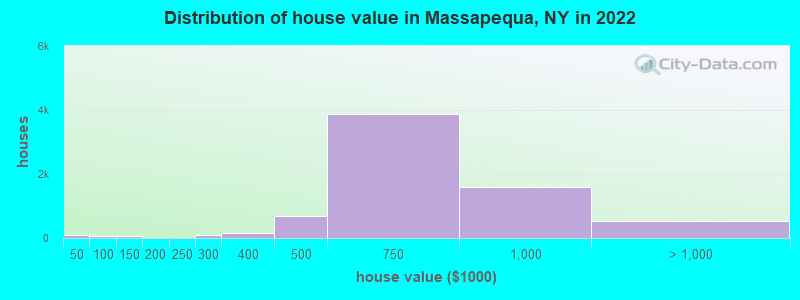
Home value of owner - occupied houses in 2022 in Massapequa, NY 66 Less than $10,00023 $25,000 to $29,9994 $40,000 to $49,99916 $50,000 to $59,9997 $60,000 to $69,99948 $70,000 to $79,99945 $100,000 to $124,99912 $125,000 to $149,99912 $150,000 to $174,99914 $200,000 to $249,99987 $250,000 to $299,999149 $300,000 to $399,999686 $400,000 to $499,9993,863 $500,000 to $749,9991,602 $750,000 to $999,999478 $1,000,000 to $1,499,99912 $1,500,000 to $1,999,99953 $2,000,000 or moreRent paid by renters in 2022 in Massapequa, NY 11 $600 to $6498 $1,000 to $1,24933 $1,250 to $1,4999 $1,500 to $1,99957 $2,000 to $2,49998 $2,500 to $2,99924 $3,500 or more36 No cash rent
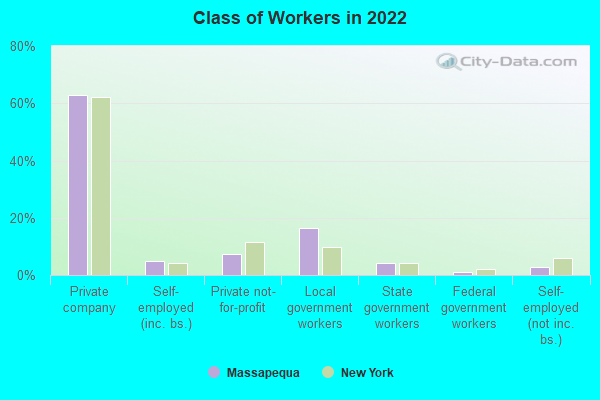
Percentage of workers working in this county: 58.8%Number of people working at home: 1,664 (14.6% of all workers )
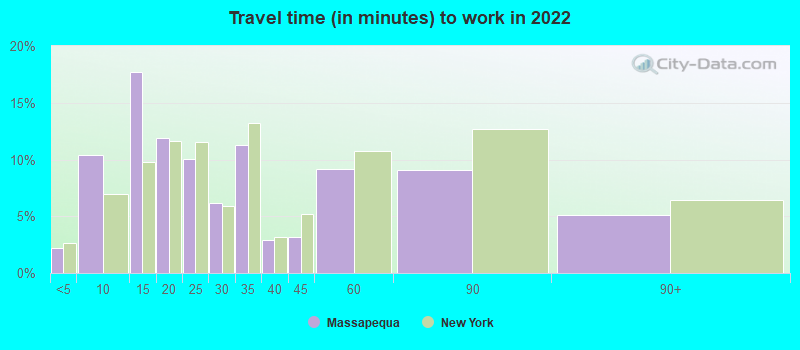
Travel time to work (commute)
Less than 5 minutes: 1545 to 9 minutes: 43410 to 14 minutes: 87115 to 19 minutes: 1,13320 to 24 minutes: 1,04925 to 29 minutes: 54430 to 34 minutes: 1,39935 to 39 minutes: 27440 to 44 minutes: 51145 to 59 minutes: 85160 to 89 minutes: 1,49590 or more minutes: 987
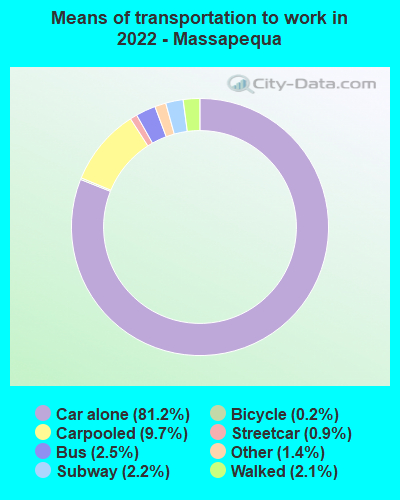
Means of transportation to work:
Drove a car alone: 5,863 (66.0%)Carpooled: 678 (7.6%)Bus : 174 (2.0%)Subway or elevated rail : 54 (0.6%)Long-distance train or commuter rail : 136 (1.5%)Taxi: 141 (1.6%)Bicycle: 20 (0.2%)Walked: 165 (1.9%)Worked at home: 1,664 (18.7%)
Unemployment by race in 2022
Unemployment rate for White non-Hispanic residents 4.7% Males1.8% FemalesUnemployment rate for Asian residents 12.9% FemalesUnemployment rate for two or more race residents 20.2% Males12.8% FemalesUnemployment rate for Hispanic or Latino residents 7.5% Males6.9% Females
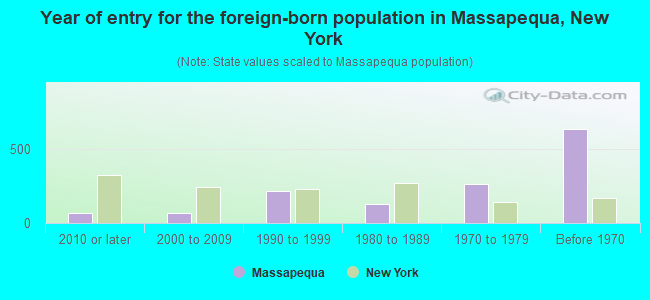
Year of entry for the foreign-born population in Massapequa, New York
70 2010 or later 69 2000 to 2009 212 1990 to 1999 131 1980 to 1989 265 1970 to 1979 632 Before 1970
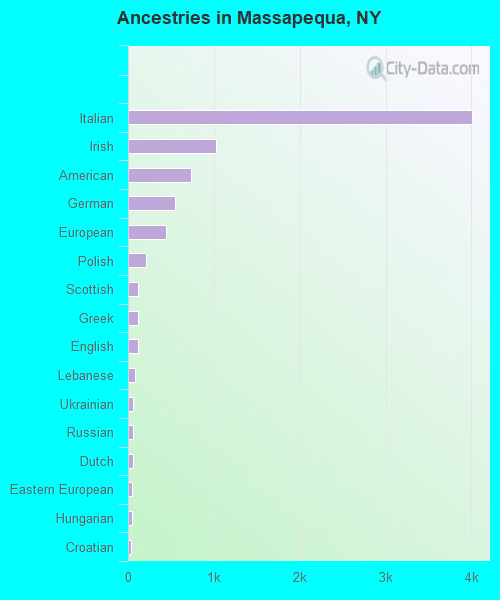
First ancestries reported:
Italian: 4,004 (44.7%)
Irish: 1,020 (11.4%)
American: 739 (8.3%)
German: 550 (6.1%)
European: 446 (5.0%)
Polish: 204 (2.3%)
Scottish: 121 (1.4%)
Greek: 119 (1.3%)
English: 111 (1.2%)
Lebanese: 76 (0.8%)
Ukrainian: 64 (0.7%)
Russian: 61 (0.7%)
Dutch: 55 (0.6%)
Eastern European: 45 (0.5%)
Hungarian: 43 (0.5%)
Croatian: 38 (0.4%)
Norwegian: 34 (0.4%)
Jamaican: 33 (0.4%)
Armenian: 32 (0.4%)
Turkish: 13 (0.1%)
Trinidadian and Tobagonian: 13 (0.1%)
French Canadian: 13 (0.1%)
Basque: 12 (0.1%)
Swedish: 11 (0.1%)
Brazilian: 10 (0.1%)
Portuguese: 8 (0.09%)
French: 7 (0.08%)
Austrian: 6 (0.07%)
Afghan: 6 (0.07%)
Scotch-Irish: 5 (0.06%)
Scandinavian: 4 (0.04%)
Welsh: 4 (0.04%)
Swiss: 3 (0.03%)
Nigerian: 1 (0.01%) Most common places of birth for foreign-born residents (%): Dominican Republic Massapequa:
12.4% (139)New York:
11.1% (501,040)
Italy Massapequa:
12.1% (136)New York:
1.8% (81,374)
Honduras Massapequa:
4.6% (52)New York:
1.2% (55,571)
St. Vincent and the Grenadines Massapequa:
4.5% (51)New York:
0.3% (13,674)
Lebanon Massapequa:
4.0% (45)New York:
0.2% (8,026)
Belize Massapequa:
3.8% (43)New York:
0.2% (7,715)
Peru Massapequa:
3.6% (40)New York:
1.2% (54,759)
Ukraine Massapequa:
3.5% (39)New York:
1.7% (78,421)
Canada Massapequa:
3.3% (37)New York:
1.3% (59,107)
India Massapequa:
3.2% (36)New York:
3.5% (158,432)
Cuba Massapequa:
2.9% (33)New York:
0.5% (23,242)
Colombia Massapequa:
2.9% (32)New York:
2.5% (111,920)
Other Middle Africa Massapequa:
2.8% (31)New York:
0.0% (1,367)
Greece Massapequa:
2.6% (29)New York:
0.6% (28,604)
Trinidad and Tobago Massapequa:
2.3% (26)New York:
2.0% (91,428)
Poland Massapequa:
2.1% (24)New York:
1.4% (65,102)
Armenia Massapequa:
1.9% (21)New York:
0.1% (2,881)
Netherlands Massapequa:
1.8% (20)New York:
0.1% (5,189)
Kuwait Massapequa:
1.6% (18)New York:
0.0% (1,860)
Germany Massapequa:
1.6% (18)New York:
0.9% (38,713)
Place of birth for U.S.-born residents:
This state: 19,095Other state: 1,109Northeast: 413Midwest: 126South: 307West: 264 94.9% of Massapequa residents lived in the same house 1 years ago.
Out of people who lived in different houses, 38.5% lived in this county.
Out of people who lived in different counties, 85.0% lived in New York.
Massapequa:
94.9%State average:
89.6%
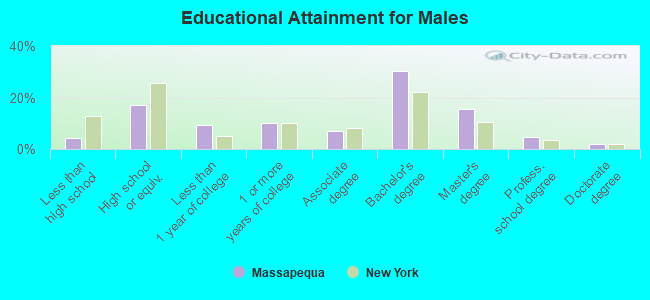
Education attainment for males 25 years and older:
No schooling: 32Nursery to 4th grade: 05th and 6th grade: 1037th and 8th grade: 199th grade: 2510th grade: 4711th grade: 2212th grade, no diploma: 94High school graduate (or equivalency): 1,356Less than 1 year of college: 755Some college more than 1 year, no degree: 793Associate degree: 557Bachelor's degree: 2,409Master's degree: 1,235Professional school degree: 357Doctorate degree: 146
Education attainment for females 25 years and older:
No schooling: 1Nursery to 4th grade: 75th and 6th grade: 247th and 8th grade: 89th grade: 010th grade: 1511th grade: 5112th grade, no diploma: 67High school graduate (or equivalency): 1,632Less than 1 year of college: 402Some college more than 1 year, no degree: 878Associate degree: 654Bachelor's degree: 1,773Master's degree: 1,877Professional school degree: 284Doctorate degree: 156
Housing units in structures:
One, detached: 7,377One, attached: 42Two: 1283 or 4: 910 to 19: 1850 or more: 17Housing units lacking complete plumbing facilities in 2022: 0.1%Housing units lacking complete kitchen facilities in 2022: 0.2%House/condo owner moved in on average 19 years ago
Renter moved in on average 4 years ago
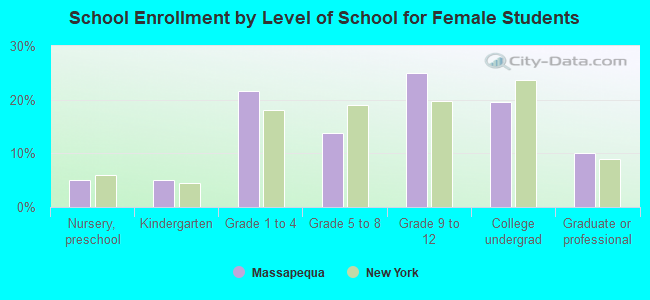
Private vs. public school enrollment:
Students in private schools in grades 1 to 8 (elementary and middle school): 134 Students in private schools in grades 9 to 12 (high school): 218 Students in private undergraduate colleges: 626