McAllen, TX (Texas) Houses and Residents
Estimated median house or condo value in 2022: $168,300 (it was $69,800 in 2000 )
McAllen:
$168,300Texas:
$275,400
Lower value quartile - upper value quartile: $105,400 - $265,800Mean price in 2022: Detached houses: $221,213 Here:
$221,213State:
$369,058
Townhouses or other attached units: $181,281 Here:
$181,281State:
$327,631
In 2-unit structures: $145,766 Here:
$145,766State:
$374,947
In 3-to-4-unit structures: $129,401 Here:
$129,401State:
$209,652
In 5-or-more-unit structures: $59,908 Here:
$59,908State:
$413,944
Mobile homes: $42,673 Here:
$42,673State:
$124,413
Total population: 138,596 (Urban population: 105,728, Rural population: 483 (all nonfarm) )
Houses: 56,411 (49,590 occupied: 30,604 owner occupied, 18,986 renter occupied )
% of renters here:
38%State:
38%
Housing density: 1,227 houses/condos per square mile
Median price asked for vacant for-sale houses and condos in 2022: $241,272.
Median contract rent in 2022: $813 (lower quartile is $592, upper quartile is $1,041)
Median rent asked for vacant for-rent units in 2022: $1,410
Median gross rent in McAllen, TX in 2022: $971
Housing units in McAllen with a mortgage: 14,394 (331 second mortgage, 0 home equity loan, 276 both second mortgage and home equity loan )Houses without a mortgage: 199
Median household income for houses/condos with a mortgage: $85,841
Median household income for apartments without a mortgage: $53,734
Median monthly housing costs: $942
Data:
Median house or condo value ($)
Median house or condo value ($ change since 2000)
Median house or condo value ($) - White
Median house or condo value ($) - Black or African American
Median house or condo value ($) - Asian
Median house or condo value ($) - Hispanic or Latino
Median house or condo value ($) - American Indian and Alaska Native
Median house or condo value ($) - Multirace
Median house or condo value ($) - Other Race
Median price asked for mobile homes ($)
Household density (households per square mile)
Mean house or condo value by units in structure - 1, detached ($)
Mean house or condo value by units in structure - 1, attached ($)
Mean house or condo value by units in structure - 2 ($)
Mean house or condo value by units in structure by units in structure - 3 or 4 ($)
Mean house or condo value by units in structure - 5 or more ($)
Mean house or condo value by units in structure - Boat, RV, van, etc. ($)
Mean house or condo value by units in structure - Mobile home ($)
Median contract rent ($)
Median contract rent - Lower quartile ($)
Median contract rent - Upper quartile ($)
Median gross rent ($)
Urban houses (%)
Rural houses (%)
Houses occupied (%)
Houses occupied (% change since 2000)
Houses owner occupied (%)
Houses owner occupied (% change since 2000)
Houses renter occupied (%)
Houses renter occupied (% change since 2000)
Vacant housing units - For rent (%)
Vacant housing units - For rent (% change since 2000)
Vacant housing units - For sale only (%)
Vacant housing units - For sale only (% change since 2000)
Vacant housing units - Rented or sold, not occupied (%)
Vacant housing units - Rented or sold, not occupied (% change since 2000)
Vacant housing units - For seasonal, recreational, or occasional use (%)
Vacant housing units - For seasonal, recreational, or occasional use (% change since 2000)
Vacant housing units - For migrant workers (%)
Vacant housing units - For migrant workers (% change since 2000)
Vacant housing units - Other vacant (%)
Vacant housing units - Other vacant (% change since 2000)
Median monthly housing costs ($)
Median household income for houses/condos with a mortgage ($)
Median household income for houses/condos without a mortgage ($)
Median household income ($)
Median household income ($) - White
Median household income ($) - Black or African American
Median household income ($) - Asian
Median household income ($) - Hispanic or Latino
Median household income ($) - American Indian and Alaska Native
Median household income ($) - Multirace
Median household income ($) - Other Race
Mortgage status - with mortgage (%)
Mortgage status - with second mortgage (%)
Mortgage status - with home equity loan (%)
Mortgage status - with both second mortgage and home equity loan (%)
Mortgage status - without a mortgage (%)
Median year house/condo built
Median year apartment built
Household type by relationship - Male householder living alone (%)
Household type by relationship - Male householder not living alone (%)
Household type by relationship - Female householder living alone (%)
Household type by relationship - Female householder not living alone (%)
Household type by relationship - Opposite-Sex spouse (%)
Household type by relationship - Same-Sex spouse (%)
Household type by relationship - Opposite-Sex unmarried partner (%)
Household type by relationship - Same-Sex unmarried partner (%)
Household type by relationship - In group quarters (%)
Size of family households - 2-person household (%)
Size of family households - 3-person household (%)
Size of family households - 4-person household (%)
Size of family households - 5-person household (%)
Size of family households - 6-person household (%)
Size of family households - 7-or-more-person household (%)
Size of nonfamily households - 1-person household (%)
Size of nonfamily households - 2-person household (%)
Size of nonfamily households - 3-person household (%)
Size of nonfamily households - 4-person household (%)
Size of nonfamily households - 5-person household (%)
Size of nonfamily households - 6-person household (%)
Size of nonfamily households - 7-or-moreperson household (%)
Year house built - Built 2010 or later (%)
Year house built - Built 2000 to 2009 (%)
Year house built - Built 1990 to 1999 (%)
Year house built - Built 1980 to 1989 (%)
Year house built - Built 1970 to 1979 (%)
Year house built - Built 1960 to 1969 (%)
Year house built - Built 1950 to 1959 (%)
Year house built - Built 1940 to 1949 (%)
Year house built - Built 1939 or earlier (%)
Median number of rooms in houses and condos
Median number of rooms in apartments
Median number of bedrooms in owner occupied houses
Mean number of bedrooms in owner occupied houses
Median number of bedrooms in renter occupied houses
Mean number of bedrooms in renter occupied houses
Median number of vehichles in owner occupied houses
Mean number of vehichles in owner occupied houses
Median number of vehichles in renter occupied houses
Mean number of vehichles in renter occupied houses
Rooms in owner-occupied houses - 1 room (%)
Rooms in owner-occupied houses - 2 rooms (%)
Rooms in owner-occupied houses - 3 rooms (%)
Rooms in owner-occupied houses - 4 rooms (%)
Rooms in owner-occupied houses - 5 rooms (%)
Rooms in owner-occupied houses - 6 rooms (%)
Rooms in owner-occupied houses - 7 rooms (%)
Rooms in owner-occupied houses - 8 rooms (%)
Rooms in owner-occupied houses - 9+ rooms (%)
Rooms in renter-occupied houses - 1 room (%)
Rooms in renter-occupied houses - 2 rooms (%)
Rooms in renter-occupied houses - 3 rooms (%)
Rooms in renter-occupied houses - 4 rooms (%)
Rooms in renter-occupied houses - 5 rooms (%)
Rooms in renter-occupied houses - 6 rooms (%)
Rooms in renter-occupied houses - 7 rooms (%)
Rooms in renter-occupied houses - 8 rooms (%)
Rooms in renter-occupied houses - 9+ rooms (%)
Bedrooms in owner-occupied houses - no bedrooms (%)
Bedrooms in owner-occupied houses - 1 bedroom (%)
Bedrooms in owner-occupied houses - 2 bedrooms (%)
Bedrooms in owner-occupied houses - 3 bedrooms (%)
Bedrooms in owner-occupied houses - 4 bedrooms (%)
Bedrooms in owner-occupied houses - 5+ bedrooms (%)
Bedrooms in renter-occupied houses - no bedrooms (%)
Bedrooms in renter-occupied houses - 1 bedroom (%)
Bedrooms in renter-occupied houses - 2 bedrooms (%)
Bedrooms in renter-occupied houses - 3 bedrooms (%)
Bedrooms in renter-occupied houses - 4 bedrooms (%)
Bedrooms in renter-occupied houses - 5+ bedrooms (%)
Vehicles available in owner-occupied houses - no vehicle available (%)
Vehicles available in owner-occupied houses - 1 vehicle available(%)
Vehicles available in owner-occupied houses - 2 Vehicles available (%)
Vehicles available in owner-occupied houses - 3 Vehicles available (%)
Vehicles available in owner-occupied houses - 4 Vehicles available (%)
Vehicles available in owner-occupied houses - 5+ Vehicles available (%)
Vehicles available in renter-occupied houses - no vehicle available (%)
Vehicles available in renter-occupied houses - 1 vehicle available (%)
Vehicles available in renter-occupied houses - 2 Vehicles available (%)
Vehicles available in renter-occupied houses - 3 Vehicles available (%)
Vehicles available in renter-occupied houses - 4 Vehicles available (%)
Vehicles available in renter-occupied houses - 5+ Vehicles available (%)
Housing units in structures - 1, detached (%)
Housing units in structures - 1, attached (%)
Housing units in structures - 2 (%)
Housing units in structures - 3 or 4 (%)
Housing units in structures - 5 to 9 (%)
Housing units in structures - 10 to 19 (%)
Housing units in structures - 20 to 49 (%)
Housing units in structures - 50 or more (%)
Housing units in structures - Mobile home (%)
Housing units in structures - Boat, RV, van, etc. (%)
Housing units in structures - Owners - 1, detached (%)
Housing units in structures - Owners - 1, attached (%)
Housing units in structures - Owners - 2 (%)
Housing units in structures - Owners - 3 or 4 (%)
Housing units in structures - Owners - 5 to 9 (%)
Housing units in structures - Owners - 10 to 19 (%)
Housing units in structures - Owners - 20 to 49 (%)
Housing units in structures - Owners - 50 or more (%)
Housing units in structures - Owners - Mobile home (%)
Housing units in structures - Owners - Boat, RV, van, etc. (%)
Housing units in structures - Renters - 1, detached (%)
Housing units in structures - Renters - 1, attached (%)
Housing units in structures - Renters - 2 (%)
Housing units in structures - Renters - 3 or 4 (%)
Housing units in structures - Renters - 5 to 9 (%)
Housing units in structures - Renters - 10 to 19 (%)
Housing units in structures - Renters - 20 to 49 (%)
Housing units in structures - Renters - 50 or more (%)
Housing units in structures - Renters - Mobile home (%)
Housing units in structures - Renters - Boat, RV, van, etc. (%)
House/condo owner moved in on average (years ago)
Renter moved in on average (years ago)
Year householder moved into unit - Moved in 1999 to March 2000 (%)
Year householder moved into unit - Moved in 1999 to March 2000 (%) - White
Year householder moved into unit - Moved in 1999 to March 2000 (%) - Black or African American
Year householder moved into unit - Moved in 1999 to March 2000 (%) - Asian
Year householder moved into unit - Moved in 1999 to March 2000 (%) - Hispanic or Latino
Year householder moved into unit - Moved in 1999 to March 2000 (%) - American Indian and Alaska Native
Year householder moved into unit - Moved in 1999 to March 2000 (%) - Multirace
Year householder moved into unit - Moved in 1999 to March 2000 (%) - Other Race
Year householder moved into unit - Moved in 1995 to 1998 (%)
Year householder moved into unit - Moved in 1995 to 1998 (%) - White
Year householder moved into unit - Moved in 1995 to 1998 (%) - Black or African American
Year householder moved into unit - Moved in 1995 to 1998 (%) - Asian
Year householder moved into unit - Moved in 1995 to 1998 (%) - Hispanic or Latino
Year householder moved into unit - Moved in 1995 to 1998 (%) - American Indian and Alaska Native
Year householder moved into unit - Moved in 1995 to 1998 (%) - Multirace
Year householder moved into unit - Moved in 1995 to 1998 (%) - Other Race
Year householder moved into unit - Moved in 1990 to 1994 (%)
Year householder moved into unit - Moved in 1990 to 1994 (%) - White
Year householder moved into unit - Moved in 1990 to 1994 (%) - Black or African American
Year householder moved into unit - Moved in 1990 to 1994 (%) - Asian
Year householder moved into unit - Moved in 1990 to 1994 (%) - Hispanic or Latino
Year householder moved into unit - Moved in 1990 to 1994 (%) - American Indian and Alaska Native
Year householder moved into unit - Moved in 1990 to 1994 (%) - Multirace
Year householder moved into unit - Moved in 1990 to 1994 (%) - Other Race
Year householder moved into unit - Moved in 1980 to 1989 (%)
Year householder moved into unit - Moved in 1980 to 1989 (%) - White
Year householder moved into unit - Moved in 1980 to 1989 (%) - Black or African American
Year householder moved into unit - Moved in 1980 to 1989 (%) - Asian
Year householder moved into unit - Moved in 1980 to 1989 (%) - Hispanic or Latino
Year householder moved into unit - Moved in 1980 to 1989 (%) - American Indian and Alaska Native
Year householder moved into unit - Moved in 1980 to 1989 (%) - Multirace
Year householder moved into unit - Moved in 1980 to 1989 (%) - Other Race
Year householder moved into unit - Moved in 1970 to 1979 (%)
Year householder moved into unit - Moved in 1970 to 1979 (%) - White
Year householder moved into unit - Moved in 1970 to 1979 (%) - Black or African American
Year householder moved into unit - Moved in 1970 to 1979 (%) - Asian
Year householder moved into unit - Moved in 1970 to 1979 (%) - Hispanic or Latino
Year householder moved into unit - Moved in 1970 to 1979 (%) - American Indian and Alaska Native
Year householder moved into unit - Moved in 1970 to 1979 (%) - Multirace
Year householder moved into unit - Moved in 1970 to 1979 (%) - Other Race
Year householder moved into unit - Moved in 1969 or earlier (%)
Year householder moved into unit - Moved in 1969 or earlier (%) - White
Year householder moved into unit - Moved in 1969 or earlier (%) - Black or African American
Year householder moved into unit - Moved in 1969 or earlier (%) - Asian
Year householder moved into unit - Moved in 1969 or earlier (%) - Hispanic or Latino
Year householder moved into unit - Moved in 1969 or earlier (%) - American Indian and Alaska Native
Year householder moved into unit - Moved in 1969 or earlier (%) - Multirace
Year householder moved into unit - Moved in 1969 or earlier (%) - Other Race
Housing units lacking complete plumbing facilities (%)
Housing units lacking complete kitchen facilities (%)
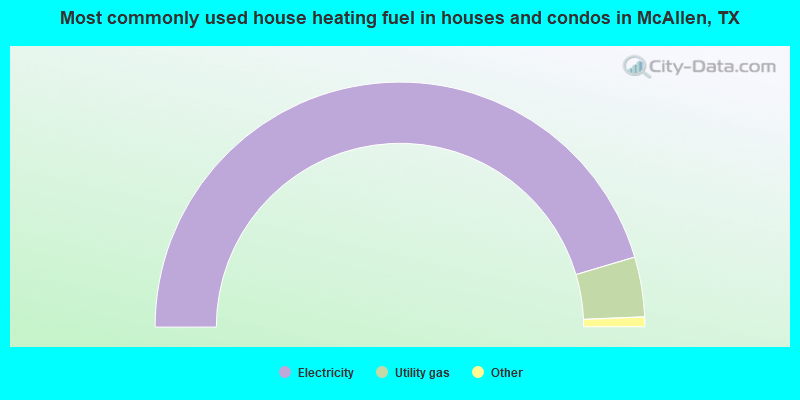
House heating fuel used in houses and condos - Utility gas (%)
House heating fuel used in houses and condos - Bottled, tank, or LP gas (%)
House heating fuel used in houses and condos - Electricity (%)
House heating fuel used in houses and condos - Fuel oil, kerosene, etc. (%)
House heating fuel used in houses and condos - Coal or coke (%)
House heating fuel used in houses and condos - Wood (%)
House heating fuel used in houses and condos - Solar energy (%)
House heating fuel used in houses and condos - Other fuel (%)
House heating fuel used in houses and condos - No fuel used (%)
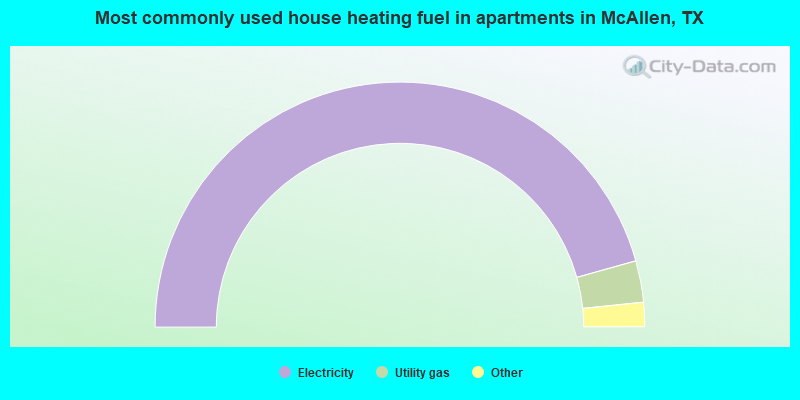
House heating fuel used in apartments - Utility gas (%)
House heating fuel used in apartments - Bottled, tank, or LP gas (%)
House heating fuel used in apartments - Electricity (%)
House heating fuel used in apartments - Fuel oil, kerosene, etc. (%)
House heating fuel used in apartments - Coal or coke (%)
House heating fuel used in apartments - Wood (%)
House heating fuel used in apartments - Solar energy (%)
House heating fuel used in apartments - Other fuel (%)
House heating fuel used in apartments - No fuel used (%)
Latest news about housing in McAllen, TX collected exclusively by city-data.com from local newspapers, TV, and radio stations
Median year house/condo built: 1994Median year apartment built: 1996Household type by relationship:
Households: 144,585
Male householders: 22,707 (4,467 living alone ), Female householders: 26,883 (5,763 living alone )24,677 spouses (23,862 opposite-sex spouses ), 2,506 unmarried partners , (2,239 opposite-sex unmarried partners ), 49,229 children (46,320 natural , 800 adopted , 2,109 stepchildren ), 7,593 grandchildren , 2,324 brothers or sisters , 2,930 parents , 0 foster children , 3,144 other relatives , 1,583 non-relatives In group quarters: 1,009
Size of family households: 12,908 2-persons , 8,977 3-persons , 7,449 4-persons , 4,899 5-persons , 1,324 6-persons , 1,350 7-or-more-persons .
Size of nonfamily households: 10,230 1-person , 2,303 2-persons , 101 3-persons , 49 6-persons .
21,873 married couples with children. single-parent households (1,999 men , 6,950 women ).
25.3% of residents of McAllen speak English at home. of residents speak Spanish at home (62% speak English very well , 17% speak English well , 10% speak English not well , 11% don't speak English at all ).of residents speak other Indo-European language at home (80% speak English very well , 18% speak English well , 2% speak English not well ).of residents speak Asian or Pacific Island language at home (71% speak English very well , 18% speak English well , 11% speak English not well ).of residents speak other language at home (50% speak English very well , 31% speak English well , 13% speak English not well , 6% don't speak English at all ).
Foreign born population: 34,336 (23.7%)of them are naturalized citizens )
Median number of rooms in houses and condos:
Median number of rooms in apartments
Owner-occupied Renter-occupied
Bedrooms in owner-occupied houses and condos in McAllen, Texas
958 no bedroom 294 1 bedroom 3,723 2 bedrooms 16,236 3 bedrooms 7,337 4 bedrooms 2,056 5+ bedrooms
Bedrooms in renter-occupied apartments in McAllen, Texas
1,127 no bedroom 4,747 1 bedroom 6,129 2 bedrooms 5,529 3 bedrooms 1,402 4 bedrooms 52 5+ bedrooms
Owner-occupied Renter-occupied
Rooms in owner-occupied houses in McAllen, Texas
712 1 room 153 2 rooms 508 3 rooms 3,649 4 rooms 8,445 5 rooms 6,525 6 rooms 4,393 7 rooms 2,607 8 rooms 3,612 9+ rooms
Rooms in renter-occupied apartments in McAllen, Texas
924 1 room 1,807 2 rooms 4,664 3 rooms 4,828 4 rooms 3,079 5 rooms 1,889 6 rooms 1,282 7 rooms 256 8 rooms 257 9+ rooms
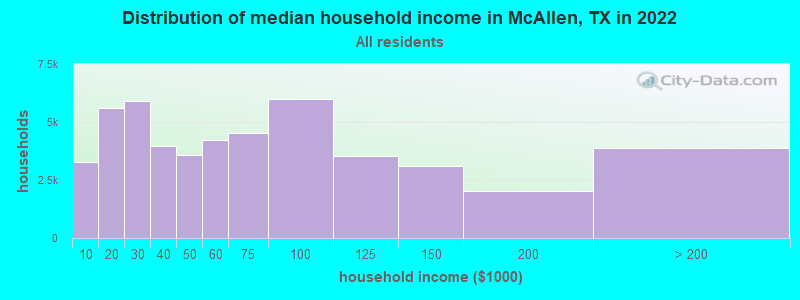
McAllen, TX household income distribution 3,274 Less than $10,0005,615 $10,000 to $19,9995,922 $20,000 to $29,9993,958 $30,000 to $39,9993,570 $40,000 to $49,9994,243 $50,000 to $59,9994,507 $60,000 to $74,9996,007 $75,000 to $99,9993,513 $100,000 to $124,9993,094 $125,000 to $149,9992,026 $150,000 to $199,9993,861 $200,000 or more
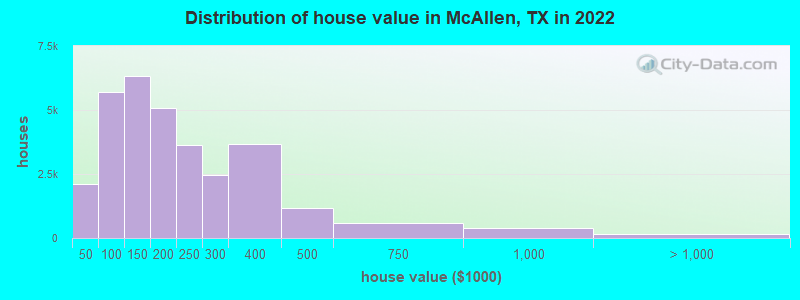
Home value of owner - occupied houses in 2022 in McAllen, TX 326 Less than $10,00037 $10,000 to $14,999165 $15,000 to $19,999351 $20,000 to $24,999228 $25,000 to $29,999118 $30,000 to $34,999189 $35,000 to $39,999687 $40,000 to $49,999527 $50,000 to $59,999659 $60,000 to $69,9991,136 $70,000 to $79,999832 $80,000 to $89,9991,846 $90,000 to $99,9992,551 $100,000 to $124,9993,772 $125,000 to $149,9992,569 $150,000 to $174,9992,526 $175,000 to $199,9993,650 $200,000 to $249,9992,478 $250,000 to $299,9993,686 $300,000 to $399,9991,173 $400,000 to $499,999584 $500,000 to $749,999375 $750,000 to $999,99989 $1,000,000 to $1,499,99950 $2,000,000 or moreRent paid by renters in 2022 in McAllen, TX 246 Less than $100329 $100 to $149444 $150 to $199292 $250 to $299554 $300 to $349204 $350 to $399159 $400 to $449561 $450 to $499878 $500 to $5491,007 $550 to $599945 $600 to $6491,159 $650 to $699396 $700 to $7491,431 $750 to $7993,108 $800 to $8991,271 $900 to $9993,264 $1,000 to $1,249789 $1,250 to $1,499707 $1,500 to $1,999283 $2,000 to $2,499959 No cash rent
Percentage of workers working in this county: 92.3%Number of people working at home: 9,116 (14.5% of all workers )
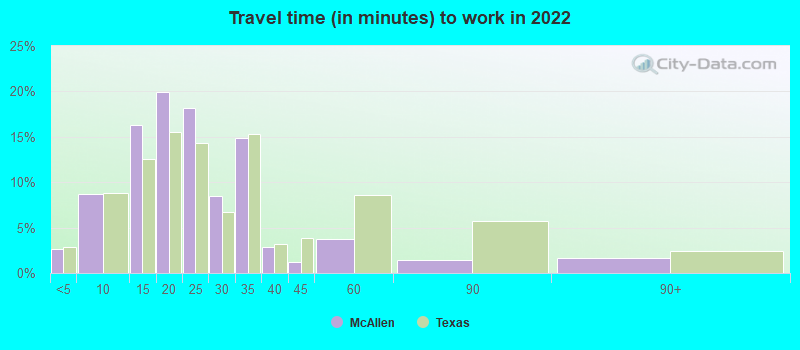
Travel time to work (commute)
Less than 5 minutes: 2,2265 to 9 minutes: 5,94010 to 14 minutes: 8,54815 to 19 minutes: 12,29220 to 24 minutes: 10,39425 to 29 minutes: 3,14030 to 34 minutes: 5,85335 to 39 minutes: 53640 to 44 minutes: 76245 to 59 minutes: 1,57260 to 89 minutes: 1,07190 or more minutes: 1,423
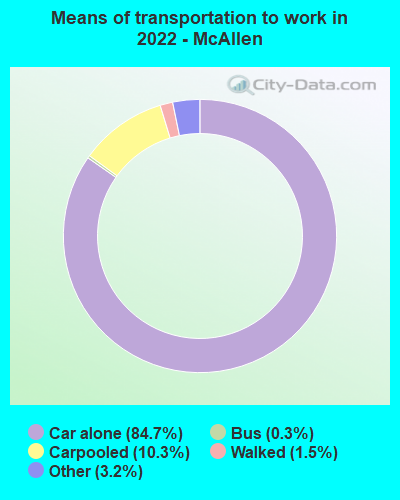
Means of transportation to work:
Drove a car alone: 72,641 (76.6%)Carpooled: 8,826 (9.3%)Bus : 220 (0.2%)Taxi: 2,743 (2.9%)Bicycle: 28 (0.0%)Walked: 1,267 (1.3%)Worked at home: 9,116 (9.6%)
Unemployment by race in 2022
Unemployment rate for White non-Hispanic residents 4.2% Males5.2% FemalesUnemployment rate for other race residents 6.9% Males2.8% FemalesUnemployment rate for two or more race residents 6.0% Males4.8% FemalesUnemployment rate for Hispanic or Latino residents 5.0% Males2.7% Females
Year of entry for the foreign-born population in McAllen, Texas
11,805 2010 or later 8,555 2000 to 2009 6,109 1990 to 1999 7,552 1980 to 1989 5,452 1970 to 1979 5,409 Before 1970
First ancestries reported:
American: 2,776 (2.5%)
English: 1,472 (1.3%)
German: 877 (0.8%)
Italian: 505 (0.5%)
Irish: 494 (0.4%)
Polish: 226 (0.2%)
French: 167 (0.1%)
Nigerian: 106 (0.09%)
European: 90 (0.08%)
Lebanese: 76 (0.07%)
Canadian: 61 (0.05%)
Russian: 52 (0.05%)
Arab: 50 (0.04%)
Scottish: 41 (0.04%)
Iranian: 36 (0.03%)
Scotch-Irish: 35 (0.03%)
Eastern European: 30 (0.03%)
Danish: 29 (0.03%)
Ukrainian: 28 (0.03%)
Hungarian: 26 (0.02%)
Romanian: 26 (0.02%)
Czechoslovakian: 24 (0.02%)
Swedish: 24 (0.02%)
Portuguese: 22 (0.02%)
Australian: 21 (0.02%)
French Canadian: 21 (0.02%)
Brazilian: 17 (0.02%)
Yugoslavian: 15 (0.01%)
Syrian: 14 (0.01%)
Czech: 14 (0.01%)
Austrian: 13 (0.01%)
Dutch: 13 (0.01%)
Scandinavian: 9 (0.01%)
Carpatho Rusyn: 8 (0.01%)
British: 6 (0.01%)
Welsh: 6 (0.01%) Most common places of birth for foreign-born residents (%): Mexico McAllen:
84.1% (31,483)Texas:
48.4% (2,411,723)
Philippines McAllen:
3.4% (1,291)Texas:
2.1% (103,148)
Place of birth for U.S.-born residents:
This state: 92,670Other state: 15,821Northeast: 1,037Midwest: 6,078South: 3,468West: 5,238 87.6% of McAllen residents lived in the same house 1 years ago.
Out of people who lived in different houses, 45.7% lived in this county.
Out of people who lived in different counties, 56.0% lived in Texas.
McAllen:
87.6%State average:
85.7%
Education attainment for males 25 years and older:
No schooling: 1,010Nursery to 4th grade: 3865th and 6th grade: 1,8827th and 8th grade: 6099th grade: 1,48810th grade: 83211th grade: 70312th grade, no diploma: 394High school graduate (or equivalency): 8,789Less than 1 year of college: 2,008Some college more than 1 year, no degree: 8,366Associate degree: 2,086Bachelor's degree: 9,828Master's degree: 4,101Professional school degree: 1,999Doctorate degree: 441
Education attainment for females 25 years and older:
No schooling: 1,819Nursery to 4th grade: 1,0005th and 6th grade: 1,9887th and 8th grade: 1,0279th grade: 1,61010th grade: 99011th grade: 61812th grade, no diploma: 997High school graduate (or equivalency): 10,793Less than 1 year of college: 3,505Some college more than 1 year, no degree: 6,330Associate degree: 2,524Bachelor's degree: 9,244Master's degree: 4,061Professional school degree: 1,493Doctorate degree: 266
Housing units in structures:
One, detached: 37,012One, attached: 1,988Two: 2,0093 or 4: 4,0215 to 9: 2,66910 to 19: 2,25520 to 49: 2,88050 or more: 1,218Mobile homes: 2,222Boats, RVs, vans, etc.: 137Median worth of mobile homes: $78,800
Housing units lacking complete plumbing facilities in 2022: 4.2%Housing units lacking complete kitchen facilities in 2022: 1.4%House/condo owner moved in on average 13 years ago
Renter moved in on average 2 years ago
Private vs. public school enrollment:
Students in private schools in grades 1 to 8 (elementary and middle school): 641 Students in private schools in grades 9 to 12 (high school): 197 Students in private undergraduate colleges: 1,681