McAllen, Texas Submit your own pictures of this city and show them to the world
OSM Map
General Map
Google Map
MSN Map
OSM Map
General Map
Google Map
MSN Map
OSM Map
General Map
Google Map
MSN Map
OSM Map
General Map
Google Map
MSN Map
Please wait while loading the map...
Population in 2022: 144,579 (100% urban, 0% rural). Population change since 2000: +35.9%Males: 72,609 Females: 71,970
March 2022 cost of living index in McAllen: 81.3 (low, U.S. average is 100) Percentage of residents living in poverty in 2022: 20.8%for White Non-Hispanic residents , 19.1% for Black residents , 22.1% for Hispanic or Latino residents , 29.5% for American Indian residents , 29.1% for other race residents , 17.2% for two or more races residents )
Profiles of local businesses
Business Search - 14 Million verified businesses
Data:
Median household income ($)
Median household income (% change since 2000)
Household income diversity
Ratio of average income to average house value (%)
Ratio of average income to average rent
Median household income ($) - White
Median household income ($) - Black or African American
Median household income ($) - Asian
Median household income ($) - Hispanic or Latino
Median household income ($) - American Indian and Alaska Native
Median household income ($) - Multirace
Median household income ($) - Other Race
Median household income for houses/condos with a mortgage ($)
Median household income for apartments without a mortgage ($)
Races - White alone (%)
Races - White alone (% change since 2000)
Races - Black alone (%)
Races - Black alone (% change since 2000)
Races - American Indian alone (%)
Races - American Indian alone (% change since 2000)
Races - Asian alone (%)
Races - Asian alone (% change since 2000)
Races - Hispanic (%)
Races - Hispanic (% change since 2000)
Races - Native Hawaiian and Other Pacific Islander alone (%)
Races - Native Hawaiian and Other Pacific Islander alone (% change since 2000)
Races - Two or more races (%)
Races - Two or more races (% change since 2000)
Races - Other race alone (%)
Races - Other race alone (% change since 2000)
Racial diversity
Unemployment (%)
Unemployment (% change since 2000)
Unemployment (%) - White
Unemployment (%) - Black or African American
Unemployment (%) - Asian
Unemployment (%) - Hispanic or Latino
Unemployment (%) - American Indian and Alaska Native
Unemployment (%) - Multirace
Unemployment (%) - Other Race
Population density (people per square mile)
Population - Males (%)
Population - Females (%)
Population - Males (%) - White
Population - Males (%) - Black or African American
Population - Males (%) - Asian
Population - Males (%) - Hispanic or Latino
Population - Males (%) - American Indian and Alaska Native
Population - Males (%) - Multirace
Population - Males (%) - Other Race
Population - Females (%) - White
Population - Females (%) - Black or African American
Population - Females (%) - Asian
Population - Females (%) - Hispanic or Latino
Population - Females (%) - American Indian and Alaska Native
Population - Females (%) - Multirace
Population - Females (%) - Other Race
Coronavirus confirmed cases (Apr 26, 2024)
Deaths caused by coronavirus (Apr 26, 2024)
Coronavirus confirmed cases (per 100k population) (Apr 26, 2024)
Deaths caused by coronavirus (per 100k population) (Apr 26, 2024)
Daily increase in number of cases (Apr 26, 2024)
Weekly increase in number of cases (Apr 26, 2024)
Cases doubled (in days) (Apr 26, 2024)
Hospitalized patients (Apr 18, 2022)
Negative test results (Apr 18, 2022)
Total test results (Apr 18, 2022)
COVID Vaccine doses distributed (per 100k population) (Sep 19, 2023)
COVID Vaccine doses administered (per 100k population) (Sep 19, 2023)
COVID Vaccine doses distributed (Sep 19, 2023)
COVID Vaccine doses administered (Sep 19, 2023)
Likely homosexual households (%)
Likely homosexual households (% change since 2000)
Likely homosexual households - Lesbian couples (%)
Likely homosexual households - Lesbian couples (% change since 2000)
Likely homosexual households - Gay men (%)
Likely homosexual households - Gay men (% change since 2000)
Cost of living index
Median gross rent ($)
Median contract rent ($)
Median monthly housing costs ($)
Median house or condo value ($)
Median house or condo value ($ change since 2000)
Mean house or condo value by units in structure - 1, detached ($)
Mean house or condo value by units in structure - 1, attached ($)
Mean house or condo value by units in structure - 2 ($)
Mean house or condo value by units in structure by units in structure - 3 or 4 ($)
Mean house or condo value by units in structure - 5 or more ($)
Mean house or condo value by units in structure - Boat, RV, van, etc. ($)
Mean house or condo value by units in structure - Mobile home ($)
Median house or condo value ($) - White
Median house or condo value ($) - Black or African American
Median house or condo value ($) - Asian
Median house or condo value ($) - Hispanic or Latino
Median house or condo value ($) - American Indian and Alaska Native
Median house or condo value ($) - Multirace
Median house or condo value ($) - Other Race
Median resident age
Resident age diversity
Median resident age - Males
Median resident age - Females
Median resident age - White
Median resident age - Black or African American
Median resident age - Asian
Median resident age - Hispanic or Latino
Median resident age - American Indian and Alaska Native
Median resident age - Multirace
Median resident age - Other Race
Median resident age - Males - White
Median resident age - Males - Black or African American
Median resident age - Males - Asian
Median resident age - Males - Hispanic or Latino
Median resident age - Males - American Indian and Alaska Native
Median resident age - Males - Multirace
Median resident age - Males - Other Race
Median resident age - Females - White
Median resident age - Females - Black or African American
Median resident age - Females - Asian
Median resident age - Females - Hispanic or Latino
Median resident age - Females - American Indian and Alaska Native
Median resident age - Females - Multirace
Median resident age - Females - Other Race
Commute - mean travel time to work (minutes)
Travel time to work - Less than 5 minutes (%)
Travel time to work - Less than 5 minutes (% change since 2000)
Travel time to work - 5 to 9 minutes (%)
Travel time to work - 5 to 9 minutes (% change since 2000)
Travel time to work - 10 to 19 minutes (%)
Travel time to work - 10 to 19 minutes (% change since 2000)
Travel time to work - 20 to 29 minutes (%)
Travel time to work - 20 to 29 minutes (% change since 2000)
Travel time to work - 30 to 39 minutes (%)
Travel time to work - 30 to 39 minutes (% change since 2000)
Travel time to work - 40 to 59 minutes (%)
Travel time to work - 40 to 59 minutes (% change since 2000)
Travel time to work - 60 to 89 minutes (%)
Travel time to work - 60 to 89 minutes (% change since 2000)
Travel time to work - 90 or more minutes (%)
Travel time to work - 90 or more minutes (% change since 2000)
Marital status - Never married (%)
Marital status - Now married (%)
Marital status - Separated (%)
Marital status - Widowed (%)
Marital status - Divorced (%)
Median family income ($)
Median family income (% change since 2000)
Median non-family income ($)
Median non-family income (% change since 2000)
Median per capita income ($)
Median per capita income (% change since 2000)
Median family income ($) - White
Median family income ($) - Black or African American
Median family income ($) - Asian
Median family income ($) - Hispanic or Latino
Median family income ($) - American Indian and Alaska Native
Median family income ($) - Multirace
Median family income ($) - Other Race
Median year house/condo built
Median year apartment built
Year house built - Built 2005 or later (%)
Year house built - Built 2000 to 2004 (%)
Year house built - Built 1990 to 1999 (%)
Year house built - Built 1980 to 1989 (%)
Year house built - Built 1970 to 1979 (%)
Year house built - Built 1960 to 1969 (%)
Year house built - Built 1950 to 1959 (%)
Year house built - Built 1940 to 1949 (%)
Year house built - Built 1939 or earlier (%)
Average household size
Household density (households per square mile)
Average household size - White
Average household size - Black or African American
Average household size - Asian
Average household size - Hispanic or Latino
Average household size - American Indian and Alaska Native
Average household size - Multirace
Average household size - Other Race
Occupied housing units (%)
Vacant housing units (%)
Owner occupied housing units (%)
Renter occupied housing units (%)
Vacancy status - For rent (%)
Vacancy status - For sale only (%)
Vacancy status - Rented or sold, not occupied (%)
Vacancy status - For seasonal, recreational, or occasional use (%)
Vacancy status - For migrant workers (%)
Vacancy status - Other vacant (%)
Residents with income below the poverty level (%)
Residents with income below 50% of the poverty level (%)
Children below poverty level (%)
Poor families by family type - Married-couple family (%)
Poor families by family type - Male, no wife present (%)
Poor families by family type - Female, no husband present (%)
Poverty status for native-born residents (%)
Poverty status for foreign-born residents (%)
Poverty among high school graduates not in families (%)
Poverty among people who did not graduate high school not in families (%)
Residents with income below the poverty level (%) - White
Residents with income below the poverty level (%) - Black or African American
Residents with income below the poverty level (%) - Asian
Residents with income below the poverty level (%) - Hispanic or Latino
Residents with income below the poverty level (%) - American Indian and Alaska Native
Residents with income below the poverty level (%) - Multirace
Residents with income below the poverty level (%) - Other Race
Air pollution - Air Quality Index (AQI)
Air pollution - CO
Air pollution - NO2
Air pollution - SO2
Air pollution - Ozone
Air pollution - PM10
Air pollution - PM25
Air pollution - Pb
Crime - Murders per 100,000 population
Crime - Rapes per 100,000 population
Crime - Robberies per 100,000 population
Crime - Assaults per 100,000 population
Crime - Burglaries per 100,000 population
Crime - Thefts per 100,000 population
Crime - Auto thefts per 100,000 population
Crime - Arson per 100,000 population
Crime - City-data.com crime index
Crime - Violent crime index
Crime - Property crime index
Crime - Murders per 100,000 population (5 year average)
Crime - Rapes per 100,000 population (5 year average)
Crime - Robberies per 100,000 population (5 year average)
Crime - Assaults per 100,000 population (5 year average)
Crime - Burglaries per 100,000 population (5 year average)
Crime - Thefts per 100,000 population (5 year average)
Crime - Auto thefts per 100,000 population (5 year average)
Crime - Arson per 100,000 population (5 year average)
Crime - City-data.com crime index (5 year average)
Crime - Violent crime index (5 year average)
Crime - Property crime index (5 year average)
1996 Presidential Elections Results (%) - Democratic Party (Clinton)
1996 Presidential Elections Results (%) - Republican Party (Dole)
1996 Presidential Elections Results (%) - Other
2000 Presidential Elections Results (%) - Democratic Party (Gore)
2000 Presidential Elections Results (%) - Republican Party (Bush)
2000 Presidential Elections Results (%) - Other
2004 Presidential Elections Results (%) - Democratic Party (Kerry)
2004 Presidential Elections Results (%) - Republican Party (Bush)
2004 Presidential Elections Results (%) - Other
2008 Presidential Elections Results (%) - Democratic Party (Obama)
2008 Presidential Elections Results (%) - Republican Party (McCain)
2008 Presidential Elections Results (%) - Other
2012 Presidential Elections Results (%) - Democratic Party (Obama)
2012 Presidential Elections Results (%) - Republican Party (Romney)
2012 Presidential Elections Results (%) - Other
2016 Presidential Elections Results (%) - Democratic Party (Clinton)
2016 Presidential Elections Results (%) - Republican Party (Trump)
2016 Presidential Elections Results (%) - Other
2020 Presidential Elections Results (%) - Democratic Party (Biden)
2020 Presidential Elections Results (%) - Republican Party (Trump)
2020 Presidential Elections Results (%) - Other
Ancestries Reported - Arab (%)
Ancestries Reported - Czech (%)
Ancestries Reported - Danish (%)
Ancestries Reported - Dutch (%)
Ancestries Reported - English (%)
Ancestries Reported - French (%)
Ancestries Reported - French Canadian (%)
Ancestries Reported - German (%)
Ancestries Reported - Greek (%)
Ancestries Reported - Hungarian (%)
Ancestries Reported - Irish (%)
Ancestries Reported - Italian (%)
Ancestries Reported - Lithuanian (%)
Ancestries Reported - Norwegian (%)
Ancestries Reported - Polish (%)
Ancestries Reported - Portuguese (%)
Ancestries Reported - Russian (%)
Ancestries Reported - Scotch-Irish (%)
Ancestries Reported - Scottish (%)
Ancestries Reported - Slovak (%)
Ancestries Reported - Subsaharan African (%)
Ancestries Reported - Swedish (%)
Ancestries Reported - Swiss (%)
Ancestries Reported - Ukrainian (%)
Ancestries Reported - United States (%)
Ancestries Reported - Welsh (%)
Ancestries Reported - West Indian (%)
Ancestries Reported - Other (%)
Educational Attainment - No schooling completed (%)
Educational Attainment - Less than high school (%)
Educational Attainment - High school or equivalent (%)
Educational Attainment - Less than 1 year of college (%)
Educational Attainment - 1 or more years of college (%)
Educational Attainment - Associate degree (%)
Educational Attainment - Bachelor's degree (%)
Educational Attainment - Master's degree (%)
Educational Attainment - Professional school degree (%)
Educational Attainment - Doctorate degree (%)
School Enrollment - Nursery, preschool (%)
School Enrollment - Kindergarten (%)
School Enrollment - Grade 1 to 4 (%)
School Enrollment - Grade 5 to 8 (%)
School Enrollment - Grade 9 to 12 (%)
School Enrollment - College undergrad (%)
School Enrollment - Graduate or professional (%)
School Enrollment - Not enrolled in school (%)
School enrollment - Public schools (%)
School enrollment - Private schools (%)
School enrollment - Not enrolled (%)
Median number of rooms in houses and condos
Median number of rooms in apartments
Housing units lacking complete plumbing facilities (%)
Housing units lacking complete kitchen facilities (%)
Density of houses
Urban houses (%)
Rural houses (%)
Households with people 60 years and over (%)
Households with people 65 years and over (%)
Households with people 75 years and over (%)
Households with one or more nonrelatives (%)
Households with no nonrelatives (%)
Population in households (%)
Family households (%)
Nonfamily households (%)
Population in families (%)
Family households with own children (%)
Median number of bedrooms in owner occupied houses
Mean number of bedrooms in owner occupied houses
Median number of bedrooms in renter occupied houses
Mean number of bedrooms in renter occupied houses
Median number of vehichles in owner occupied houses
Mean number of vehichles in owner occupied houses
Median number of vehichles in renter occupied houses
Mean number of vehichles in renter occupied houses
Mortgage status - with mortgage (%)
Mortgage status - with second mortgage (%)
Mortgage status - with home equity loan (%)
Mortgage status - with both second mortgage and home equity loan (%)
Mortgage status - without a mortgage (%)
Average family size
Average family size - White
Average family size - Black or African American
Average family size - Asian
Average family size - Hispanic or Latino
Average family size - American Indian and Alaska Native
Average family size - Multirace
Average family size - Other Race
Geographical mobility - Same house 1 year ago (%)
Geographical mobility - Moved within same county (%)
Geographical mobility - Moved from different county within same state (%)
Geographical mobility - Moved from different state (%)
Geographical mobility - Moved from abroad (%)
Place of birth - Born in state of residence (%)
Place of birth - Born in other state (%)
Place of birth - Native, outside of US (%)
Place of birth - Foreign born (%)
Housing units in structures - 1, detached (%)
Housing units in structures - 1, attached (%)
Housing units in structures - 2 (%)
Housing units in structures - 3 or 4 (%)
Housing units in structures - 5 to 9 (%)
Housing units in structures - 10 to 19 (%)
Housing units in structures - 20 to 49 (%)
Housing units in structures - 50 or more (%)
Housing units in structures - Mobile home (%)
Housing units in structures - Boat, RV, van, etc. (%)
House/condo owner moved in on average (years ago)
Renter moved in on average (years ago)
Year householder moved into unit - Moved in 1999 to March 2000 (%)
Year householder moved into unit - Moved in 1995 to 1998 (%)
Year householder moved into unit - Moved in 1990 to 1994 (%)
Year householder moved into unit - Moved in 1980 to 1989 (%)
Year householder moved into unit - Moved in 1970 to 1979 (%)
Year householder moved into unit - Moved in 1969 or earlier (%)
Means of transportation to work - Drove car alone (%)
Means of transportation to work - Carpooled (%)
Means of transportation to work - Public transportation (%)
Means of transportation to work - Bus or trolley bus (%)
Means of transportation to work - Streetcar or trolley car (%)
Means of transportation to work - Subway or elevated (%)
Means of transportation to work - Railroad (%)
Means of transportation to work - Ferryboat (%)
Means of transportation to work - Taxicab (%)
Means of transportation to work - Motorcycle (%)
Means of transportation to work - Bicycle (%)
Means of transportation to work - Walked (%)
Means of transportation to work - Other means (%)
Working at home (%)
Industry diversity
Most Common Industries - Agriculture, forestry, fishing and hunting, and mining (%)
Most Common Industries - Agriculture, forestry, fishing and hunting (%)
Most Common Industries - Mining, quarrying, and oil and gas extraction (%)
Most Common Industries - Construction (%)
Most Common Industries - Manufacturing (%)
Most Common Industries - Wholesale trade (%)
Most Common Industries - Retail trade (%)
Most Common Industries - Transportation and warehousing, and utilities (%)
Most Common Industries - Transportation and warehousing (%)
Most Common Industries - Utilities (%)
Most Common Industries - Information (%)
Most Common Industries - Finance and insurance, and real estate and rental and leasing (%)
Most Common Industries - Finance and insurance (%)
Most Common Industries - Real estate and rental and leasing (%)
Most Common Industries - Professional, scientific, and management, and administrative and waste management services (%)
Most Common Industries - Professional, scientific, and technical services (%)
Most Common Industries - Management of companies and enterprises (%)
Most Common Industries - Administrative and support and waste management services (%)
Most Common Industries - Educational services, and health care and social assistance (%)
Most Common Industries - Educational services (%)
Most Common Industries - Health care and social assistance (%)
Most Common Industries - Arts, entertainment, and recreation, and accommodation and food services (%)
Most Common Industries - Arts, entertainment, and recreation (%)
Most Common Industries - Accommodation and food services (%)
Most Common Industries - Other services, except public administration (%)
Most Common Industries - Public administration (%)
Occupation diversity
Most Common Occupations - Management, business, science, and arts occupations (%)
Most Common Occupations - Management, business, and financial occupations (%)
Most Common Occupations - Management occupations (%)
Most Common Occupations - Business and financial operations occupations (%)
Most Common Occupations - Computer, engineering, and science occupations (%)
Most Common Occupations - Computer and mathematical occupations (%)
Most Common Occupations - Architecture and engineering occupations (%)
Most Common Occupations - Life, physical, and social science occupations (%)
Most Common Occupations - Education, legal, community service, arts, and media occupations (%)
Most Common Occupations - Community and social service occupations (%)
Most Common Occupations - Legal occupations (%)
Most Common Occupations - Education, training, and library occupations (%)
Most Common Occupations - Arts, design, entertainment, sports, and media occupations (%)
Most Common Occupations - Healthcare practitioners and technical occupations (%)
Most Common Occupations - Health diagnosing and treating practitioners and other technical occupations (%)
Most Common Occupations - Health technologists and technicians (%)
Most Common Occupations - Service occupations (%)
Most Common Occupations - Healthcare support occupations (%)
Most Common Occupations - Protective service occupations (%)
Most Common Occupations - Fire fighting and prevention, and other protective service workers including supervisors (%)
Most Common Occupations - Law enforcement workers including supervisors (%)
Most Common Occupations - Food preparation and serving related occupations (%)
Most Common Occupations - Building and grounds cleaning and maintenance occupations (%)
Most Common Occupations - Personal care and service occupations (%)
Most Common Occupations - Sales and office occupations (%)
Most Common Occupations - Sales and related occupations (%)
Most Common Occupations - Office and administrative support occupations (%)
Most Common Occupations - Natural resources, construction, and maintenance occupations (%)
Most Common Occupations - Farming, fishing, and forestry occupations (%)
Most Common Occupations - Construction and extraction occupations (%)
Most Common Occupations - Installation, maintenance, and repair occupations (%)
Most Common Occupations - Production, transportation, and material moving occupations (%)
Most Common Occupations - Production occupations (%)
Most Common Occupations - Transportation occupations (%)
Most Common Occupations - Material moving occupations (%)
People in Group quarters - Institutionalized population (%)
People in Group quarters - Correctional institutions (%)
People in Group quarters - Federal prisons and detention centers (%)
People in Group quarters - Halfway houses (%)
People in Group quarters - Local jails and other confinement facilities (including police lockups) (%)
People in Group quarters - Military disciplinary barracks (%)
People in Group quarters - State prisons (%)
People in Group quarters - Other types of correctional institutions (%)
People in Group quarters - Nursing homes (%)
People in Group quarters - Hospitals/wards, hospices, and schools for the handicapped (%)
People in Group quarters - Hospitals/wards and hospices for chronically ill (%)
People in Group quarters - Hospices or homes for chronically ill (%)
People in Group quarters - Military hospitals or wards for chronically ill (%)
People in Group quarters - Other hospitals or wards for chronically ill (%)
People in Group quarters - Hospitals or wards for drug/alcohol abuse (%)
People in Group quarters - Mental (Psychiatric) hospitals or wards (%)
People in Group quarters - Schools, hospitals, or wards for the mentally retarded (%)
People in Group quarters - Schools, hospitals, or wards for the physically handicapped (%)
People in Group quarters - Institutions for the deaf (%)
People in Group quarters - Institutions for the blind (%)
People in Group quarters - Orthopedic wards and institutions for the physically handicapped (%)
People in Group quarters - Wards in general hospitals for patients who have no usual home elsewhere (%)
People in Group quarters - Wards in military hospitals for patients who have no usual home elsewhere (%)
People in Group quarters - Juvenile institutions (%)
People in Group quarters - Long-term care (%)
People in Group quarters - Homes for abused, dependent, and neglected children (%)
People in Group quarters - Residential treatment centers for emotionally disturbed children (%)
People in Group quarters - Training schools for juvenile delinquents (%)
People in Group quarters - Short-term care, detention or diagnostic centers for delinquent children (%)
People in Group quarters - Type of juvenile institution unknown (%)
People in Group quarters - Noninstitutionalized population (%)
People in Group quarters - College dormitories (includes college quarters off campus) (%)
People in Group quarters - Military quarters (%)
People in Group quarters - On base (%)
People in Group quarters - Barracks, unaccompanied personnel housing (UPH), (Enlisted/Officer), ;and similar group living quarters for military personnel (%)
People in Group quarters - Transient quarters for temporary residents (%)
People in Group quarters - Military ships (%)
People in Group quarters - Group homes (%)
People in Group quarters - Homes or halfway houses for drug/alcohol abuse (%)
People in Group quarters - Homes for the mentally ill (%)
People in Group quarters - Homes for the mentally retarded (%)
People in Group quarters - Homes for the physically handicapped (%)
People in Group quarters - Other group homes (%)
People in Group quarters - Religious group quarters (%)
People in Group quarters - Dormitories (%)
People in Group quarters - Agriculture workers' dormitories on farms (%)
People in Group quarters - Job Corps and vocational training facilities (%)
People in Group quarters - Other workers' dormitories (%)
People in Group quarters - Crews of maritime vessels (%)
People in Group quarters - Other nonhousehold living situations (%)
People in Group quarters - Other noninstitutional group quarters (%)
Residents speaking English at home (%)
Residents speaking English at home - Born in the United States (%)
Residents speaking English at home - Native, born elsewhere (%)
Residents speaking English at home - Foreign born (%)
Residents speaking Spanish at home (%)
Residents speaking Spanish at home - Born in the United States (%)
Residents speaking Spanish at home - Native, born elsewhere (%)
Residents speaking Spanish at home - Foreign born (%)
Residents speaking other language at home (%)
Residents speaking other language at home - Born in the United States (%)
Residents speaking other language at home - Native, born elsewhere (%)
Residents speaking other language at home - Foreign born (%)
Class of Workers - Employee of private company (%)
Class of Workers - Self-employed in own incorporated business (%)
Class of Workers - Private not-for-profit wage and salary workers (%)
Class of Workers - Local government workers (%)
Class of Workers - State government workers (%)
Class of Workers - Federal government workers (%)
Class of Workers - Self-employed workers in own not incorporated business and Unpaid family workers (%)
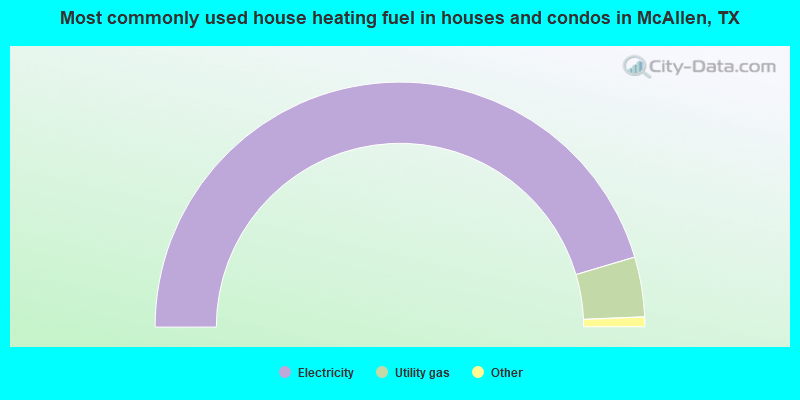
House heating fuel used in houses and condos - Utility gas (%)
House heating fuel used in houses and condos - Bottled, tank, or LP gas (%)
House heating fuel used in houses and condos - Electricity (%)
House heating fuel used in houses and condos - Fuel oil, kerosene, etc. (%)
House heating fuel used in houses and condos - Coal or coke (%)
House heating fuel used in houses and condos - Wood (%)
House heating fuel used in houses and condos - Solar energy (%)
House heating fuel used in houses and condos - Other fuel (%)
House heating fuel used in houses and condos - No fuel used (%)
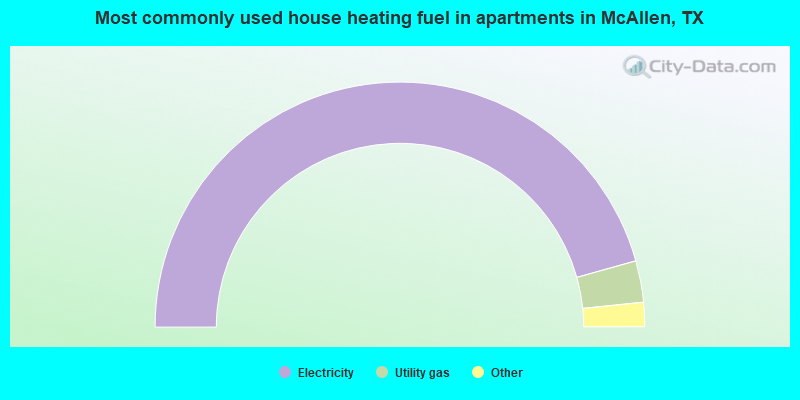
House heating fuel used in apartments - Utility gas (%)
House heating fuel used in apartments - Bottled, tank, or LP gas (%)
House heating fuel used in apartments - Electricity (%)
House heating fuel used in apartments - Fuel oil, kerosene, etc. (%)
House heating fuel used in apartments - Coal or coke (%)
House heating fuel used in apartments - Wood (%)
House heating fuel used in apartments - Solar energy (%)
House heating fuel used in apartments - Other fuel (%)
House heating fuel used in apartments - No fuel used (%)
Armed forces status - In Armed Forces (%)
Armed forces status - Civilian (%)
Armed forces status - Civilian - Veteran (%)
Armed forces status - Civilian - Nonveteran (%)
Fatal accidents locations in years 2005-2021
Fatal accidents locations in 2005
Fatal accidents locations in 2006
Fatal accidents locations in 2007
Fatal accidents locations in 2008
Fatal accidents locations in 2009
Fatal accidents locations in 2010
Fatal accidents locations in 2011
Fatal accidents locations in 2012
Fatal accidents locations in 2013
Fatal accidents locations in 2014
Fatal accidents locations in 2015
Fatal accidents locations in 2016
Fatal accidents locations in 2017
Fatal accidents locations in 2018
Fatal accidents locations in 2019
Fatal accidents locations in 2020
Fatal accidents locations in 2021
Alcohol use - People drinking some alcohol every month (%)
Alcohol use - People not drinking at all (%)
Alcohol use - Average days/month drinking alcohol
Alcohol use - Average drinks/week
Alcohol use - Average days/year people drink much
Audiometry - Average condition of hearing (%)
Audiometry - People that can hear a whisper from across a quiet room (%)
Audiometry - People that can hear normal voice from across a quiet room (%)
Audiometry - Ears ringing, roaring, buzzing (%)
Audiometry - Had a job exposure to loud noise (%)
Audiometry - Had off-work exposure to loud noise (%)
Blood Pressure & Cholesterol - Has high blood pressure (%)
Blood Pressure & Cholesterol - Checking blood pressure at home (%)
Blood Pressure & Cholesterol - Frequently checking blood cholesterol (%)
Blood Pressure & Cholesterol - Has high cholesterol level (%)
Consumer Behavior - Money monthly spent on food at supermarket/grocery store
Consumer Behavior - Money monthly spent on food at other stores
Consumer Behavior - Money monthly spent on eating out
Consumer Behavior - Money monthly spent on carryout/delivered foods
Consumer Behavior - Income spent on food at supermarket/grocery store (%)
Consumer Behavior - Income spent on food at other stores (%)
Consumer Behavior - Income spent on eating out (%)
Consumer Behavior - Income spent on carryout/delivered foods (%)
Current Health Status - General health condition (%)
Current Health Status - Blood donors (%)
Current Health Status - Has blood ever tested for HIV virus (%)
Current Health Status - Left-handed people (%)
Dermatology - People using sunscreen (%)
Diabetes - Diabetics (%)
Diabetes - Had a blood test for high blood sugar (%)
Diabetes - People taking insulin (%)
Diet Behavior & Nutrition - Diet health (%)
Diet Behavior & Nutrition - Milk product consumption (# of products/month)
Diet Behavior & Nutrition - Meals not home prepared (#/week)
Diet Behavior & Nutrition - Meals from fast food or pizza place (#/week)
Diet Behavior & Nutrition - Ready-to-eat foods (#/month)
Diet Behavior & Nutrition - Frozen meals/pizza (#/month)
Drug Use - People that ever used marijuana or hashish (%)
Drug Use - Ever used hard drugs (%)
Drug Use - Ever used any form of cocaine (%)
Drug Use - Ever used heroin (%)
Drug Use - Ever used methamphetamine (%)
Health Insurance - People covered by health insurance (%)
Kidney Conditions-Urology - Avg. # of times urinating at night
Medical Conditions - People with asthma (%)
Medical Conditions - People with anemia (%)
Medical Conditions - People with psoriasis (%)
Medical Conditions - People with overweight (%)
Medical Conditions - Elderly people having difficulties in thinking or remembering (%)
Medical Conditions - People who ever received blood transfusion (%)
Medical Conditions - People having trouble seeing even with glass/contacts (%)
Medical Conditions - People with arthritis (%)
Medical Conditions - People with gout (%)
Medical Conditions - People with congestive heart failure (%)
Medical Conditions - People with coronary heart disease (%)
Medical Conditions - People with angina pectoris (%)
Medical Conditions - People who ever had heart attack (%)
Medical Conditions - People who ever had stroke (%)
Medical Conditions - People with emphysema (%)
Medical Conditions - People with thyroid problem (%)
Medical Conditions - People with chronic bronchitis (%)
Medical Conditions - People with any liver condition (%)
Medical Conditions - People who ever had cancer or malignancy (%)
Mental Health - People who have little interest in doing things (%)
Mental Health - People feeling down, depressed, or hopeless (%)
Mental Health - People who have trouble sleeping or sleeping too much (%)
Mental Health - People feeling tired or having little energy (%)
Mental Health - People with poor appetite or overeating (%)
Mental Health - People feeling bad about themself (%)
Mental Health - People who have trouble concentrating on things (%)
Mental Health - People moving or speaking slowly or too fast (%)
Mental Health - People having thoughts they would be better off dead (%)
Oral Health - Average years since last visit a dentist
Oral Health - People embarrassed because of mouth (%)
Oral Health - People with gum disease (%)
Oral Health - General health of teeth and gums (%)
Oral Health - Average days a week using dental floss/device
Oral Health - Average days a week using mouthwash for dental problem
Oral Health - Average number of teeth
Pesticide Use - Households using pesticides to control insects (%)
Pesticide Use - Households using pesticides to kill weeds (%)
Physical Activity - People doing vigorous-intensity work activities (%)
Physical Activity - People doing moderate-intensity work activities (%)
Physical Activity - People walking or bicycling (%)
Physical Activity - People doing vigorous-intensity recreational activities (%)
Physical Activity - People doing moderate-intensity recreational activities (%)
Physical Activity - Average hours a day doing sedentary activities
Physical Activity - Average hours a day watching TV or videos
Physical Activity - Average hours a day using computer
Physical Functioning - People having limitations keeping them from working (%)
Physical Functioning - People limited in amount of work they can do (%)
Physical Functioning - People that need special equipment to walk (%)
Physical Functioning - People experiencing confusion/memory problems (%)
Physical Functioning - People requiring special healthcare equipment (%)
Prescription Medications - Average number of prescription medicines taking
Preventive Aspirin Use - Adults 40+ taking low-dose aspirin (%)
Reproductive Health - Vaginal deliveries (%)
Reproductive Health - Cesarean deliveries (%)
Reproductive Health - Deliveries resulted in a live birth (%)
Reproductive Health - Pregnancies resulted in a delivery (%)
Reproductive Health - Women breastfeeding newborns (%)
Reproductive Health - Women that had a hysterectomy (%)
Reproductive Health - Women that had both ovaries removed (%)
Reproductive Health - Women that have ever taken birth control pills (%)
Reproductive Health - Women taking birth control pills (%)
Reproductive Health - Women that have ever used Depo-Provera or injectables (%)
Reproductive Health - Women that have ever used female hormones (%)
Sexual Behavior - People 18+ that ever had sex (vaginal, anal, or oral) (%)
Sexual Behavior - Males 18+ that ever had vaginal sex with a woman (%)
Sexual Behavior - Males 18+ that ever performed oral sex on a woman (%)
Sexual Behavior - Males 18+ that ever had anal sex with a woman (%)
Sexual Behavior - Males 18+ that ever had any sex with a man (%)
Sexual Behavior - Females 18+ that ever had vaginal sex with a man (%)
Sexual Behavior - Females 18+ that ever performed oral sex on a man (%)
Sexual Behavior - Females 18+ that ever had anal sex with a man (%)
Sexual Behavior - Females 18+ that ever had any kind of sex with a woman (%)
Sexual Behavior - Average age people first had sex
Sexual Behavior - Average number of female sex partners in lifetime (males 18+)
Sexual Behavior - Average number of female vaginal sex partners in lifetime (males 18+)
Sexual Behavior - Average age people first performed oral sex on a woman (18+)
Sexual Behavior - Average number of woman performed oral sex on in lifetime (18+)
Sexual Behavior - Average number of male sex partners in lifetime (males 18+)
Sexual Behavior - Average number of male anal sex partners in lifetime (males 18+)
Sexual Behavior - Average age people first performed oral sex on a man (18+)
Sexual Behavior - Average number of male oral sex partners in lifetime (18+)
Sexual Behavior - People using protection when performing oral sex (%)
Sexual Behavior - Average number of times people have vaginal or anal sex a year
Sexual Behavior - People having sex without condom (%)
Sexual Behavior - Average number of male sex partners in lifetime (females 18+)
Sexual Behavior - Average number of male vaginal sex partners in lifetime (females 18+)
Sexual Behavior - Average number of female sex partners in lifetime (females 18+)
Sexual Behavior - Circumcised males 18+ (%)
Sleep Disorders - Average hours sleeping at night
Sleep Disorders - People that has trouble sleeping (%)
Smoking-Cigarette Use - People smoking cigarettes (%)
Taste & Smell - People 40+ having problems with smell (%)
Taste & Smell - People 40+ having problems with taste (%)
Taste & Smell - People 40+ that ever had wisdom teeth removed (%)
Taste & Smell - People 40+ that ever had tonsils teeth removed (%)
Taste & Smell - People 40+ that ever had a loss of consciousness because of a head injury (%)
Taste & Smell - People 40+ that ever had a broken nose or other serious injury to face or skull (%)
Taste & Smell - People 40+ that ever had two or more sinus infections (%)
Weight - Average height (inches)
Weight - Average weight (pounds)
Weight - Average BMI
Weight - People that are obese (%)
Weight - People that ever were obese (%)
Weight - People trying to lose weight (%)
According to our research of Texas and other state lists, there were 263 registered sex offenders living in McAllen, Texas as of April 26, 2024 . The ratio of all residents to sex offenders in McAllen is 540 to 1.The ratio of registered sex offenders to all residents in this city is lower than the state average.
The City-Data.com crime index weighs serious crimes and violent crimes more heavily. Higher means more crime, U.S. average is 246.1. It adjusts for the number of visitors and daily workers commuting into cities.
- means the value is smaller than the state average.
- means the value is about the same as the state average.
- means the value is bigger than the state average.
- means the value is much bigger than the state average.
Crime rate in McAllen detailed stats: murders, rapes, robberies, assaults, burglaries, thefts, arson Officers per 1,000 residents here:
1.90Texas average:
2.07
Latest news from McAllen, TX collected exclusively by city-data.com from local newspapers, TV, and radio stations
Ancestries: American (2.6%), English (1.0%).
Current Local Time:
Land area: 46.0 square miles.
Population density: 3,145 people per square mile (average).
37,448 residents are foreign born (23.1% Latin America ).
This city:
25.8%Texas:
17.1%
Median real estate property taxes paid for housing units with mortgages in 2022: $3,484 (1.7%)Median real estate property taxes paid for housing units with no mortgage in 2022: $2,479 (1.8%)
Nearest city with pop. 200,000+: Corpus Christi, TX
Nearest city with pop. 1,000,000+: San Antonio, TX
Nearest cities:
Latitude: 26.22 N, Longitude: 98.24 W
McAllen nicknames or aliases (official or unofficial):
McTown, McCalli, The Texas Tropics, City of PalmsDaytime population change due to commuting: +31,968 (+22.1%)Workers who live and work in this city: 37,649 (59.9%)
Property values in McAllen, TX
McAllen tourist attractions:
Single-family new house construction building permits:
2022: 663 buildings , average cost: $239,8002021: 807 buildings , average cost: $225,0002020: 530 buildings , average cost: $229,9002019: 536 buildings , average cost: $131,6002018: 540 buildings , average cost: $153,3002017: 438 buildings , average cost: $230,5002016: 450 buildings , average cost: $227,3002015: 515 buildings , average cost: $225,7002014: 412 buildings , average cost: $211,8002013: 374 buildings , average cost: $201,2002012: 433 buildings , average cost: $187,9002011: 397 buildings , average cost: $181,8002010: 472 buildings , average cost: $175,5002009: 352 buildings , average cost: $178,9002008: 573 buildings , average cost: $174,4002007: 754 buildings , average cost: $165,4002006: 1075 buildings , average cost: $154,6002005: 951 buildings , average cost: $144,3002004: 967 buildings , average cost: $103,4002003: 875 buildings , average cost: $95,2002002: 843 buildings , average cost: $79,1002001: 873 buildings , average cost: $75,0002000: 788 buildings , average cost: $70,1001999: 837 buildings , average cost: $69,3001998: 747 buildings , average cost: $72,6001997: 553 buildings , average cost: $76,900Unemployment in December 2023:
Population change in the 1990s: +19,849 (+22.9%).
Most common occupations in McAllen, TX (%)
Both Males Females
Building and grounds cleaning and maintenance occupations (7.3%)
Cooks and food preparation workers (6.7%)
Other management occupations, except farmers and farm managers (5.3%)
Retail sales workers, except cashiers (4.5%)
Secretaries and administrative assistants (2.9%)
Cashiers (2.8%)
Registered nurses (2.6%)
Building and grounds cleaning and maintenance occupations (8.0%)
Other management occupations, except farmers and farm managers (6.3%)
Cooks and food preparation workers (5.5%)
Retail sales workers, except cashiers (5.4%)
Driver/sales workers and truck drivers (4.1%)
Electrical equipment mechanics and other installation, maintenance, and repair workers, including supervisors (3.1%)
Material recording, scheduling, dispatching, and distributing workers (2.9%)
Cooks and food preparation workers (8.2%)
Building and grounds cleaning and maintenance occupations (6.5%)
Secretaries and administrative assistants (5.9%)
Cashiers (4.7%)
Registered nurses (4.3%)
Other management occupations, except farmers and farm managers (4.3%)
Other office and administrative support workers, including supervisors (3.8%)
Air pollution and air quality trends(lower is better)
AQI Ozone PM2.5
Tornado activity:
McAllen-area historical tornado activity is significantly below Texas state average. It is 78% smaller than the overall U.S. average.
On 4/19/1965, a category F3 (max. wind speeds 158-206 mph) tornado 34.0 miles away from the McAllen city center .
On 5/12/1969, a category F3 tornado 34.5 miles away from the city center caused between $5000 and $50,000 in damages.
Earthquake activity:
McAllen-area historical earthquake activity is slightly below Texas state average. It is 80% smaller than the overall U.S. average. On 10/20/2011 at 12:24:41, a magnitude 4.8 (4.8 MW, Depth: 3.1 mi, Class: Light, Intensity: IV - V) earthquake occurred 183.5 miles away from McAllen center On 4/14/1995 at 00:32:56, a magnitude 5.7 (5.6 MB, 5.7 MS, 5.7 MW, Depth: 11.1 mi, Class: Moderate, Intensity: VI - VII) earthquake occurred 420.2 miles away from McAllen center On 4/9/1993 at 12:29:19, a magnitude 4.3 (4.1 MB, 4.3 LG, Depth: 3.1 mi) earthquake occurred 179.6 miles away from McAllen center On 4/25/2010 at 02:10:42, a magnitude 3.9 (3.9 MB, Depth: 3.1 mi, Class: Light, Intensity: II - III) earthquake occurred 106.0 miles away from McAllen center On 11/13/2017 at 11:23:01, a magnitude 3.9 (3.9 MD, Depth: 3.1 mi) earthquake occurred 112.1 miles away from McAllen center On 3/24/1997 at 22:31:34, a magnitude 3.8 (3.8 LG, Depth: 3.1 mi) earthquake occurred 104.4 miles away from the city center Magnitude types: regional Lg-wave magnitude (LG), body-wave magnitude (MB), duration magnitude (MD), surface-wave magnitude (MS), moment magnitude (MW) Natural disasters: The number of natural disasters in Hidalgo County (22) is greater than the US average (15).Major Disasters (Presidential) Declared: 12Emergencies Declared: 7Hurricanes: 12, Floods: 7, Storms: 6, Tornadoes: 3, Winds: 3, Fire: 1, Heavy Rain: 1, Tropical Storm: 1, Other: 1 (Note: some incidents may be assigned to more than one category). Main business address for: TEXAS REGIONAL BANCSHARES INC STATE COMMERCIAL BANKS ).
Hospitals in McAllen: 32ND STREET NORTH GROUP HOME (5313 N 32ND ST) 6000 NORTH 26TH ST (6000 N 26TH ST) CHARTER PALMS BEHAVIORAL HLTH SYS (1421 E JACKSON AVENUE BOX 5239) CIMA HOSPICE OF THE VALLEY LP (5317 N MCCOLL ROAD) IPH HOSPICE CARE, INC. (1100 E JASMINE AVENUE) MCALLEN MEDICAL CENTER (provides emergency services, 301 W EXPRESSWAY 83) RIO GRANDE REGIONAL HOSPITAL (Proprietary, 101 E RIDGE RD) RIO GRANDE REHABILITATION HOSPITAL (1421 JACKSON AVENUE SUITE B) SOLORA HOSPITAL MCALLEN (301 WEST EXPRESSWAY 83-8TH FLOOR) Nursing Homes in McAllen: ALFREDO GONZALEZ TEXAS STATE VETERANS HOME (301 E YUMA AVE) BRIARCLIFF NURSING AND REHABILITATION CENTER LP (3201 N WARE RD) COLONIAL MANOR (209 HACKBERRY AVE) GRAND TERRACE REHABILITATION AND HEALTHCARE (812 W HOUSTON AVE) LAS PALMAS HEALTHCARE CENTER (1301 E QUEBEC) MCALLEN NURSING CENTER (600 N CYNTHIA ST) OAKRIDGE CARE CENTER (615 NORTH WARE ROAD) RETAMA MANOR NURSING CENTER/MCALLEN (900 S 12TH ST) RIO GRANDE REHAB HOSPITAL (1421 EAST JACKSON AVENUE) TWINBROOKE SOUTH MCALLEN (1000 N MCCOLL RD) VILLAGE HEALTHCARE AND REHABILITATION (615 N WARE RD) Dialysis Facilities in McAllen: DSI MCALLEN RENAL CENTER (411 LINDBERG AVENUE) FRESENIUS MEDICAL CARE MCALLEN (1325 EAST QUEBEC) USRC MCALLEN DIALYSIS (1301 EAST RIDGE ROAD) VALLEY DIALYSIS OF MCALLEN (2000 S. CYNTHIA STREET) Home Health Centers in McAllen: ABUNDANT HEALTH CARE SERVICES (1305 EAST NOLANA SUITE B & C) AMIGO HOME HEALTH AGENCY (600 S 15TH STREET) CLEVELAND HEALTH CARE LLC (1615 NORTH MAIN STREET) FIRST CHOICE HEALTHCARE (1801 SOUTH 5TH STREET SUITE 117) HHN HEALTHCARE LLC (2405 BUDDY OWENS) LIFE TOUCH HOME HEALTH SERVICES (801 E FERN AVE SUITE 110) MEDEX HOME HEALTH CARE (4800 WEST EXPRESSWAY 83) PRECIOUS LIFE HOME HEALTH INC (113 EAST TAMARACK AVENUE) RENAISSANCE NURSING SERVICES LLC (3605 NORTH WARE ROAD) SUPERIOR HOME HEALTH SERVICES LLC (2108 SOUTH M ST) Amtrak station: MCALLEN (120 S. 16TH ST.) - Bus Station
.
Services: enclosed waiting area, intercity bus service.
Colleges/Universities in McAllen: South Texas College Full-time enrollment: 19,701; Location: 3201 W Pecan; Public; Website: www.southtexascollege.edu)
Kaplan College-McAllen Full-time enrollment: 966; Location: 1500 S. Jackson; Private, for-profit; Website: www.kaplancollege.com/mcallen-tx/)
South Texas Vocational Technical Institute-McAllen Full-time enrollment: 758; Location: 2400 Daffodil Ave.; Private, for-profit; Website: www.stvt.edu)
University of Cosmetology Arts & Sciences-McAllen Full-time enrollment: 206; Location: 8401 N 10th St; Private, for-profit; Website: www.ucastx.com)
Vogue College of Cosmetology-McAllen Full-time enrollment: 150; Location: 800 Fern Avenue; Private, for-profit; Website: voguebeautycollege.com)
Southern Texas Careers Academy Full-time enrollment: 49; Location: 601 East Nolana; Private, for-profit; Website: thespaprofessionalsacademy.com)
Other colleges/universities with over 2000 students near McAllen:
The University of Texas-Pan American (about 8 miles; Edinburg, TX ; Full-time enrollment: 16,766)
Texas State Technical College-Harlingen (about 36 miles; Harlingen, TX ; FT enrollment: 3,700)
The University of Texas at Brownsville (about 52 miles; Brownsville, TX ; FT enrollment: 9,165)
Texas A & M University-Kingsville (about 94 miles; Kingsville, TX ; FT enrollment: 9,295)
Texas A & M University-Corpus Christi (about 118 miles; Corpus Christi, TX ; FT enrollment: 9,092)
Del Mar College (about 119 miles; Corpus Christi, TX ; FT enrollment: 5,213)
Laredo Community College (about 120 miles; Laredo, TX ; FT enrollment: 9,743)
Biggest public high schools in McAllen: MCALLEN H S Students: 2,255, Location: 2021 LA VISTA AVE, Grades: 9-12)MEMORIAL H S Students: 2,090, Location: 101 E HACKBERRY AVE, Grades: 9-12)DE LEON MIDDLE Students: 722, Location: 4201 N 29TH ST, Grades: 6-9)ACHIEVE EARLY COLLEGE H S Students: 206, Location: 2000 N 23RD ST, Grades: 9-12)MIDVALLEY ACADEMY-MCALLEN CHARTER H S Students: 169, Location: 200 N 17TH ST, Grades: 9-12, Charter school )LAMAR ACADEMY Students: 144, Location: 1009 N 10TH ST, Grades: 9-12)INSTR/GUID CENTER Students: 59, Location: 2604 GALVESTON AVE, Grades: 6-12)J J A E P Students: 7, Location: 3017 S 10TH ST, Grades: 10)SOUTHWEST KEY PROGRAM Students: 7, Location: 3900 N 23RD, Grades: 7-12)MORRIS MIDDLE Location: 1400 TRENTON RD, Grades: 6-9)
Private high schools in McAllen: SOUTH TEXAS CHRISTIAN ACADEMY Students: 322, Location: 7001 N WARE RD, Grades: PK-12)
TAYLOR CHRISTIAN SCHOOL Students: 41, Location: 2021 W JACKSON AVE, Grades: PK-9)
Biggest public elementary/middle schools in McAllen: CATHEY MIDDLE Students: 970, Location: 1800 N CYNTHIA, Grades: 6-8)MCAULIFFE EL Students: 802, Location: 3000 DAFFODIL AVE, Grades: PK-5)MICHAEL E FOSSUM MIDDLE Students: 777, Location: 7800 N WARE RD, Grades: 6-8)CASTANEDA EL Students: 741, Location: 4100 N 34TH, Grades: PK-5)ROOSEVELT EL Students: 697, Location: 4801 S 26TH ST, Grades: PK-5)THIGPEN-ZAVALA EL Students: 670, Location: 2500 GALVESTON AVE, Grades: PK-5)FIELDS EL Students: 626, Location: 500 DALLAS AVE, Grades: PK-5)IDEA MCALLEN COLLEGE PREPARATORY Students: 624, Location: 201 N BENTSEN RD, Grades: 6-8, Charter school )DR PABLO PEREZ Students: 573, Location: 7801 N MAIN, Grades: PK-5)BLANCA E SANCHEZ Students: 571, Location: 2901 INCARNATE WORD, Grades: PK-5)Private elementary/middle schools in McAllen: OUR LADY OF SORROWS SCHOOL Students: 594, Location: 1100 GUMWOOD AVE, Grades: PK-8)
COVENANT CHRISTIAN ACADEMY Students: 451, Location: 3800 PRIMROSE, Grades: PK-8)
ST JOHNS EPISCOPAL DAY SCHOOL Students: 247, Location: 2500 N 10TH ST, Grades: PK-5)
ST PAUL LUTHERAN SCHOOL Students: 167, Location: 300 PECAN BLVD, Grades: PK-8)
CENTRAL CHRISTIAN SCHOOL Students: 83, Location: 1320 W NOLANA AVE, Grades: PK-5)
See full list of schools located in McAllen Library in McAllen: MCALLEN MEMORIAL LIBRARY Operating income: $3,563,546; Location: 601 N MAIN ST; 327,388 books ; 76 e-books ; 7,240 audio materials ; 16,880 video materials ; 3 local licensed databases ; 50 state licensed databases ; 503 print serial subscriptions ; 3 electronic serial subscriptions )
User-submitted facts and corrections:
James "Nikki" Rowe High School -Enrollment 1980 - 2101 N. Ware Road, McAllen, TX
There is another high school in mcallen that was not mentioned: Nikki Rowe High School off of Ware road
Notable locations in McAllen: (A) , McAllen Fire Department Station 3 (B) , McAllen Fire Department Station 5 (C) , McAllen Fire Department Station 6 (D) , McAllen Fire Department Central Fire Station 1 (E) , McAllen Animal Control Division (F) , McAllen Fire Department Station 4 (G) , McAllen Community Policing (H) , McAllen Police Department Substation (I) , McAllen Police Department - Detention (J) , McAllen Community Policing (K) , McAllen Police Community Center (L) , McAllen Community Policing (M) , McAllen Police Department (N) , McAllen Memorial Library (O) , McAllen International Museum (P) , Palm Valley Emergency Medical Services (Q) , Medical and Trauma Specialists (R) , Border Ambulance Service (S) , Archangel Ambulance Professional (T) . Display/hide their locations on the map
Shopping Centers: (1) , Las Tiendas Plaza Shopping Center (2) . Display/hide their locations on the map
Main business address in McAllen: (A) . Display/hide its location on the map
Churches in McAllen include: (A) , Crosspoint Fellowship Baptist Church (B) , Buckner Baptist Benevolences Church (C) , Master Builder Assembly of God Church (D) , Mcallen Apostolic Assembly Church (E) , Free Methodist Church (F) , First Missionary Baptist Church (G) , Our Lady of Perpetual Help Church (H) , Family of Faith Fellowship Church (I) . Display/hide their locations on the map
Cemeteries: (1) , Roselawn Cemetery (2) , La Piedad Cemetery (3) , Valley Memorial Gardens (4) . Display/hide their locations on the map
Lakes and reservoirs: (A) , Boeye Reservoir (B) . Display/hide their locations on the map
Parks in McAllen include: (1) , Las Palmas Park (2) , La Vista Park (3) , Jaycee Park (4) , Hackberry Park (5) , Spring Fest Park (6) , Schupp Park (7) , Robin Park (8) , Retama Park (9) . Display/hide their locations on the map
Tourist attraction: (1) . Display/hide its approximate location on the map
Birthplace of: Matt Gonzalez - Activist, Catherine Hardwicke - Film director, Elizabeth Moon - Fantasy writer, James N. Rowe - Recipient of the Purple Heart medal, Jorge Cantú - Baseball player, Michael Heath (swimmer) - College swimmer, Danny Puente - College basketball player (Tx Pan American Broncos), Rick Luecken - Baseball player, William B. Oden - United Methodist bishop.
Hidalgo County has a predicted average indoor radon screening level less than 2 pCi/L (pico curies per liter) - Low Potential Average household size: This city:
3.1 peopleTexas:
2.8 people
Percentage of family households: This city:
76.5%Whole state:
69.9%
Percentage of households with unmarried partners: This city:
5.2%Whole state:
6.0%
Likely homosexual households (counted as self-reported same-sex unmarried-partner households)
Lesbian couples: 0.3% of all households Gay men: 0.2% of all households
People in group quarters in McAllen in 2010:
890 people in nursing facilities/skilled-nursing facilities
101 people in other noninstitutional facilities
82 people in emergency and transitional shelters (with sleeping facilities) for people experiencing homelessness
28 people in group homes intended for adults
9 people in in-patient hospice facilities
People in group quarters in McAllen in 2000:
752 people in nursing homes
90 people in other noninstitutional group quarters
51 people in other nonhousehold living situations
28 people in halfway houses
20 people in hospitals/wards and hospices for chronically ill
17 people in other group homes
14 people in hospices or homes for chronically ill
11 people in religious group quarters
7 people in orthopedic wards and institutions for the physically handicapped
6 people in military hospitals or wards for chronically ill
6 people in homes for the mentally retarded
4 people in wards in general hospitals for patients who have no usual home elsewhere
For population 15 years and over in McAllen:
Never married: 35.1%Now married: 49.3%Separated: 2.5%Widowed: 5.0%Divorced: 8.1% For population 25 years and over in McAllen:
High school or higher: 81.4%Bachelor's degree or higher: 33.7%Graduate or professional degree: 13.3%Unemployed: 8.7%Mean travel time to work (commute): 19.4 minutes
Education Gini index (Inequality in education) Here:
16.2Texas average:
14.0
Religion statistics for McAllen, TX (based on Hidalgo County data)
Religion Adherents Congregations Catholic 269,071 56 Evangelical Protestant 75,327 525 Other 18,510 43 Mainline Protestant 14,394 52 Orthodox 160 1 None 397,307 -
Source: Clifford Grammich, Kirk Hadaway, Richard Houseal, Dale E.Jones, Alexei Krindatch, Richie Stanley and Richard H.Taylor. 2012. 2010 U.S.Religion Census: Religious Congregations & Membership Study. Association of Statisticians of American Religious Bodies. Jones, Dale E., et al. 2002. Congregations and Membership in the United States 2000. Nashville, TN: Glenmary Research Center. Graphs represent county-level data
Food Environment Statistics: Number of grocery stores : 79Here :
1.12 / 10,000 pop.Texas :
1.47 / 10,000 pop.
Number of supercenters and club stores : 6Here :
0.09 / 10,000 pop.Texas :
0.14 / 10,000 pop.
Number of convenience stores (no gas) : 67This county :
0.95 / 10,000 pop.State :
1.11 / 10,000 pop.
Number of convenience stores (with gas) : 240This county :
3.40 / 10,000 pop.Texas :
3.95 / 10,000 pop.
Number of full-service restaurants : 337Hidalgo County :
4.78 / 10,000 pop.State :
6.13 / 10,000 pop.
Adult diabetes rate : Hidalgo County :
9.7%State :
8.9%
Low-income preschool obesity rate : Health and Nutrition: Healthy diet rate : This city:
49.0%Texas:
48.6%
Average overall health of teeth and gums : This city:
50.8%Texas:
47.4%
People feeling badly about themselves : People not drinking alcohol at all : This city:
9.8%Texas:
10.3%
Average hours sleeping at night : General health condition : This city:
56.7%State:
56.2%
Average condition of hearing : More about Health and Nutrition of McAllen, TX Residents
Local government employment and payroll (March 2022)
Function
Full-time employees
Monthly full-time payroll
Average yearly full-time wage
Part-time employees
Monthly part-time payroll
Police Protection - Officers
262 $1,646,264 $75,401 0 $0 Parks and Recreation
192 $654,067 $40,879 96 $98,691 Firefighters
166 $1,038,697 $75,087 0 $0 Solid Waste Management
152 $551,528 $43,542 9 $19,853 Police - Other
140 $467,666 $40,086 0 $0 Water Supply
133 $581,241 $52,443 4 $5,303 Streets and Highways
117 $374,834 $38,445 4 $443 Other and Unallocable
97 $396,145 $49,008 1 $1,399 Sewerage
85 $345,792 $48,818 0 $0 Financial Administration
83 $412,851 $59,689 0 $0 Other Government Administration
76 $375,609 $59,307 6 $9,154 Transit
61 $192,435 $37,856 8 $16,275 Local Libraries
60 $191,578 $38,316 22 $22,535 Health
39 $137,058 $42,172 0 $0 Airports
38 $139,013 $43,899 3 $2,910 Judicial and Legal
34 $161,356 $56,949 0 $0 Natural Resources
18 $58,393 $38,929 0 $0 Fire - Other
18 $72,015 $48,010 0 $0 Housing and Community Development (Local)
4 $14,081 $42,243 0 $0
Totals for Government
1,775 $7,810,622 $52,804 153 $176,563
McAllen government finances - Expenditure in 2021 (per resident):
Construction - Sewerage: $31,869,000 ($220.43)
Toll Highways: $5,626,000 ($38.91)Air Transportation: $4,041,000 ($27.95)Water Utilities: $1,938,000 ($13.40)Police Protection: $931,000 ($6.44)Transit Utilities: $362,000 ($2.50)Parking Facilities: $40,000 ($0.28)Solid Waste Management: $32,000 ($0.22)Current Operations - Police Protection: $39,985,000 ($276.56)
Local Fire Protection: $21,625,000 ($149.57)Parks and Recreation: $21,148,000 ($146.27)Solid Waste Management: $20,437,000 ($141.36)Regular Highways: $16,911,000 ($116.97)Water Utilities: $16,325,000 ($112.91)General - Other: $11,331,000 ($78.37)Sewerage: $10,078,000 ($69.71)Financial Administration: $7,979,000 ($55.19)Toll Highways: $5,709,000 ($39.49)Central Staff Services: $5,634,000 ($38.97)Libraries: $4,647,000 ($32.14)Air Transportation: $4,621,000 ($31.96)Transit Utilities: $4,376,000 ($30.27)Judicial and Legal Services: $3,717,000 ($25.71)Health - Other: $3,274,000 ($22.65)Housing and Community Development: $2,412,000 ($16.68)Public Welfare - Other: $2,076,000 ($14.36)General Public Buildings: $1,641,000 ($11.35)Natural Resources - Other: $1,599,000 ($11.06)Protective Inspection and Regulation - Other: $1,282,000 ($8.87)Parking Facilities: $1,219,000 ($8.43)General - Interest on Debt: $4,065,000 ($28.12)
Intergovernmental to Local - Other - Regular Highways: $3,755,000 ($25.97)
Other Capital Outlay - Solid Waste Management: $4,404,000 ($30.46)
Parks and Recreation: $751,000 ($5.19)Sewerage: $566,000 ($3.91)Police Protection: $362,000 ($2.50)Water Utilities: $331,000 ($2.29)Toll Highways: $316,000 ($2.19)Libraries: $255,000 ($1.76)Financial Administration: $120,000 ($0.83)Parking Facilities: $77,000 ($0.53)General - Other: $55,000 ($0.38)Air Transportation: $41,000 ($0.28)Transit Utilities: $37,000 ($0.26)Local Fire Protection: $24,000 ($0.17)Regular Highways: $14,000 ($0.10)Total Salaries and Wages: $93,905,000 ($649.51)
Water Utilities - Interest on Debt: $2,709,000 ($18.74)
McAllen government finances - Revenue in 2021 (per resident):
Charges - Sewerage: $21,876,000 ($151.31)
Solid Waste Management: $20,477,000 ($141.63)Toll Highways: $20,120,000 ($139.16)Air Transportation: $9,802,000 ($67.80)Parks and Recreation: $6,083,000 ($42.07)Other: $4,049,000 ($28.01)Parking Facilities: $1,444,000 ($9.99)Federal Intergovernmental - Air Transportation: $5,001,000 ($34.59)
Housing and Community Development: $2,960,000 ($20.47)Highways: $2,888,000 ($19.98)Transit Utilities: $2,408,000 ($16.66)Other: $571,000 ($3.95)Local Intergovernmental - Other: $353,000 ($2.44)
Miscellaneous - Sale of Property: $12,520,000 ($86.60)
Interest Earnings: $2,567,000 ($17.75)General Revenue - Other: $2,307,000 ($15.96)Rents: $2,034,000 ($14.07)Fines and Forfeits: $1,754,000 ($12.13)Royalties: $603,000 ($4.17)Donations From Private Sources: $55,000 ($0.38)Revenue - Water Utilities: $22,851,000 ($158.05)
Transit Utilities: $1,179,000 ($8.15)State Intergovernmental - General Local Government Support: $692,000 ($4.79)
Other: $328,000 ($2.27)Transit Utilities: $171,000 ($1.18)Tax - General Sales and Gross Receipts: $73,444,000 ($507.99)
Property: $49,069,000 ($339.39)Public Utilities Sales: $8,160,000 ($56.44)Other Selective Sales: $6,381,000 ($44.14)Other License: $1,798,000 ($12.44)Occupation and Business License - Other: $378,000 ($2.61)Alcoholic Beverage License: $83,000 ($0.57)
McAllen government finances - Debt in 2021 (per resident):
Long Term Debt - Beginning Outstanding - Unspecified Public Purpose: $137,153,000 ($948.64)
Outstanding Unspecified Public Purpose: $98,348,000 ($680.24)Retired Unspecified Public Purpose: $38,805,000 ($268.40)
McAllen government finances - Cash and Securities in 2021 (per resident):
Bond Funds - Cash and Securities: $79,802,000 ($551.96)
Other Funds - Cash and Securities: $204,747,000 ($1416.16)
Sinking Funds - Cash and Securities: $6,183,000 ($42.77)
2.90% of this county's 2021 resident taxpayers lived in other counties in 2020 ($46,406 average adjusted gross income )
Here:
2.90%Texas average:
8.12%
0.01% of residents moved from foreign countries ($200 average AGI )Hidalgo County:
0.01%Texas average:
0.04%
Top counties from which taxpayers relocated into this county between 2020 and 2021:
2.73% of this county's 2020 resident taxpayers moved to other counties in 2021 ($45,511 average adjusted gross income )
Here:
2.73%Texas average:
7.40%
0.01% of residents moved to foreign countries ($147 average AGI )Hidalgo County:
0.01%Texas average:
0.03%
Top counties to which taxpayers relocated from this county between 2020 and 2021:
Businesses in McAllen, TX
Name Count Name Count
99 Cents Only Stores 2 JoS. A. Bank 1 ALDO 1 Jones New York 4 AT&T 4 Journeys 1 Abercrombie & Fitch 1 KFC 1 Abercrombie Kids 1 Kincaid 1 Academy Sports + Outdoors 2 Kohl's 1 Advance Auto Parts 2 La Quinta 1 Aeropostale 1 La-Z-Boy 2 American Eagle Outfitters 1 Lane Furniture 4 Ann Taylor 1 LensCrafters 1 Applebee's 2 Little Caesars Pizza 4 AutoZone 2 Lowe's 1 Avenue 1 Macy's 1 BMW 1 Marriott 5 Bakers 2 Marshalls 2 Banana Republic 1 MasterBrand Cabinets 5 Barnes & Noble 2 McDonald's 8 Baskin-Robbins 2 Men's Wearhouse 1 Bath & Body Works 2 Motel 6 1 Bebe 1 Motherhood Maternity 2 Bed Bath & Beyond 1 New Balance 1 Ben & Jerry's 1 Nike 18 Best Western 1 Nissan 1 Blockbuster 1 Office Depot 2 Burger King 6 OfficeMax 2 Burlington Coat Factory 1 Old Navy 2 CVS 1 Olive Garden 2 Cache 1 Outback 1 Carl\s Jr. 1 Outback Steakhouse 1 Charlotte Russe 1 Pac Sun 1 Chick-Fil-A 3 Papa John's Pizza 1 Chico's 1 Payless 6 Chuck E. Cheese's 1 Penske 2 Church's Chicken 5 PetSmart 2 Cold Stone Creamery 1 Pier 1 Imports 1 Comfort Suites 1 Pizza Hut 5 Cracker Barrel 1 Quiznos 2 Cricket Wireless 26 RadioShack 5 DHL 6 Ramada 1 Dairy Queen 4 Red Lobster 2 Days Inn 2 Rooms To Go 2 Dennys 1 Rue21 1 Discount Tire 1 SAS Shoes 1 Domino's Pizza 1 SONIC Drive-In 2 DressBarn 1 Sam's Club 1 Dressbarn 1 Sears 2 El Pollo Loco 1 Sephora 1 Express 1 Shoe Carnival 2 FedEx 18 Spencer Gifts 1 Firestone Complete Auto Care 2 Sprint Nextel 6 Foot Locker 2 Starbucks 4 GNC 2 Studio 6 1 GameStop 7 Subway 13 Gap 1 Super 8 2 Goodwill 2 T-Mobile 10 Gymboree 1 Taco Bell 1 H&R Block 5 Target 3 Hilton 1 UPS 16 Hobby Lobby 2 Vans 4 Holiday Inn 2 Verizon Wireless 2 Hollister Co. 1 Victoria's Secret 1 Home Depot 1 Walgreens 6 Honda 1 Walmart 2 Hot Topic 1 Wendy's 2 JCPenney 2 Wet Seal 1 Jack In The Box 6 Wingate 1
Strongest AM radio stations in McAllen:
KURV (710 AM; 10 kW; EDINBURG, TX; Owner: VOICE OF VALLEY AGRICULTURE, INC.)
KRIO (910 AM; 5 kW; MCALLEN, TX; Owner: RIO GRANDE BIBLE INSTITUTE, INC.)
KUBR (1210 AM; 10 kW; SAN JUAN, TX; Owner: PAULINO BERNAL)
KGBT (1530 AM; 50 kW; HARLINGEN, TX; Owner: TICHENOR LICENSE CORPORATION)
KVJY (840 AM; 5 kW; PHARR, TX; Owner: RADIO UNICA OF MCALLEN LICENSE CORP.)
KIRT (1580 AM; 1 kW; MISSION, TX; Owner: BRAVO BROADCASTING COMPANY, INC.)
KRGE (1290 AM; 5 kW; WESLACO, TX; Owner: CHRISTIAN MINISTRIES OF THE VALLEY)
KQXX (1700 AM; 10 kW; BROWNSVILLE, TX; Owner: LA NUEVA KBOR, INC.)
KBOR (1600 AM; 10 kW; BROWNSVILLE, TX; Owner: LA NUEVA KBOR, INC.)
KCTA (1030 AM; 50 kW; CORPUS CHRISTI, TX; Owner: BROADCASTING CORPORATION OF THE SOUTHWEST)
KKYX (680 AM; 50 kW; SAN ANTONIO, TX; Owner: CXR HOLDINGS, INC.)
KTKR (760 AM; 50 kW; SAN ANTONIO, TX; Owner: CCB TEXAS LICENSES, L.P.)
WOAI (1200 AM; 50 kW; SAN ANTONIO, TX; Owner: CCB TEXAS LICENSES, L.P.)
Strongest FM radio stations in McAllen:
KQXX-FM (105.5 FM; MISSION, TX; Owner: LA NUEVA KBOR, INC.)
KOIR (88.5 FM; EDINBURG, TX; Owner: RIO GRANDE BIBLE INSTITUTE, INC.)
KVLY (107.9 FM; EDINBURG, TX; Owner: ENTRAVISION HOLDINGS, L.L.C.)
KJAV (104.9 FM; ALAMO, TX; Owner: PAULINO BERNAL)
KTEX (100.3 FM; BROWNSVILLE, TX; Owner: CAPSTAR TX LIMITED PARTNERSHIP)
KBFM (104.1 FM; EDINBURG, TX; Owner: CAPSTAR TX LIMITED PARTNERSHIP)
KVMV (96.9 FM; MCALLEN, TX; Owner: WORLD RADIO NETWORK, INC.)
KFRQ (94.5 FM; HARLINGEN, TX; Owner: ENTRAVISION HOLDINGS, L.L.C.)
KGBT-FM (98.5 FM; MCALLEN, TX; Owner: TICHENOR LICENSE CORPORATION ("TLC"))
KBTQ (96.1 FM; HARLINGEN, TX; Owner: TICHENOR LICENSE CORPORATION ("TLC"))
KKPS (99.5 FM; BROWNSVILLE, TX; Owner: ENTRAVISION HOLDINGS, L.L.C.)
KHID (88.1 FM; MCALLEN, TX; Owner: RGV EDUCATIONAL BROADCASTING, INC.)
KQBO (103.1 FM; RIO GRANDE CITY, TX; Owner: SOUND INVESTMENTS UNLIMITED, INC.)
KMAZ (106.3 FM; MERCEDES, TX; Owner: LA NUEVA KBOR, INC.)
KCAS (91.5 FM; MCCOOK, TX; Owner: FAITH BAPTIST CHURCH INC)
K248AM (97.5 FM; MCALLEN, TX; Owner: WORLD RADIO NETWORK, INC.)
TV broadcast stations around McAllen:
KSFE-LP (Channel 67; McALLEN, TX; Owner: ORTIZ BROADCASTING CORPORATION)
KLIA-LP (Channel 32; McALLEN, TX; Owner: ORTIZ BROADCASTING CORPORATION)
K57FE (Channel 57; MCALLEN, TX; Owner: CHANNEL 57, INC.)
KZMC-LP (Channel 35; McALLEN, TX; Owner: ZAVALETTA BROADCASTING OF THE RIO GRANDE VALLEY, LLC)
KSTI-LP (Channel 69; McALLEN, TX; Owner: FAITH PLEASES GOD CHURCH CORPORATION)
KJST-LP (Channel 28; McALLEN, TX; Owner: FAITH PLEASES GOD CHURCH CORPORATION)
KTLM (Channel 40; RIO GRANDE CITY, TX; Owner: SUNBELT MULTIMEDIA CO.)
KNVO (Channel 48; Mc ALLEN, TX; Owner: ENTRAVISION HOLDINGS, LLC)
KRGV-TV (Channel 5; WESLACO, TX; Owner: MOBILE VIDEO TAPES, INC.)
KVEO (Channel 23; BROWNSVILLE, TX; Owner: COMCORP OF TEXAS LICENSE CORP.)
KGBT-TV (Channel 4; HARLINGEN, TX; Owner: LIBCO, INC.)
KMBH (Channel 60; HARLINGEN, TX; Owner: RGV EDUCATIONAL BROADCASTING, INC.)
KLUJ (Channel 44; HARLINGEN, TX; Owner: COMMUNITY EDUCATIONAL TELEVISION)
KFTN-LP (Channel 30; La FERIA, TX; Owner: ORTIZ BROADCASTING CORPORATION)
National Bridge Inventory (NBI) Statistics 68 Number of bridges1,188ft / 362m Total length $79,000 Total costs1,345,247 Total average daily traffic54,871 Total average daily truck traffic
New bridges - historical statistics
2 1950-1959 15 1960-1969 9 1970-1979 10 1980-1989 20 1990-1999 4 2000-2009 8 2010-2019
See full National Bridge Inventory statistics for McAllen, TX
Home Mortgage Disclosure Act Aggregated Statistics For Year 2009(Based on 14 full and 7 partial tracts) A) FHA, FSA/RHS & VA B) Conventional C) Refinancings D) Home Improvement Loans E) Loans on Dwellings For 5+ Families F) Non-occupant Loans on G) Loans On Manufactured Number Average Value Number Average Value Number Average Value Number Average Value Number Average Value Number Average Value Number Average Value
LOANS ORIGINATED 390 $129,341 344 $145,294 589 $138,771 76 $35,308 8 $698,000 92 $113,848 1 $26,450 APPLICATIONS APPROVED, NOT ACCEPTED 25 $133,255 45 $140,163 173 $143,778 10 $71,512 1 $112,000 24 $115,800 0 $0 APPLICATIONS DENIED 61 $115,833 82 $100,710 550 $124,856 193 $31,245 1 $1,497,000 60 $93,671 10 $31,189 APPLICATIONS WITHDRAWN 44 $119,442 41 $130,243 214 $134,101 17 $34,974 0 $0 23 $86,171 0 $0 FILES CLOSED FOR INCOMPLETENESS 18 $123,636 15 $119,657 102 $121,161 42 $56,849 0 $0 8 $124,325 1 $28,440
Aggregated Statistics For Year 2008(Based on 14 full and 7 partial tracts) A) FHA, FSA/RHS & VA B) Conventional C) Refinancings D) Home Improvement Loans E) Loans on Dwellings For 5+ Families F) Non-occupant Loans on G) Loans On Manufactured Number Average Value Number Average Value Number Average Value Number Average Value Number Average Value Number Average Value Number Average Value
LOANS ORIGINATED 283 $126,643 604 $134,573 489 $127,806 164 $40,512 14 $711,294 193 $111,029 9 $39,833 APPLICATIONS APPROVED, NOT ACCEPTED 28 $128,588 82 $129,804 148 $118,116 21 $47,301 3 $325,233 25 $91,148 7 $57,344 APPLICATIONS DENIED 57 $130,334 223 $125,616 868 $113,886 374 $39,807 4 $599,038 94 $101,224 23 $43,718 APPLICATIONS WITHDRAWN 47 $133,048 86 $137,971 202 $127,946 32 $82,909 0 $0 30 $119,012 0 $0 FILES CLOSED FOR INCOMPLETENESS 11 $99,109 37 $145,711 103 $117,241 27 $45,006 2 $772,500 14 $122,736 0 $0
Aggregated Statistics For Year 2007(Based on 14 full and 7 partial tracts) A) FHA, FSA/RHS & VA B) Conventional C) Refinancings D) Home Improvement Loans E) Loans on Dwellings For 5+ Families F) Non-occupant Loans on G) Loans On Manufactured Number Average Value Number Average Value Number Average Value Number Average Value Number Average Value Number Average Value Number Average Value
LOANS ORIGINATED 166 $126,997 1,342 $126,802 679 $116,610 260 $38,129 22 $1,419,849 322 $118,744 18 $24,010 APPLICATIONS APPROVED, NOT ACCEPTED 12 $124,662 230 $114,443 205 $108,676 70 $35,344 3 $393,667 65 $114,673 6 $37,728 APPLICATIONS DENIED 22 $130,572 517 $119,179 1,080 $104,840 394 $39,984 4 $821,000 182 $112,928 28 $32,939 APPLICATIONS WITHDRAWN 16 $144,498 220 $118,435 463 $108,793 52 $48,971 1 $520,000 76 $102,211 2 $21,360 FILES CLOSED FOR INCOMPLETENESS 6 $69,935 80 $133,470 122 $132,249 26 $67,755 0 $0 16 $116,814 0 $0
Aggregated Statistics For Year 2006(Based on 14 full and 7 partial tracts) A) FHA, FSA/RHS & VA B) Conventional C) Refinancings D) Home Improvement Loans E) Loans on Dwellings For 5+ Families F) Non-occupant Loans on G) Loans On Manufactured Number Average Value Number Average Value Number Average Value Number Average Value Number Average Value Number Average Value Number Average Value
LOANS ORIGINATED 195 $114,180 1,896 $106,614 719 $110,869 265 $37,000 22 $891,190 423 $90,928 28 $39,342 APPLICATIONS APPROVED, NOT ACCEPTED 13 $115,469 402 $101,408 226 $109,362 43 $40,271 0 $0 56 $95,070 9 $39,328 APPLICATIONS DENIED 20 $107,247 612 $95,015 903 $96,830 336 $30,960 3 $654,000 171 $82,775 21 $22,495 APPLICATIONS WITHDRAWN 13 $114,652 337 $108,904 528 $108,037 44 $59,948 0 $0 77 $101,056 2 $23,730 FILES CLOSED FOR INCOMPLETENESS 3 $171,733 87 $117,043 119 $122,132 22 $52,115 0 $0 12 $117,662 1 $64,000
Aggregated Statistics For Year 2005(Based on 14 full and 7 partial tracts) A) FHA, FSA/RHS & VA B) Conventional C) Refinancings D) Home Improvement Loans E) Loans on Dwellings For 5+ Families F) Non-occupant Loans on G) Loans On Manufactured Number Average Value Number Average Value Number Average Value Number Average Value Number Average Value Number Average Value Number Average Value
LOANS ORIGINATED 196 $109,968 1,707 $100,537 934 $108,205 259 $49,561 28 $859,618 366 $93,216 26 $27,877 APPLICATIONS APPROVED, NOT ACCEPTED 14 $99,982 414 $87,832 233 $93,126 72 $50,757 0 $0 52 $111,065 20 $30,683 APPLICATIONS DENIED 27 $107,774 563 $93,296 1,168 $92,142 349 $43,111 0 $0 162 $83,468 41 $38,680 APPLICATIONS WITHDRAWN 19 $105,670 312 $105,805 636 $113,159 173 $204,276 3 $813,110 69 $94,684 1 $16,350 FILES CLOSED FOR INCOMPLETENESS 7 $103,243 59 $104,999 291 $107,639 7 $53,369 0 $0 20 $102,116 0 $0
Aggregated Statistics For Year 2004(Based on 14 full and 7 partial tracts) A) FHA, FSA/RHS & VA B) Conventional C) Refinancings D) Home Improvement Loans E) Loans on Dwellings For 5+ Families F) Non-occupant Loans on G) Loans On Manufactured Number Average Value Number Average Value Number Average Value Number Average Value Number Average Value Number Average Value Number Average Value
LOANS ORIGINATED 234 $97,504 1,337 $100,977 1,135 $95,969 213 $41,138 39 $1,100,725 326 $94,474 26 $24,022 APPLICATIONS APPROVED, NOT ACCEPTED 16 $96,024 268 $88,605 273 $87,315 51 $44,361 1 $575,000 44 $90,922 22 $35,249 APPLICATIONS DENIED 56 $88,904 392 $80,271 1,058 $88,710 279 $34,038 2 $154,500 105 $123,396 58 $33,689 APPLICATIONS WITHDRAWN 41 $92,158 195 $104,474 644 $92,781 44 $54,933 1 $84,000 48 $92,807 7 $63,999 FILES CLOSED FOR INCOMPLETENESS 7 $110,144 34 $108,127 319 $100,233 15 $49,711 0 $0 11 $103,523 0 $0
Aggregated Statistics For Year 2003(Based on 14 full and 7 partial tracts) A) FHA, FSA/RHS & VA B) Conventional C) Refinancings D) Home Improvement Loans E) Loans on Dwellings For 5+ Families F) Non-occupant Loans on Number Average Value Number Average Value Number Average Value Number Average Value Number Average Value Number Average Value
LOANS ORIGINATED 251 $94,127 1,073 $100,395 1,698 $95,977 141 $26,614 18 $379,417 258 $89,253 APPLICATIONS APPROVED, NOT ACCEPTED 20 $83,222 188 $95,464 305 $93,318 34 $28,852 0 $0 35 $81,994 APPLICATIONS DENIED 40 $98,434 264 $90,822 1,052 $82,475 201 $20,935 0 $0 77 $71,212 APPLICATIONS WITHDRAWN 54 $88,481 143 $100,884 677 $91,066 14 $26,951 0 $0 32 $81,206 FILES CLOSED FOR INCOMPLETENESS 6 $107,923 34 $105,453 89 $93,711 8 $49,005 0 $0 12 $93,407
Aggregated Statistics For Year 2002(Based on 10 full and 4 partial tracts) A) FHA, FSA/RHS & VA B) Conventional C) Refinancings D) Home Improvement Loans E) Loans on Dwellings For 5+ Families F) Non-occupant Loans on Number Average Value Number Average Value Number Average Value Number Average Value Number Average Value Number Average Value
LOANS ORIGINATED 147 $84,721 672 $91,864 632 $93,630 91 $21,038 12 $795,203 137 $78,501 APPLICATIONS APPROVED, NOT ACCEPTED 10 $94,851 83 $70,790 127 $91,544 21 $34,928 1 $146,000 19 $56,121 APPLICATIONS DENIED 25 $86,980 215 $66,983 352 $64,357 74 $20,458 2 $382,500 36 $50,883 APPLICATIONS WITHDRAWN 18 $82,538 68 $86,812 257 $80,625 14 $22,076 0 $0 18 $85,994 FILES CLOSED FOR INCOMPLETENESS 2 $51,785 23 $100,980 64 $79,768 3 $36,333 0 $0 2 $43,000
Aggregated Statistics For Year 2001(Based on 10 full and 4 partial tracts) A) FHA, FSA/RHS & VA B) Conventional C) Refinancings D) Home Improvement Loans E) Loans on Dwellings For 5+ Families F) Non-occupant Loans on Number Average Value Number Average Value Number Average Value Number Average Value Number Average Value Number Average Value
LOANS ORIGINATED 173 $80,906 570 $83,779 457 $84,169 92 $18,427 18 $581,559 107 $79,815 APPLICATIONS APPROVED, NOT ACCEPTED 7 $72,734 110 $56,491 99 $87,132 11 $17,971 2 $313,500 16 $55,486 APPLICATIONS DENIED 12 $102,505 279 $51,916 383 $69,114 77 $18,119 1 $607,720 45 $60,364 APPLICATIONS WITHDRAWN 16 $82,868 60 $73,597 242 $66,860 20 $22,522 0 $0 30 $70,852 FILES CLOSED FOR INCOMPLETENESS 2 $59,000 18 $87,944 43 $68,465 0 $0 0 $0 3 $48,000
Aggregated Statistics For Year 2000(Based on 10 full and 4 partial tracts) A) FHA, FSA/RHS & VA B) Conventional C) Refinancings D) Home Improvement Loans E) Loans on Dwellings For 5+ Families F) Non-occupant Loans on Number Average Value Number Average Value Number Average Value Number Average Value Number Average Value Number Average Value
LOANS ORIGINATED 137 $72,711 499 $83,045 202 $73,146 111 $19,800 18 $538,432 85 $66,666 APPLICATIONS APPROVED, NOT ACCEPTED 21 $55,155 83 $56,408 82 $87,532 21 $29,184 1 $175,000 13 $34,935 APPLICATIONS DENIED 23 $63,847 312 $53,966 210 $55,473 90 $14,712 0 $0 44 $49,143 APPLICATIONS WITHDRAWN 23 $71,991 49 $68,114 98 $55,916 7 $27,284 0 $0 5 $60,076 FILES CLOSED FOR INCOMPLETENESS 2 $46,000 36 $78,039 85 $71,562 2 $30,500 0 $0 10 $49,519
Aggregated Statistics For Year 1999(Based on 12 full and 5 partial tracts) A) FHA, FSA/RHS & VA B) Conventional C) Refinancings D) Home Improvement Loans E) Loans on Dwellings For 5+ Families F) Non-occupant Loans on Number Average Value Number Average Value Number Average Value Number Average Value Number Average Value Number Average Value
LOANS ORIGINATED 223 $71,483 748 $77,368 478 $74,950 228 $14,484 19 $319,977 160 $73,123 APPLICATIONS APPROVED, NOT ACCEPTED 8 $67,529 130 $48,375 127 $73,235 24 $15,220 0 $0 20 $59,427 APPLICATIONS DENIED 28 $62,997 593 $47,154 271 $66,282 223 $8,215 2 $283,230 62 $53,510 APPLICATIONS WITHDRAWN 21 $65,395 89 $68,288 233 $68,232 22 $18,348 1 $4,920 13 $99,715 FILES CLOSED FOR INCOMPLETENESS 8 $65,111 23 $76,526 100 $64,606 7 $14,266 0 $0 11 $69,472
Detailed mortgage data for all 21 tracts in McAllen, TX
Private Mortgage Insurance Companies Aggregated Statistics For Year 2009(Based on 12 full and 7 partial tracts) A) Conventional B) Refinancings C) Non-occupant Loans on Number Average Value Number Average Value Number Average Value
LOANS ORIGINATED 68 $170,777 25 $191,594 0 $0 APPLICATIONS APPROVED, NOT ACCEPTED 25 $157,782 12 $171,478 2 $77,430 APPLICATIONS DENIED 17 $164,749 9 $159,956 4 $171,535 APPLICATIONS WITHDRAWN 5 $159,684 3 $239,180 0 $0 FILES CLOSED FOR INCOMPLETENESS 0 $0 1 $83,000 0 $0
Aggregated Statistics For Year 2008(Based on 13 full and 7 partial tracts) A) Conventional B) Refinancings C) Non-occupant Loans on Number Average Value Number Average Value Number Average Value
LOANS ORIGINATED 231 $137,162 40 $160,341 24 $93,484 APPLICATIONS APPROVED, NOT ACCEPTED 84 $148,732 26 $175,080 10 $114,602 APPLICATIONS DENIED 16 $121,698 5 $178,800 9 $119,364 APPLICATIONS WITHDRAWN 7 $127,646 2 $189,500 2 $84,000 FILES CLOSED FOR INCOMPLETENESS 5 $140,806 0 $0 2 $115,000
Aggregated Statistics For Year 2007(Based on 13 full and 7 partial tracts) A) Conventional B) Refinancings C) Non-occupant Loans on Number Average Value Number Average Value Number Average Value
LOANS ORIGINATED 453 $133,661 66 $149,241 56 $108,901 APPLICATIONS APPROVED, NOT ACCEPTED 55 $129,137 23 $156,819 8 $137,971 APPLICATIONS DENIED 8 $128,048 4 $108,140 3 $172,523 APPLICATIONS WITHDRAWN 17 $150,328 4 $151,625 1 $196,800 FILES CLOSED FOR INCOMPLETENESS 2 $91,580 0 $0 1 $71,440
Aggregated Statistics For Year 2006(Based on 14 full and 7 partial tracts) A) Conventional B) Refinancings C) Non-occupant Loans on Number Average Value Number Average Value Number Average Value
LOANS ORIGINATED 308 $128,706 37 $158,156 43 $102,548 APPLICATIONS APPROVED, NOT ACCEPTED 63 $142,031 13 $133,349 7 $108,857 APPLICATIONS DENIED 2 $156,270 0 $0 1 $185,000 APPLICATIONS WITHDRAWN 14 $88,400 2 $217,675 2 $67,000 FILES CLOSED FOR INCOMPLETENESS 3 $101,333 1 $89,000 0 $0
Aggregated Statistics For Year 2005(Based on 14 full and 7 partial tracts) A) Conventional B) Refinancings C) Non-occupant Loans on Number Average Value Number Average Value Number Average Value
LOANS ORIGINATED 376 $115,638 62 $117,965 45 $83,462 APPLICATIONS APPROVED, NOT ACCEPTED 52 $120,336 16 $142,909 9 $138,222 APPLICATIONS DENIED 6 $156,565 0 $0 1 $81,000 APPLICATIONS WITHDRAWN 12 $124,689 3 $147,140 1 $55,000 FILES CLOSED FOR INCOMPLETENESS 4 $90,750 0 $0 1 $121,000
Aggregated Statistics For Year 2004(Based on 14 full and 7 partial tracts) A) Conventional B) Refinancings C) Non-occupant Loans on Number Average Value Number Average Value Number Average Value
LOANS ORIGINATED 380 $111,929 125 $121,837 36 $89,862 APPLICATIONS APPROVED, NOT ACCEPTED 57 $121,055 37 $117,114 8 $103,469 APPLICATIONS DENIED 2 $46,625 2 $313,245 0 $0 APPLICATIONS WITHDRAWN 12 $103,327 6 $86,258 3 $58,500 FILES CLOSED FOR INCOMPLETENESS 2 $65,585 0 $0 1 $56,000
Aggregated Statistics For Year 2003(Based on 14 full and 7 partial tracts) A) Conventional B) Refinancings C) Non-occupant Loans on Number Average Value Number Average Value Number Average Value
LOANS ORIGINATED 406 $103,989 231 $106,633 32 $80,634 APPLICATIONS APPROVED, NOT ACCEPTED 69 $107,585 35 $102,287 12 $70,862 APPLICATIONS DENIED 7 $111,637 3 $87,913 2 $72,220 APPLICATIONS WITHDRAWN 18 $92,978 12 $109,228 3 $39,333 FILES CLOSED FOR INCOMPLETENESS 1 $73,000 0 $0 0 $0
Aggregated Statistics For Year 2002(Based on 10 full and 4 partial tracts) A) Conventional B) Refinancings C) Non-occupant Loans on Number Average Value Number Average Value Number Average Value
LOANS ORIGINATED 194 $101,477 73 $115,022 12 $74,598 APPLICATIONS APPROVED, NOT ACCEPTED 28 $88,815 11 $121,483 2 $57,235 APPLICATIONS DENIED 6 $108,833 2 $127,000 1 $47,000 APPLICATIONS WITHDRAWN 10 $73,691 4 $113,295 1 $72,000 FILES CLOSED FOR INCOMPLETENESS 4 $115,352 1 $49,370 0 $0
Aggregated Statistics For Year 2001(Based on 9 full and 4 partial tracts) A) Conventional B) Refinancings C) Non-occupant Loans on Number Average Value Number Average Value Number Average Value
LOANS ORIGINATED 177 $89,404 46 $115,777 9 $86,333 APPLICATIONS APPROVED, NOT ACCEPTED 22 $104,226 7 $124,921 4 $69,088 APPLICATIONS DENIED 5 $64,122 1 $265,000 0 $0 APPLICATIONS WITHDRAWN 9 $108,696 3 $96,843 0 $0 FILES CLOSED FOR INCOMPLETENESS 3 $76,650 0 $0 0 $0
Aggregated Statistics For Year 2000(Based on 10 full and 4 partial tracts) A) Conventional B) Refinancings C) Non-occupant Loans on Number Average Value Number Average Value Number Average Value
LOANS ORIGINATED 152 $88,991 27 $82,762 6 $54,167 APPLICATIONS APPROVED, NOT ACCEPTED 21 $116,302 5 $91,732 0 $0 APPLICATIONS DENIED 5 $107,806 1 $169,000 0 $0 APPLICATIONS WITHDRAWN 5 $125,494 1 $93,000 0 $0 FILES CLOSED FOR INCOMPLETENESS 4 $67,750 3 $102,457 1 $69,000
Aggregated Statistics For Year 1999(Based on 11 full and 5 partial tracts) A) Conventional B) Refinancings C) Non-occupant Loans on Number Average Value Number Average Value Number Average Value
LOANS ORIGINATED 197 $95,749 51 $98,133 9 $65,009 APPLICATIONS APPROVED, NOT ACCEPTED 14 $69,107 5 $135,336 0 $0 APPLICATIONS DENIED 17 $94,201 7 $97,483 1 $49,000 APPLICATIONS WITHDRAWN 5 $77,380 1 $252,110 0 $0 FILES CLOSED FOR INCOMPLETENESS 4 $60,232 2 $70,785 0 $0
Fire-safe hotels and motels in McAllen, Texas:
La Quinta Inn #1111 Mcallen, 1100 S 10TH St, Mcallen, Texas 78501 Phone: (956) 687-1101, Fax: (956) 687-9265
Drury Inn McAllen, 612 W Exprwy 83, McAllen, Texas 78501 Phone: (956) 687-5100
Hampton Inn Mcallen, 300 W Expy 83, Mcallen, Texas 78501 Phone: (956) 682-4900, Fax: (956) 682-6823
Clarion Inn - McAllen, 1401 S 10TH St, McAllen, Texas 78501 Phone: (956) 682-8301, Fax: (956) 630-1212
Wingate Inn, 1500 Wichita Ave, Mcallen, Texas 78503 Phone: (956) 632-2000
Howard Johnson Plaza, 2721 S 10th St, Mcallen, Texas 78503 Phone: (956) 984-7900, Fax: (956) 984-7997
Residence Inn Mcallen, 220 West Expy 83, Mcallen, Texas 78501 Phone: (956) 994-8626, Fax: (956) 994-8627
Texas Inn Downtown McAllen Near Airport / Mall, 1420 E Jackson Ave, McAllen, Texas 78503 Phone: (956) 682-1190, Fax: (956) 682-1190
21 other hotels and motels
All 29 fire-safe hotels and motels in McAllen, Texas
Most common first names in McAllen, TX among deceased individuals Name Count Lived (average)
Maria 659 76.3 years Jose 422 71.8 years William 209 75.2 years Guadalupe 203 76.7 years John 186 76.1 years Juan 177 69.4 years Mary 163 80.7 years Robert 145 72.4 years Jesus 137 71.5 years James 134 74.6 years
Most common last names in McAllen, TX among deceased individuals Last name Count Lived (average)
Garcia 368 73.8 years Garza 336 74.1 years Gonzalez 334 74.8 years Rodriguez 281 73.1 years Martinez 265 73.5 years Salinas 159 73.4 years Cantu 145 73.2 years Ramirez 145 71.6 years Flores 140 73.7 years Hernandez 137 71.0 years
McAllen compared to Texas state average:
Median house value below state average. Unemployed percentage below state average. Black race population percentage significantly below state average. Hispanic race population percentage significantly above state average. Foreign-born population percentage above state average. Percentage of population with a bachelor's degree or higher above state average.
#5 on the list of "Top 101 cities with the largest city-data.com crime index decrease from 2002 to 2012 (population 50,000+)"
#12 on the list of "Top 101 cities with largest percentage of males in occupations: health technologists and technicians (population 50,000+)"
#12 on the list of "Top 101 cities with the lowest number of rapes per 100,000 residents (population 50,000+)"
#16 on the list of "Top 101 cities with largest percentage of females in occupations: education, training, and library occupations (population 50,000+)"
#23 on the list of "Top 101 cities with the lowest percentage of English-only speaking households, population 50,000+"
#25 on the list of "Top 101 cities with the largest city-data.com crime index decrease from 2011 to 2012 (population 50,000+)"
#30 on the list of "Top 101 cities with the largest percentage of people in military hospitals or wards for chronically ill (population 1,000+)"
#31 on the list of "Top 101 cities with largest percentage of males in occupations: building and grounds cleaning and maintenance occupations (population 50,000+)"
#38 on the list of "Top 101 cities with the hottest summers (population 50,000+)"
#39 on the list of "Top 101 cities with the highest average humidity (population 50,000+)"
#42 on the list of "Top 101 cities with largest percentage of males in occupations: law enforcement workers including supervisors (population 50,000+)"
#46 on the list of "Top 101 cities with the largest wind speed differences during a year (population 50,000+)"
#48 on the list of "Top 101 cities with the highest percentage of family households, population 100,000+"
#52 on the list of "Top 101 cities with the highest average temperatures (population 50,000+)"
#57 on the list of "Top 101 cities with the smallest percentage of high school students in private schools (3,000+ students)"
#59 on the list of "Top 100 least racially diverse cities (pop. 50,000+)"
#60 on the list of "Top 101 cities with the highest daily high temperatures (population 50,000+)"
#62 on the list of "Top 101 cities with the largest house values disparities (population 50,000+)"
#67 on the list of "Top 101 cities with the highest average wind speeds (population 50,000+)"
#67 on the list of "Top 101 cities with largest percentage of females in industries: educational services (population 50,000+)"
#4 on the list of "Top 101 counties with the worst general health status score of residents (1-5), 3 years of data"
#4 on the list of "Top 101 counties with the highest number of births per 1000 residents 2007-2013"
#5 on the list of "Top 101 counties with the lowest percentage of residents relocating to other counties in 2011"
#7 on the list of "Top 101 counties with the lowest percentage of residents that smoked 100+ cigarettes in their lives"
#8 on the list of "Top 101 counties with the lowest percentage of residents that exercised in the past month"
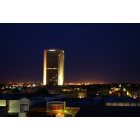
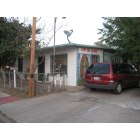

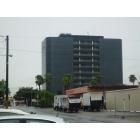
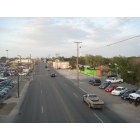
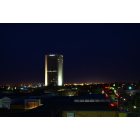

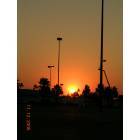


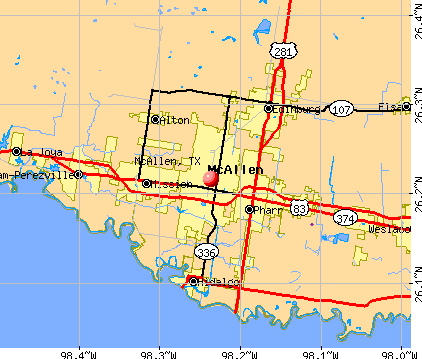


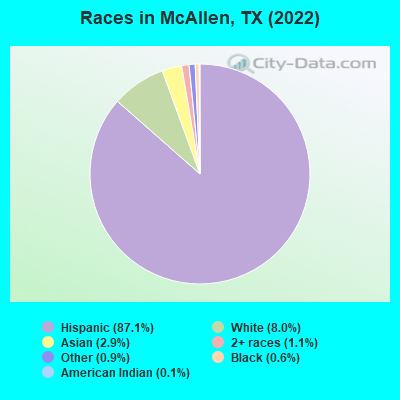
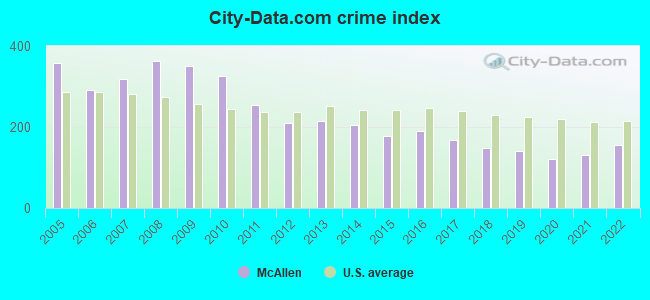
 Recent articles from our blog. Our writers, many of them Ph.D. graduates or candidates, create easy-to-read articles on a wide variety of topics.


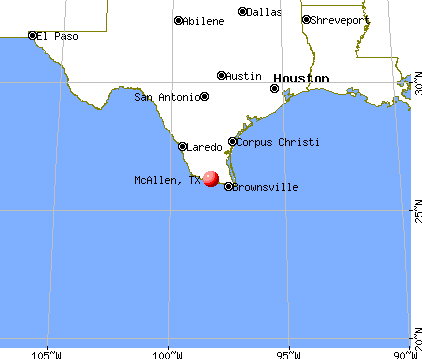
 (117.5 miles
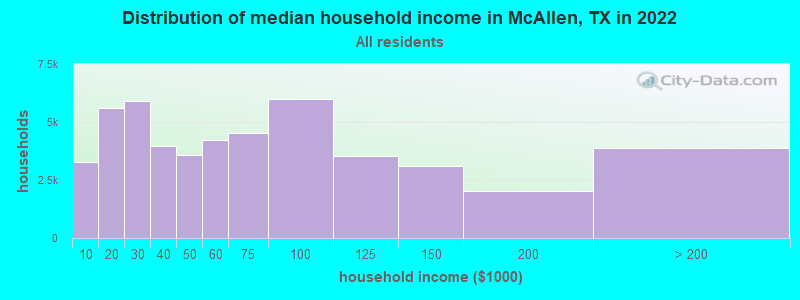
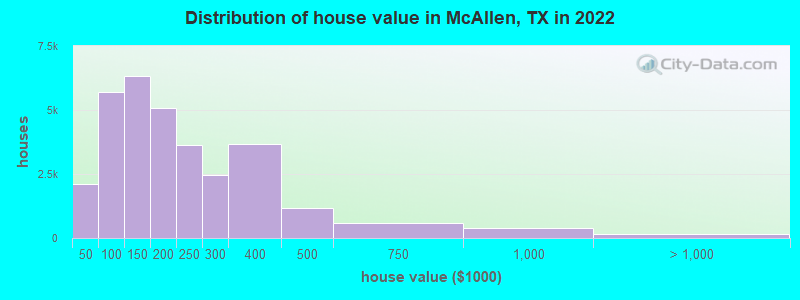
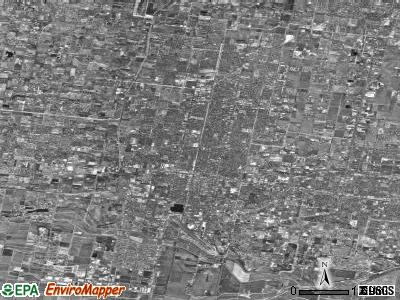
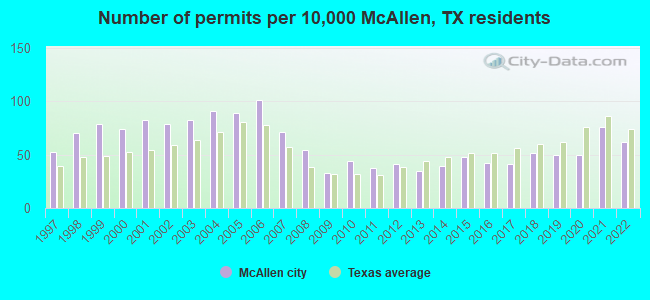
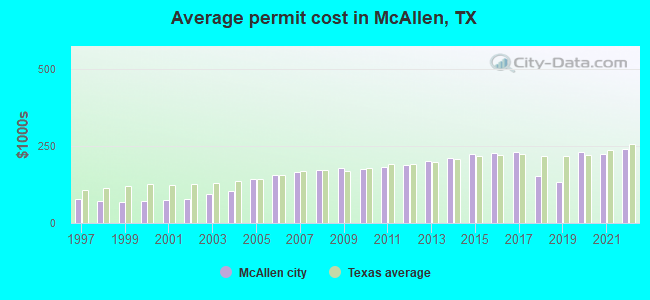
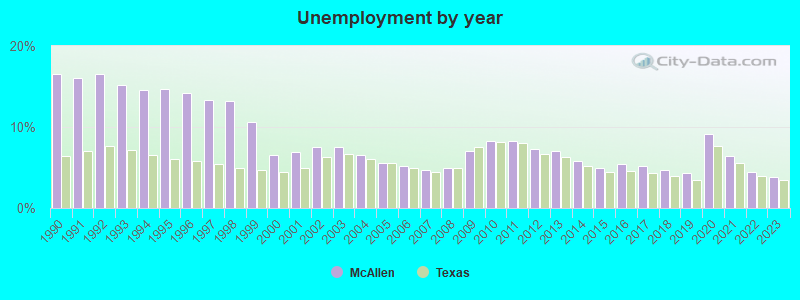
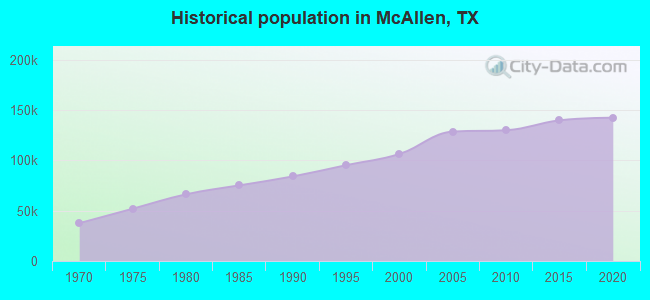
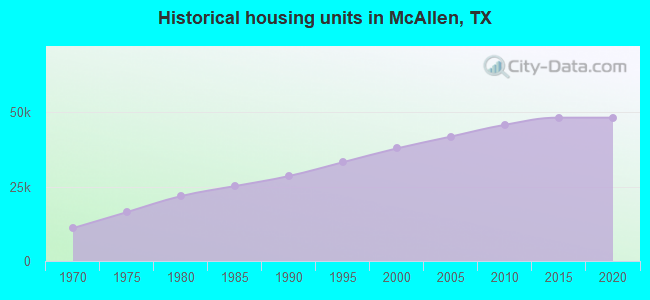
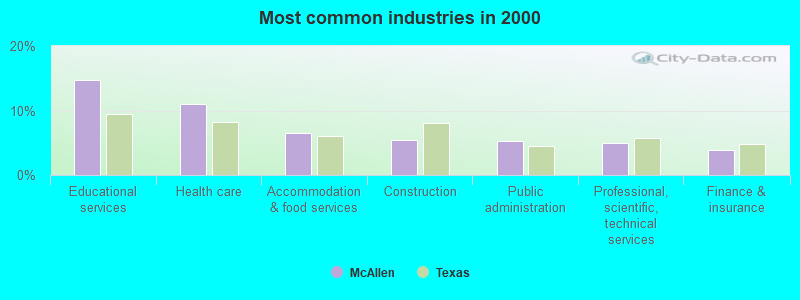
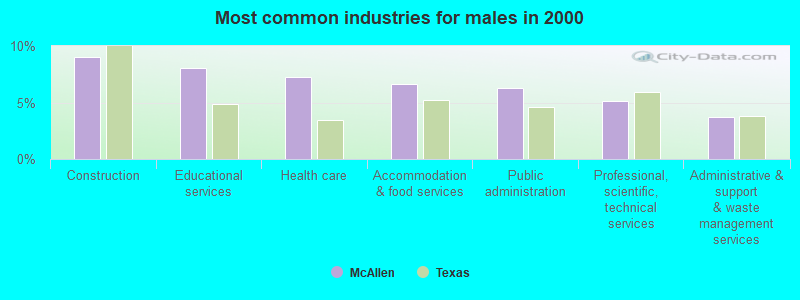
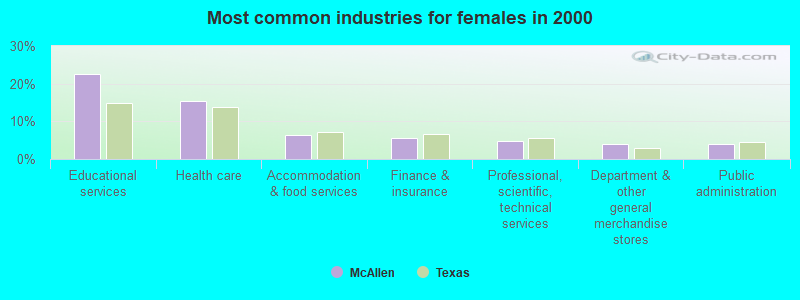
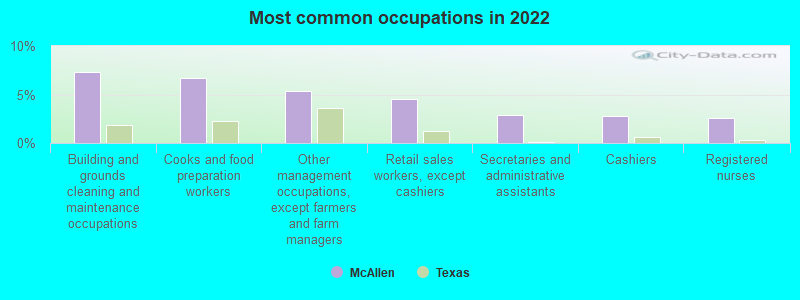
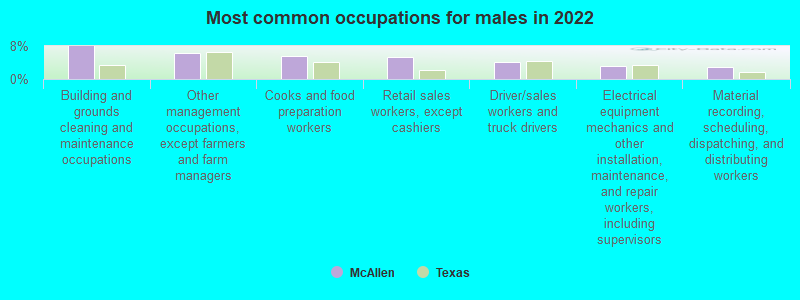
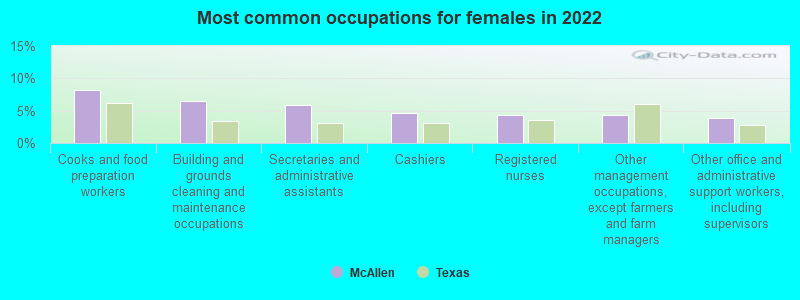
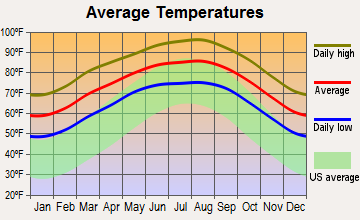

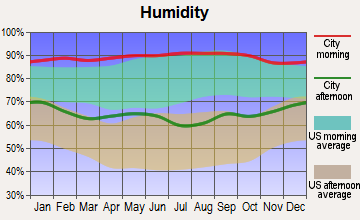
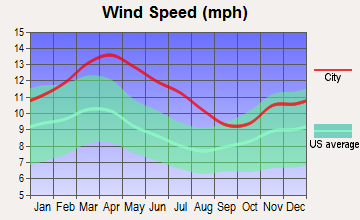
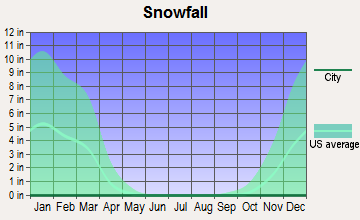

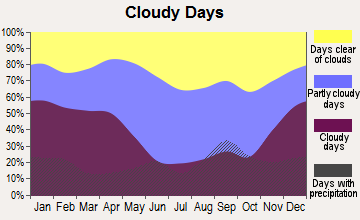
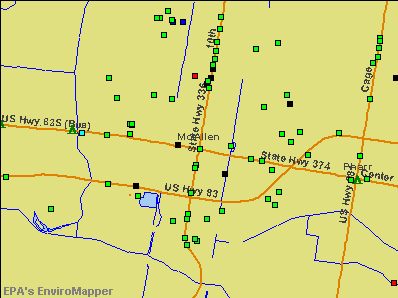

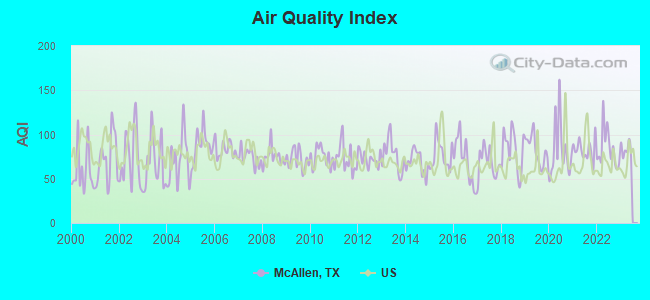
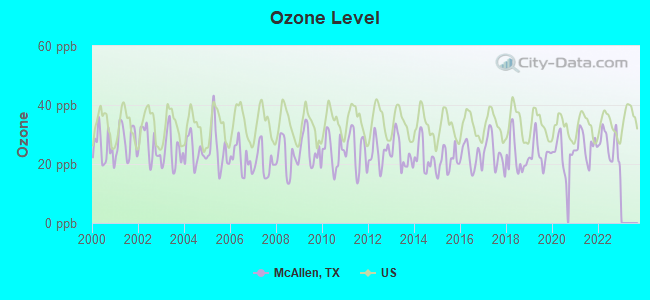
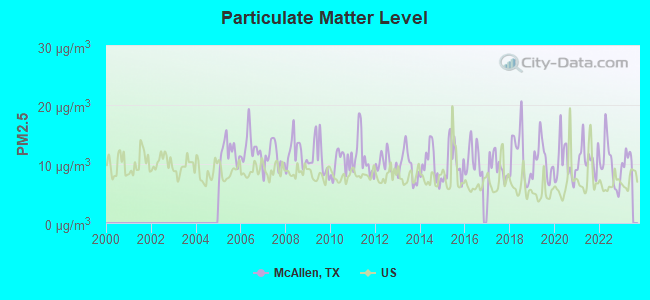

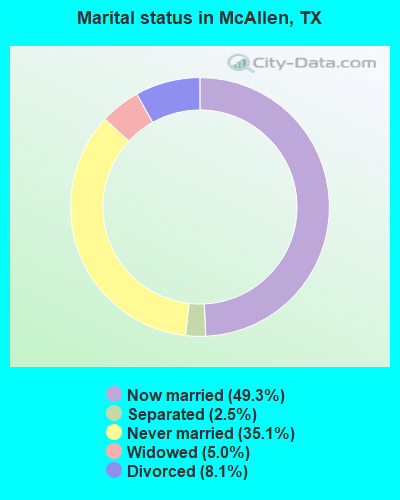
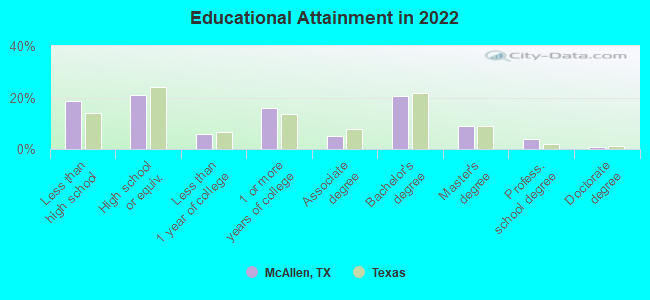
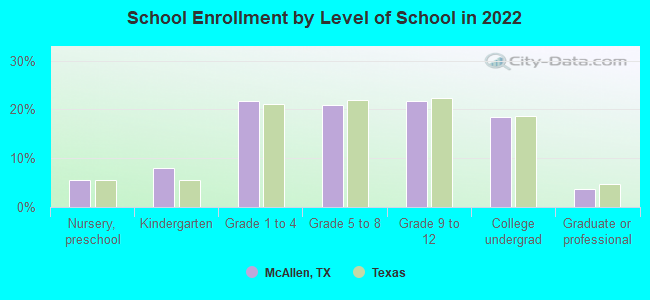
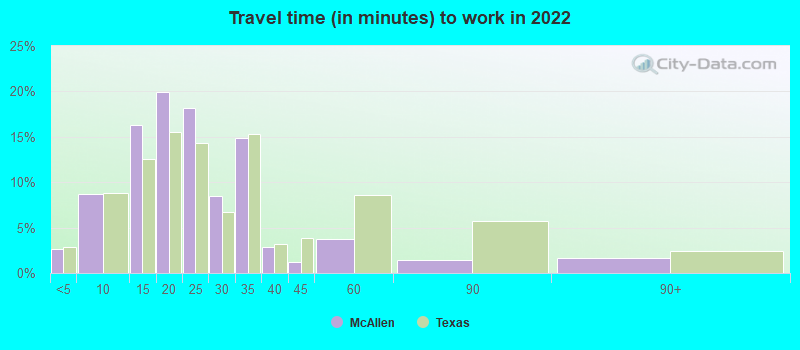
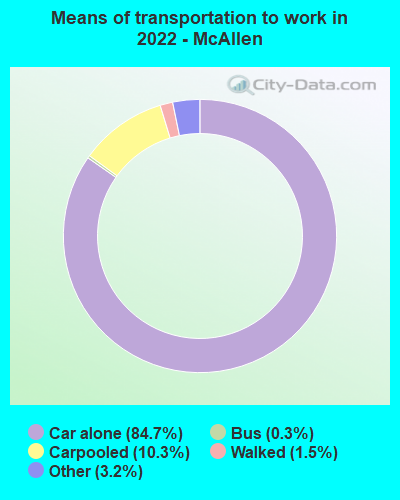
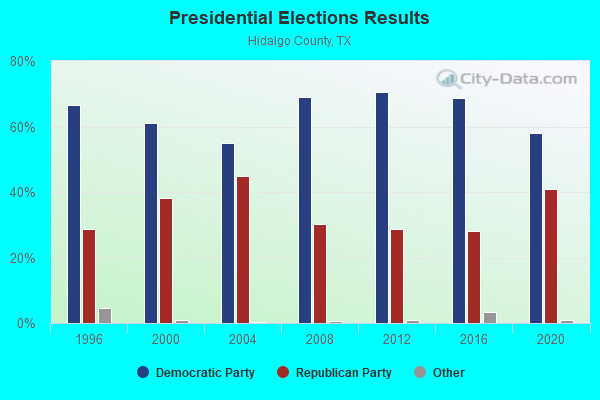
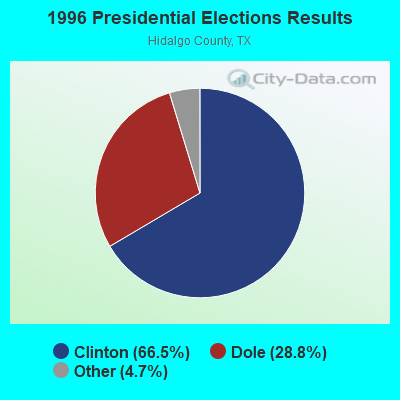
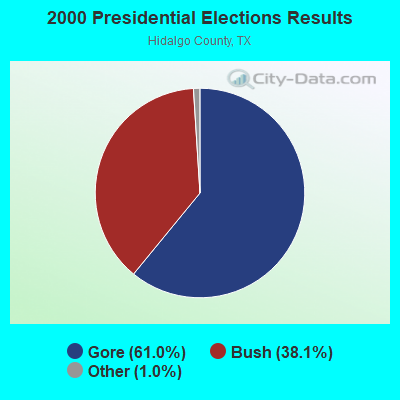
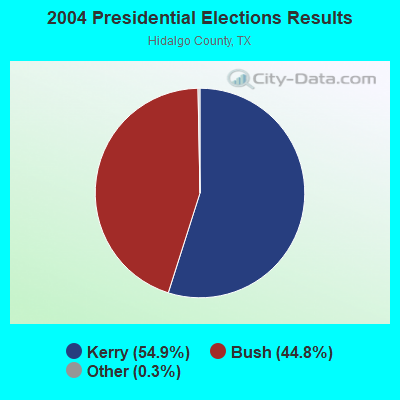
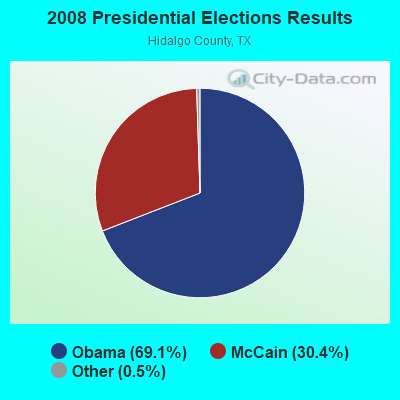
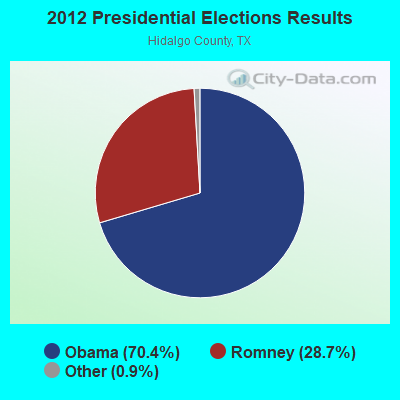
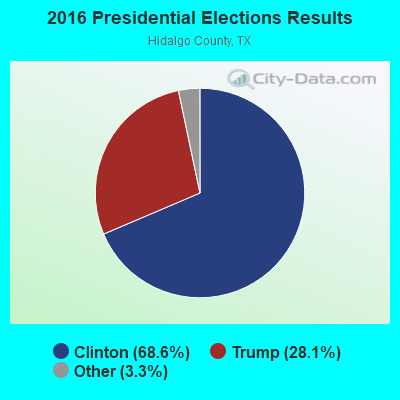
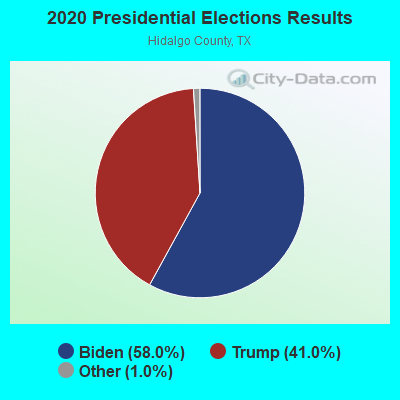
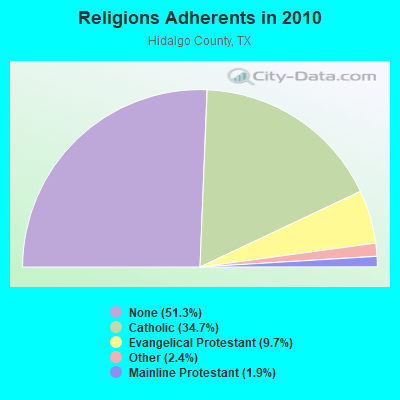
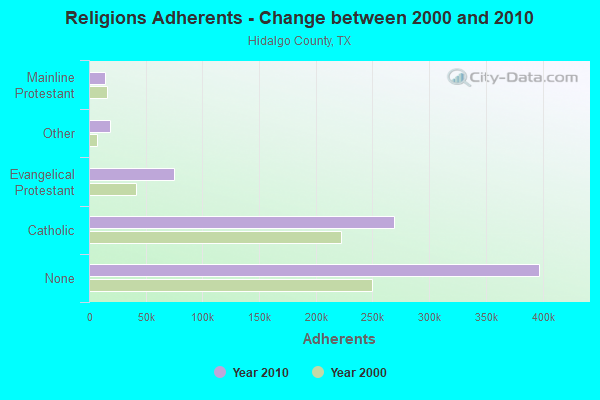
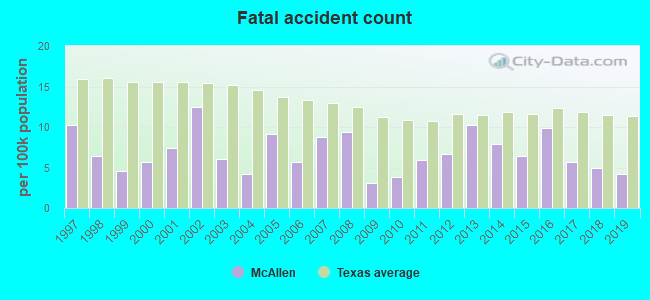
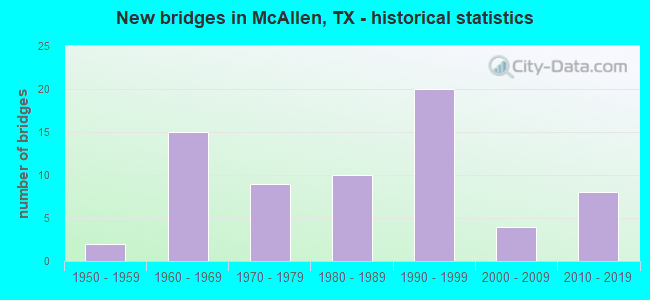
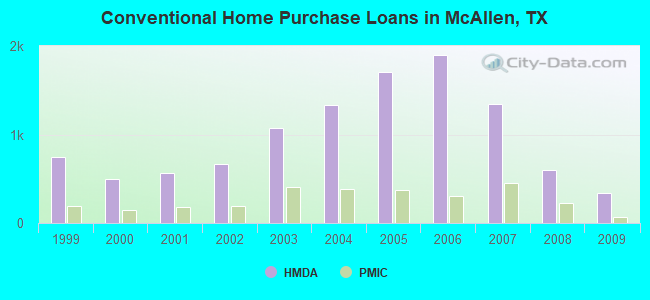
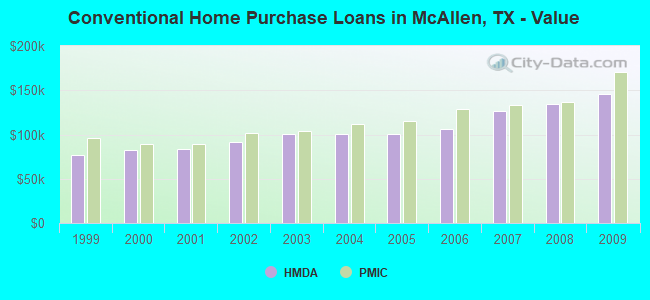
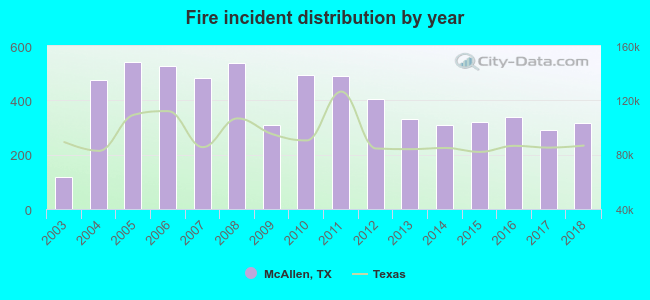 Based on the data from the years 2003 - 2018 the average number of fires per year is 393. The highest number of fire incidents - 541 took place in 2005, and the least - 119 in 2003. The data has a rising trend.
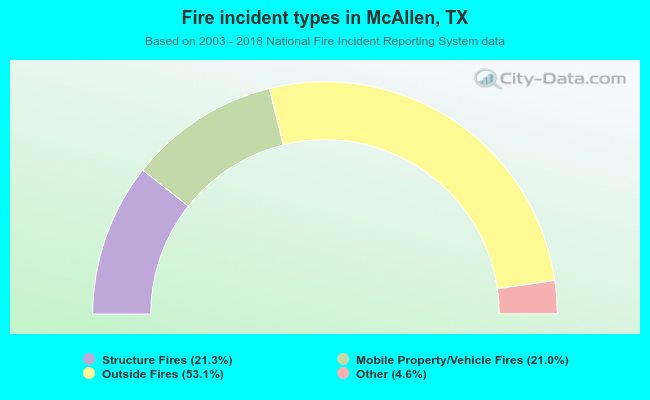 When looking into fire subcategories, the most reports belonged to: Outside Fires (53.1%), and Structure Fires (21.3%).