McFarland, CA (California) Houses and Residents
| McFarland: | $274,339 |
| California: | $715,900 |
Mean price in 2022:
Detached houses: $236,992
Here: $236,992 State: $988,808 Townhouses or other attached units: $161,458
Here: $161,458 State: $838,546 In 2-unit structures: $159,307
Here: $159,307 State: $1,138,100
Total population: 13,605 (Urban population: 9,511 (all inside urban clusters), Rural population: 6 (all farm))
Houses: 3,600 (3,372 occupied: 1,854 owner occupied, 1,540 renter occupied)
| % of renters here: | 45% |
| State: | 44% |
Housing density: 1,749 houses/condos per square mile
Median price asked for vacant for-sale houses and condos in 2022 in this county: $350,791.
Median contract rent in 2022: $799 (lower quartile is $663, upper quartile is $976)
Median rent asked for vacant for-rent units in 2022: $1,174
Median gross rent in McFarland, CA in 2022: $1,065
Housing units in McFarland with a mortgage: 1,138 (13 second mortgage, 0 home equity loan, 12 both second mortgage and home equity loan)
Houses without a mortgage: 0
Median household income for houses/condos with a mortgage: $55,934
Median household income for apartments without a mortgage: $38,340
Median monthly housing costs: $1,061
Compare current foreclosures near McFarland, CA:
| Photo | Address | Area | Beds / Baths | Price | Details |
|---|---|---|---|---|---|

|
#1
N Mariposa Rd
Earlimart, CA 93219
|
1,232 sq. feet
|
2 baths 4 beds |
show details | |

|
#2
13th Ave
Delano, CA 93215
|
1,324 sq. feet
|
1 baths 2 beds |
show details | |

|
#3
18th Ave
Delano, CA 93215
|
1,553 sq. feet
|
2 baths 4 beds |
show details | |

|
#4
Buenaventura St
Wasco, CA 93280
|
1,440 sq. feet
|
2 baths 3 beds |
show details | |

|
#5
Primrose Ct
Wasco, CA 93280
|
1,363 sq. feet
|
2 baths 4 beds |
show details | |

|
#6
Atlantic Ave
Shafter, CA 93263
|
1,182 sq. feet
|
2 baths 3 beds |
show details | |

|
#7
Appletree Ln
Wasco, CA 93280
|
2,187 sq. feet
|
2 baths 4 beds |
show details | |

|
#8
Oak Creek Ct
Wasco, CA 93280
|
1,301 sq. feet
|
2 baths 3 beds |
show details | |

|
#9
San Marco Ct
Delano, CA 93215
|
2,809 sq. feet
|
3 baths 5 beds |
show details | |

|
#10
College Dr
Delano, CA 93215
|
1,202 sq. feet
|
2 baths 4 beds |
show details |
| Photo | Address | Area | Beds / Baths | Price | Details |
|---|---|---|---|---|---|

|
#11
Cliff Ave
Mc Farland, CA 93250
|
1,040 sq. feet
|
2 baths 3 beds |
show details | |

|
#12
Atlantic Ave
Shafter, CA 93263
|
1,111 sq. feet
|
2 baths 3 beds |
show details | |

|
#13
N Cabrillo Way
Delano, CA 93215
|
1,109 sq. feet
|
2 baths 3 beds |
show details | |

|
#14
Franciscan Plz
Delano, CA 93215
|
1,434 sq. feet
|
2 baths 4 beds |
show details | |

|
#15
Minter Ave
Shafter, CA 93263
|
2,239 sq. feet
|
2 baths 4 beds |
show details | |

|
#16
Hitchcock Ave
Shafter, CA 93263
|
1,594 sq. feet
|
2 baths 4 beds |
show details | |

|
#17
W 13th Ave
Delano, CA 93215
|
955 sq. feet
|
2 baths 3 beds |
show details | |

|
#18
Catalina Pl
Delano, CA 93215
|
1,434 sq. feet
|
2 baths 4 beds |
show details | |

|
#19
7th Ave
Delano, CA 93215
|
1,396 sq. feet
|
2 baths 3 beds |
show details | |

|
#20
Clinton St
Delano, CA 93215
|
858 sq. feet
|
1 baths 2 beds |
show details |
| Photo | Address | Area | Beds / Baths | Price | Details |
|---|---|---|---|---|---|

|
#21
Vasquez Ave
Shafter, CA 93263
|
1,284 sq. feet
|
2 baths 3 beds |
show details | |

|
#22
Curtis Ave
Shafter, CA 93263
|
1,086 sq. feet
|
1 baths 3 beds |
show details | |

|
#23
Taylor Ave
Mc Farland, CA 93250
|
1,126 sq. feet
|
2 baths 4 beds |
show details | |

|
#24
Cherrywood St
Mc Farland, CA 93250
|
1,261 sq. feet
|
2 baths 4 beds |
show details | |

|
#25
Klassen St
Shafter, CA 93263
|
1,368 sq. feet
|
1 baths 3 beds |
show details | |

|
#26
Jeffries St
Shafter, CA 93263
|
- sq. feet
|
- baths - beds |
show details | |

|
#27
Rio Santana Ct
Mc Farland, CA 93250
|
- sq. feet
|
- baths - beds |
show details | |

|
#28
Prairie Rose Way
Wasco, CA 93280
|
- sq. feet
|
- baths - beds |
show details | |

|
#29
Chaparral Dr
Delano, CA 93215
|
- sq. feet
|
- baths - beds |
show details | |

|
#30
Kensington St
Delano, CA 93215
|
- sq. feet
|
- baths - beds |
show details |
| Photo | Address | Area | Beds / Baths | Price | Details |
|---|---|---|---|---|---|

|
#31
Belmont St Apt 41
Delano, CA 93215
|
- sq. feet
|
- baths - beds |
show details | |

|
#32
Belmont St Apt 67
Delano, CA 93215
|
- sq. feet
|
- baths - beds |
show details | |

|
#33
W Sherwood Ave Apt 4
Mc Farland, CA 93250
|
- sq. feet
|
- baths - beds |
show details | |

|
#34
18th Ave Apt A
Delano, CA 93215
|
- sq. feet
|
- baths - beds |
show details | |

|
Check over 1 million property listings on Foreclosure.com!
|
browse all offers | |||

Latest news about housing in McFarland, CA collected exclusively by city-data.com from local newspapers, TV, and radio stations

 | Stratus Dance Club 1978-1987 (20 replies) |
| LOL @ Studio City. (176 replies) |
| Bakersfield is bad compared to what? (81 replies) |
| Reasons to love Central CA-Monterey to SB County, Madera to Kern County (0 replies) |
| Nonwhite youth population growing in California and nation, report finds (30 replies) |
| Worst Performing Schools in California 2010 (5 replies) |

Median year apartment built: 1989
Household type by relationship:
Households: 14,113- Male householders: 1,647 (164 living alone), Female householders: 1,709 (311 living alone)
1,683 spouses (1,656 opposite-sex spouses), 212 unmarried partners, (212 opposite-sex unmarried partners), 6,277 children (6,072 natural, 61 adopted, 143 stepchildren), 530 grandchildren, 402 brothers or sisters, 216 parents, 0 foster children, 578 other relatives, 147 non-relatives
- In group quarters: 708
Size of family households: 450 2-persons, 424 3-persons, 842 4-persons, 650 5-persons, 281 6-persons, 235 7-or-more-persons.
Size of nonfamily households: 476 1-person, 35 2-persons.
2,531 married couples with children.
1,629 single-parent households (341 men, 1,288 women).
26.7% of residents of McFarland speak English at home.
68.8% of residents speak Spanish at home (45% speak English very well, 27% speak English well, 15% speak English not well, 13% don't speak English at all).
0.3% of residents speak Asian or Pacific Island language at home (86% speak English very well, 14% speak English not well).
Foreign born population: 4,024 (28.5%)
(26.5% of them are naturalized citizens)
| Here: | 5.3 |
| State: | 6.0 |
| Here: | 4.6 |
| State: | 3.9 |

- Bedrooms in owner-occupied houses and condos in McFarland, California
- 0no bedroom
- 01 bedroom
- 2702 bedrooms
- 9213 bedrooms
- 5824 bedrooms
- 825+ bedrooms

- Bedrooms in renter-occupied apartments in McFarland, California
- 0no bedroom
- 1531 bedroom
- 4922 bedrooms
- 6613 bedrooms
- 2344 bedrooms
- 05+ bedrooms

- Cars and other vehicles available in McFarland in owner-occupied houses/condos
- 123no vehicle
- 4621 vehicle
- 5562 vehicles
- 3873 vehicles
- 2544 vehicles
- 735+ vehicles

- Cars and other vehicles available in McFarland in renter-occupied apartments
- 113no vehicle
- 7011 vehicle
- 4532 vehicles
- 1803 vehicles
- 944 vehicles
- 05+ vehicles

- Rooms in owner-occupied houses in McFarland, California
- 01 room
- 02 rooms
- 573 rooms
- 1874 rooms
- 1,0005 rooms
- 4576 rooms
- 637 rooms
- 668 rooms
- 239+ rooms

- Rooms in renter-occupied apartments in McFarland, California
- 01 room
- 902 rooms
- 1263 rooms
- 4794 rooms
- 5105 rooms
- 2776 rooms
- 547 rooms
- 58 rooms
- 09+ rooms


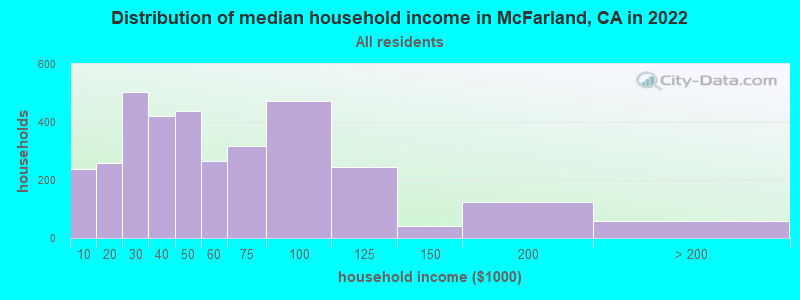
McFarland, CA household income distribution

- 239Less than $10,000
- 258$10,000 to $19,999
- 503$20,000 to $29,999
- 421$30,000 to $39,999
- 437$40,000 to $49,999
- 265$50,000 to $59,999
- 317$60,000 to $74,999
- 472$75,000 to $99,999
- 246$100,000 to $124,999
- 43$125,000 to $149,999
- 125$150,000 to $199,999
- 60$200,000 or more
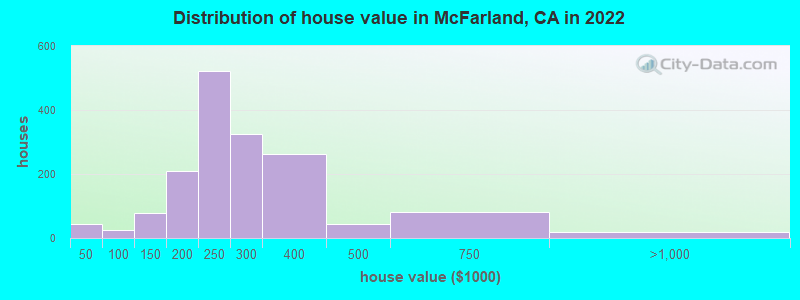
Home value of owner - occupied houses in 2022 in McFarland, CA
-
- 16Less than $10,000
- 2$15,000 to $19,999
- 4$25,000 to $29,999
- 21$40,000 to $49,999
- 2$90,000 to $99,999
- 51$100,000 to $124,999
- 27$125,000 to $149,999
- 115$150,000 to $174,999
- 93$175,000 to $199,999
- 523$200,000 to $249,999
- 325$250,000 to $299,999
- 262$300,000 to $399,999
- 42$400,000 to $499,999
- 81$500,000 to $749,999
- 17$750,000 to $999,999
Rent paid by renters in 2022 in McFarland, CA
-
- 3Less than $100
- 15$300 to $349
- 89$400 to $449
- 42$450 to $499
- 28$500 to $549
- 61$550 to $599
- 17$600 to $649
- 121$650 to $699
- 64$700 to $749
- 216$750 to $799
- 170$800 to $899
- 139$900 to $999
- 158$1,000 to $1,249
- 22$1,250 to $1,499
- 89$1,500 to $1,999
- 176No cash rent


Percentage of workers working in this county: 92.8%
Number of people working at home: 197 (3.8% of all workers)
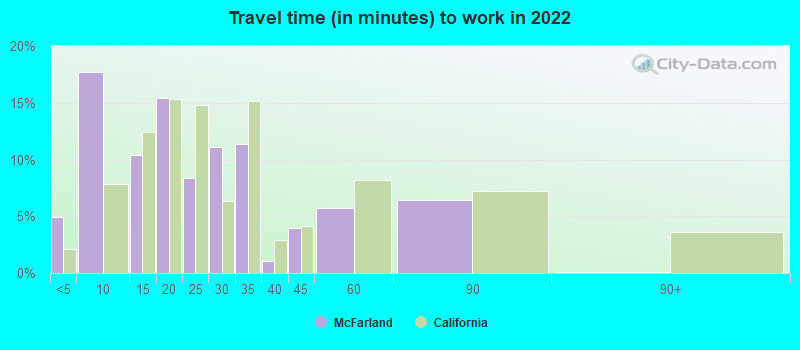
Travel time to work (commute)
- Less than 5 minutes: 173
- 5 to 9 minutes: 559
- 10 to 14 minutes: 736
- 15 to 19 minutes: 1,609
- 20 to 24 minutes: 508
- 25 to 29 minutes: 81
- 30 to 34 minutes: 505
- 35 to 39 minutes: 201
- 40 to 44 minutes: 134
- 45 to 59 minutes: 144
- 60 to 89 minutes: 217
- 90 or more minutes: 94
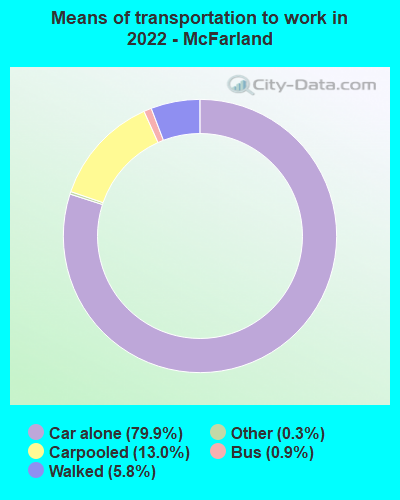
Means of transportation to work:
- Drove a car alone: 1,651 (73.0%)
- Carpooled: 268 (11.8%)
- Bus: 9 (0.4%)
- Taxi: 9 (0.4%)
- Walked: 135 (6.0%)
- Worked at home: 197 (8.7%)

- Unemployment by race in 2022
- Unemployment rate for White non-Hispanic residents
- 3.4%Females
- Unemployment rate for Black residents
- 42.9%Males
- Unemployment rate for other race residents
- 2.8%Males
- 4.2%Females
- Unemployment rate for two or more race residents
- 3.1%Males
- 5.6%Females
- Unemployment rate for Hispanic or Latino residents
- 5.3%Males
- 5.8%Females

- Year of entry for the foreign-born population in McFarland, California
- 6192010 or later
- 8862000 to 2009
- 1,2891990 to 1999
- 9401980 to 1989
- 8321970 to 1979
- 484Before 1970

First ancestries reported:
- American: 691 (6.0%)
- Danish: 44 (0.4%)
- English: 43 (0.4%)
- Irish: 9 (0.08%)
- Dutch: 8 (0.07%)
- Scottish: 6 (0.05%)
Most common places of birth for foreign-born residents (%):
| McFarland: | 94.9% (3,903) |
| California: | 37.2% (3,881,193) |
Place of birth for U.S.-born residents:
- This state: 9,431
- Other state: 508
- Northeast: 19
- Midwest: 141
- South: 181
- West: 159
98.9% of McFarland residents lived in the same house 1 years ago.
Out of people who lived in different houses, 27.3% lived in this county.
Out of people who lived in different counties, 77.5% lived in California.
| McFarland: | 98.9% |
| State average: | 88.9% |
Education attainment for males 25 years and older:
- No schooling: 278
- Nursery to 4th grade: 258
- 5th and 6th grade: 307
- 7th and 8th grade: 101
- 9th grade: 61
- 10th grade: 126
- 11th grade: 87
- 12th grade, no diploma: 158
- High school graduate (or equivalency): 1,292
- Less than 1 year of college: 37
- Some college more than 1 year, no degree: 513
- Associate degree: 121
- Bachelor's degree: 85
- Master's degree: 31
- Professional school degree: 40
- Doctorate degree: 0

Education attainment for females 25 years and older:
- No schooling: 207
- Nursery to 4th grade: 204
- 5th and 6th grade: 367
- 7th and 8th grade: 175
- 9th grade: 141
- 10th grade: 32
- 11th grade: 132
- 12th grade, no diploma: 144
- High school graduate (or equivalency): 1,130
- Less than 1 year of college: 157
- Some college more than 1 year, no degree: 354
- Associate degree: 216
- Bachelor's degree: 132
- Master's degree: 5
- Professional school degree: 0
- Doctorate degree: 0


Housing units in structures:
- One, detached: 2,933
- One, attached: 103
- Two: 120
- 3 or 4: 119
- 5 to 9: 27
- 10 to 19: 32
- 20 to 49: 39
- 50 or more: 156
- Mobile homes: 66
Housing units lacking complete kitchen facilities in 2022: 1.7%
House/condo owner moved in on average 17 years ago
Renter moved in on average 7 years ago

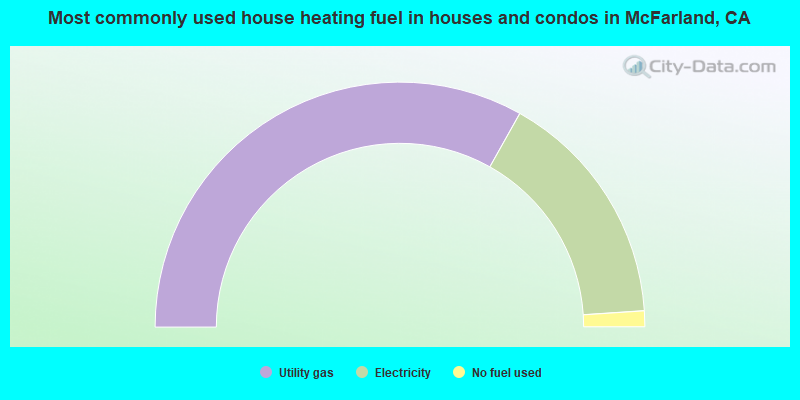
- 66.3%Utility gas
- 31.6%Electricity
- 2.1%No fuel used
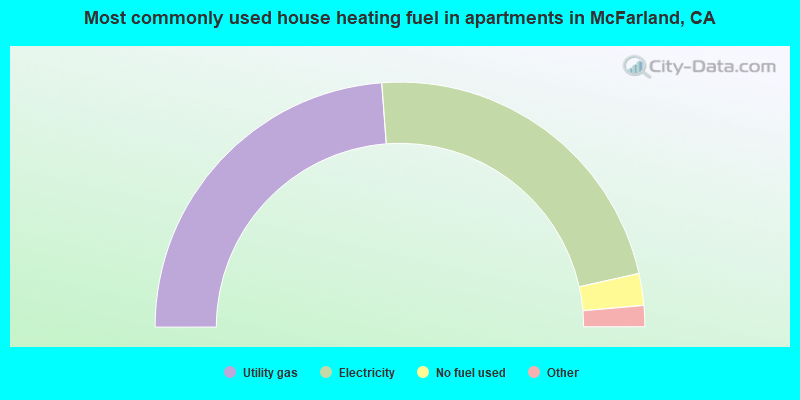
- 47.7%Utility gas
- 45.4%Electricity
- 4.2%No fuel used
- 1.9%Solar energy
- 0.9%Bottled, tank, or LP gas
Private vs. public school enrollment:
| Here: | 1.5% |
| California: | 10.5% |
| Here: | 6.8% |
| California: | 8.5% |
| Here: | 22.2% |
| California: | 15.9% |


