Monroe, LA (Louisiana) Houses and Residents
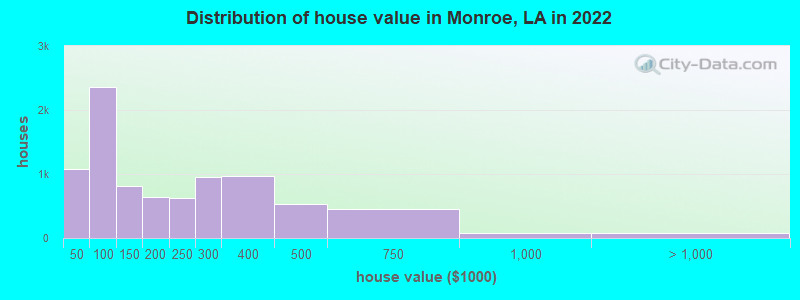
Estimated median house or condo value in 2022: $163,144 (it was $71,000 in 2000 )
Monroe:
$163,144Louisiana:
$209,200
Lower value quartile - upper value quartile: $66,717 - $307,191Mean price in 2022: Detached houses: $276,213 Here:
$276,213State:
$273,555
Townhouses or other attached units: $210,717 Here:
$210,717State:
$297,713
In 2-unit structures: $90,397 Here:
$90,397State:
$325,117
In 3-to-4-unit structures: $210,274 Here:
$210,274State:
$213,088
In 5-or-more-unit structures: $81,108 Here:
$81,108State:
$257,054
Mobile homes: $31,358 Here:
$31,358State:
$89,857
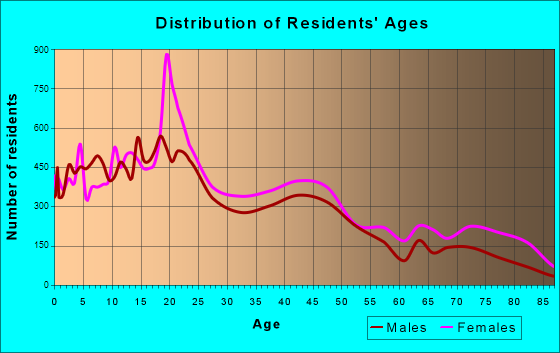
Total population: 49,601 (All urban)
Houses: 21,264 (18,222 occupied: 8,477 owner occupied, 10,541 renter occupied )
% of renters here:
55%State:
32%
Housing density: 741 houses/condos per square mile
Median price asked for vacant for-sale houses and condos in 2022: $202,105.
Median contract rent in 2022: $594 (lower quartile is $418, upper quartile is $769)
Median rent asked for vacant for-rent units in 2022: $707
Median gross rent in Monroe, LA in 2022: $812
Housing units in Monroe with a mortgage: 3,338 (333 second mortgage, 0 home equity loan, 240 both second mortgage and home equity loan )Houses without a mortgage: 15
Median household income for houses/condos with a mortgage: $95,393
Median household income for apartments without a mortgage: $40,103
Median monthly housing costs: $788
Data:
Median house or condo value ($)
Median house or condo value ($ change since 2000)
Median house or condo value ($) - White
Median house or condo value ($) - Black or African American
Median house or condo value ($) - Asian
Median house or condo value ($) - Hispanic or Latino
Median house or condo value ($) - American Indian and Alaska Native
Median house or condo value ($) - Multirace
Median house or condo value ($) - Other Race
Median price asked for mobile homes ($)
Household density (households per square mile)
Mean house or condo value by units in structure - 1, detached ($)
Mean house or condo value by units in structure - 1, attached ($)
Mean house or condo value by units in structure - 2 ($)
Mean house or condo value by units in structure by units in structure - 3 or 4 ($)
Mean house or condo value by units in structure - 5 or more ($)
Mean house or condo value by units in structure - Boat, RV, van, etc. ($)
Mean house or condo value by units in structure - Mobile home ($)
Median contract rent ($)
Median contract rent - Lower quartile ($)
Median contract rent - Upper quartile ($)
Median gross rent ($)
Urban houses (%)
Rural houses (%)
Houses occupied (%)
Houses occupied (% change since 2000)
Houses owner occupied (%)
Houses owner occupied (% change since 2000)
Houses renter occupied (%)
Houses renter occupied (% change since 2000)
Vacant housing units - For rent (%)
Vacant housing units - For rent (% change since 2000)
Vacant housing units - For sale only (%)
Vacant housing units - For sale only (% change since 2000)
Vacant housing units - Rented or sold, not occupied (%)
Vacant housing units - Rented or sold, not occupied (% change since 2000)
Vacant housing units - For seasonal, recreational, or occasional use (%)
Vacant housing units - For seasonal, recreational, or occasional use (% change since 2000)
Vacant housing units - For migrant workers (%)
Vacant housing units - For migrant workers (% change since 2000)
Vacant housing units - Other vacant (%)
Vacant housing units - Other vacant (% change since 2000)
Median monthly housing costs ($)
Median household income for houses/condos with a mortgage ($)
Median household income for houses/condos without a mortgage ($)
Median household income ($)
Median household income ($) - White
Median household income ($) - Black or African American
Median household income ($) - Asian
Median household income ($) - Hispanic or Latino
Median household income ($) - American Indian and Alaska Native
Median household income ($) - Multirace
Median household income ($) - Other Race
Mortgage status - with mortgage (%)
Mortgage status - with second mortgage (%)
Mortgage status - with home equity loan (%)
Mortgage status - with both second mortgage and home equity loan (%)
Mortgage status - without a mortgage (%)
Median year house/condo built
Median year apartment built
Household type by relationship - Male householder living alone (%)
Household type by relationship - Male householder not living alone (%)
Household type by relationship - Female householder living alone (%)
Household type by relationship - Female householder not living alone (%)
Household type by relationship - Opposite-Sex spouse (%)
Household type by relationship - Same-Sex spouse (%)
Household type by relationship - Opposite-Sex unmarried partner (%)
Household type by relationship - Same-Sex unmarried partner (%)
Household type by relationship - In group quarters (%)
Size of family households - 2-person household (%)
Size of family households - 3-person household (%)
Size of family households - 4-person household (%)
Size of family households - 5-person household (%)
Size of family households - 6-person household (%)
Size of family households - 7-or-more-person household (%)
Size of nonfamily households - 1-person household (%)
Size of nonfamily households - 2-person household (%)
Size of nonfamily households - 3-person household (%)
Size of nonfamily households - 4-person household (%)
Size of nonfamily households - 5-person household (%)
Size of nonfamily households - 6-person household (%)
Size of nonfamily households - 7-or-moreperson household (%)
Year house built - Built 2010 or later (%)
Year house built - Built 2000 to 2009 (%)
Year house built - Built 1990 to 1999 (%)
Year house built - Built 1980 to 1989 (%)
Year house built - Built 1970 to 1979 (%)
Year house built - Built 1960 to 1969 (%)
Year house built - Built 1950 to 1959 (%)
Year house built - Built 1940 to 1949 (%)
Year house built - Built 1939 or earlier (%)
Median number of rooms in houses and condos
Median number of rooms in apartments
Median number of bedrooms in owner occupied houses
Mean number of bedrooms in owner occupied houses
Median number of bedrooms in renter occupied houses
Mean number of bedrooms in renter occupied houses
Median number of vehichles in owner occupied houses
Mean number of vehichles in owner occupied houses
Median number of vehichles in renter occupied houses
Mean number of vehichles in renter occupied houses
Rooms in owner-occupied houses - 1 room (%)
Rooms in owner-occupied houses - 2 rooms (%)
Rooms in owner-occupied houses - 3 rooms (%)
Rooms in owner-occupied houses - 4 rooms (%)
Rooms in owner-occupied houses - 5 rooms (%)
Rooms in owner-occupied houses - 6 rooms (%)
Rooms in owner-occupied houses - 7 rooms (%)
Rooms in owner-occupied houses - 8 rooms (%)
Rooms in owner-occupied houses - 9+ rooms (%)
Rooms in renter-occupied houses - 1 room (%)
Rooms in renter-occupied houses - 2 rooms (%)
Rooms in renter-occupied houses - 3 rooms (%)
Rooms in renter-occupied houses - 4 rooms (%)
Rooms in renter-occupied houses - 5 rooms (%)
Rooms in renter-occupied houses - 6 rooms (%)
Rooms in renter-occupied houses - 7 rooms (%)
Rooms in renter-occupied houses - 8 rooms (%)
Rooms in renter-occupied houses - 9+ rooms (%)
Bedrooms in owner-occupied houses - no bedrooms (%)
Bedrooms in owner-occupied houses - 1 bedroom (%)
Bedrooms in owner-occupied houses - 2 bedrooms (%)
Bedrooms in owner-occupied houses - 3 bedrooms (%)
Bedrooms in owner-occupied houses - 4 bedrooms (%)
Bedrooms in owner-occupied houses - 5+ bedrooms (%)
Bedrooms in renter-occupied houses - no bedrooms (%)
Bedrooms in renter-occupied houses - 1 bedroom (%)
Bedrooms in renter-occupied houses - 2 bedrooms (%)
Bedrooms in renter-occupied houses - 3 bedrooms (%)
Bedrooms in renter-occupied houses - 4 bedrooms (%)
Bedrooms in renter-occupied houses - 5+ bedrooms (%)
Vehicles available in owner-occupied houses - no vehicle available (%)
Vehicles available in owner-occupied houses - 1 vehicle available(%)
Vehicles available in owner-occupied houses - 2 Vehicles available (%)
Vehicles available in owner-occupied houses - 3 Vehicles available (%)
Vehicles available in owner-occupied houses - 4 Vehicles available (%)
Vehicles available in owner-occupied houses - 5+ Vehicles available (%)
Vehicles available in renter-occupied houses - no vehicle available (%)
Vehicles available in renter-occupied houses - 1 vehicle available (%)
Vehicles available in renter-occupied houses - 2 Vehicles available (%)
Vehicles available in renter-occupied houses - 3 Vehicles available (%)
Vehicles available in renter-occupied houses - 4 Vehicles available (%)
Vehicles available in renter-occupied houses - 5+ Vehicles available (%)
Housing units in structures - 1, detached (%)
Housing units in structures - 1, attached (%)
Housing units in structures - 2 (%)
Housing units in structures - 3 or 4 (%)
Housing units in structures - 5 to 9 (%)
Housing units in structures - 10 to 19 (%)
Housing units in structures - 20 to 49 (%)
Housing units in structures - 50 or more (%)
Housing units in structures - Mobile home (%)
Housing units in structures - Boat, RV, van, etc. (%)
Housing units in structures - Owners - 1, detached (%)
Housing units in structures - Owners - 1, attached (%)
Housing units in structures - Owners - 2 (%)
Housing units in structures - Owners - 3 or 4 (%)
Housing units in structures - Owners - 5 to 9 (%)
Housing units in structures - Owners - 10 to 19 (%)
Housing units in structures - Owners - 20 to 49 (%)
Housing units in structures - Owners - 50 or more (%)
Housing units in structures - Owners - Mobile home (%)
Housing units in structures - Owners - Boat, RV, van, etc. (%)
Housing units in structures - Renters - 1, detached (%)
Housing units in structures - Renters - 1, attached (%)
Housing units in structures - Renters - 2 (%)
Housing units in structures - Renters - 3 or 4 (%)
Housing units in structures - Renters - 5 to 9 (%)
Housing units in structures - Renters - 10 to 19 (%)
Housing units in structures - Renters - 20 to 49 (%)
Housing units in structures - Renters - 50 or more (%)
Housing units in structures - Renters - Mobile home (%)
Housing units in structures - Renters - Boat, RV, van, etc. (%)
House/condo owner moved in on average (years ago)
Renter moved in on average (years ago)
Year householder moved into unit - Moved in 1999 to March 2000 (%)
Year householder moved into unit - Moved in 1999 to March 2000 (%) - White
Year householder moved into unit - Moved in 1999 to March 2000 (%) - Black or African American
Year householder moved into unit - Moved in 1999 to March 2000 (%) - Asian
Year householder moved into unit - Moved in 1999 to March 2000 (%) - Hispanic or Latino
Year householder moved into unit - Moved in 1999 to March 2000 (%) - American Indian and Alaska Native
Year householder moved into unit - Moved in 1999 to March 2000 (%) - Multirace
Year householder moved into unit - Moved in 1999 to March 2000 (%) - Other Race
Year householder moved into unit - Moved in 1995 to 1998 (%)
Year householder moved into unit - Moved in 1995 to 1998 (%) - White
Year householder moved into unit - Moved in 1995 to 1998 (%) - Black or African American
Year householder moved into unit - Moved in 1995 to 1998 (%) - Asian
Year householder moved into unit - Moved in 1995 to 1998 (%) - Hispanic or Latino
Year householder moved into unit - Moved in 1995 to 1998 (%) - American Indian and Alaska Native
Year householder moved into unit - Moved in 1995 to 1998 (%) - Multirace
Year householder moved into unit - Moved in 1995 to 1998 (%) - Other Race
Year householder moved into unit - Moved in 1990 to 1994 (%)
Year householder moved into unit - Moved in 1990 to 1994 (%) - White
Year householder moved into unit - Moved in 1990 to 1994 (%) - Black or African American
Year householder moved into unit - Moved in 1990 to 1994 (%) - Asian
Year householder moved into unit - Moved in 1990 to 1994 (%) - Hispanic or Latino
Year householder moved into unit - Moved in 1990 to 1994 (%) - American Indian and Alaska Native
Year householder moved into unit - Moved in 1990 to 1994 (%) - Multirace
Year householder moved into unit - Moved in 1990 to 1994 (%) - Other Race
Year householder moved into unit - Moved in 1980 to 1989 (%)
Year householder moved into unit - Moved in 1980 to 1989 (%) - White
Year householder moved into unit - Moved in 1980 to 1989 (%) - Black or African American
Year householder moved into unit - Moved in 1980 to 1989 (%) - Asian
Year householder moved into unit - Moved in 1980 to 1989 (%) - Hispanic or Latino
Year householder moved into unit - Moved in 1980 to 1989 (%) - American Indian and Alaska Native
Year householder moved into unit - Moved in 1980 to 1989 (%) - Multirace
Year householder moved into unit - Moved in 1980 to 1989 (%) - Other Race
Year householder moved into unit - Moved in 1970 to 1979 (%)
Year householder moved into unit - Moved in 1970 to 1979 (%) - White
Year householder moved into unit - Moved in 1970 to 1979 (%) - Black or African American
Year householder moved into unit - Moved in 1970 to 1979 (%) - Asian
Year householder moved into unit - Moved in 1970 to 1979 (%) - Hispanic or Latino
Year householder moved into unit - Moved in 1970 to 1979 (%) - American Indian and Alaska Native
Year householder moved into unit - Moved in 1970 to 1979 (%) - Multirace
Year householder moved into unit - Moved in 1970 to 1979 (%) - Other Race
Year householder moved into unit - Moved in 1969 or earlier (%)
Year householder moved into unit - Moved in 1969 or earlier (%) - White
Year householder moved into unit - Moved in 1969 or earlier (%) - Black or African American
Year householder moved into unit - Moved in 1969 or earlier (%) - Asian
Year householder moved into unit - Moved in 1969 or earlier (%) - Hispanic or Latino
Year householder moved into unit - Moved in 1969 or earlier (%) - American Indian and Alaska Native
Year householder moved into unit - Moved in 1969 or earlier (%) - Multirace
Year householder moved into unit - Moved in 1969 or earlier (%) - Other Race
Housing units lacking complete plumbing facilities (%)
Housing units lacking complete kitchen facilities (%)
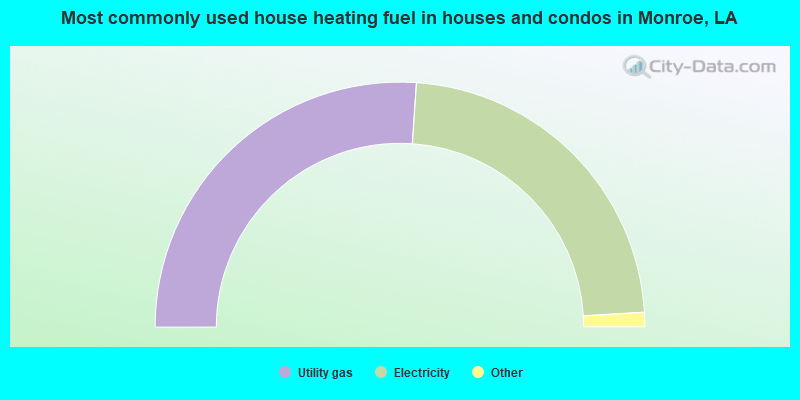
House heating fuel used in houses and condos - Utility gas (%)
House heating fuel used in houses and condos - Bottled, tank, or LP gas (%)
House heating fuel used in houses and condos - Electricity (%)
House heating fuel used in houses and condos - Fuel oil, kerosene, etc. (%)
House heating fuel used in houses and condos - Coal or coke (%)
House heating fuel used in houses and condos - Wood (%)
House heating fuel used in houses and condos - Solar energy (%)
House heating fuel used in houses and condos - Other fuel (%)
House heating fuel used in houses and condos - No fuel used (%)
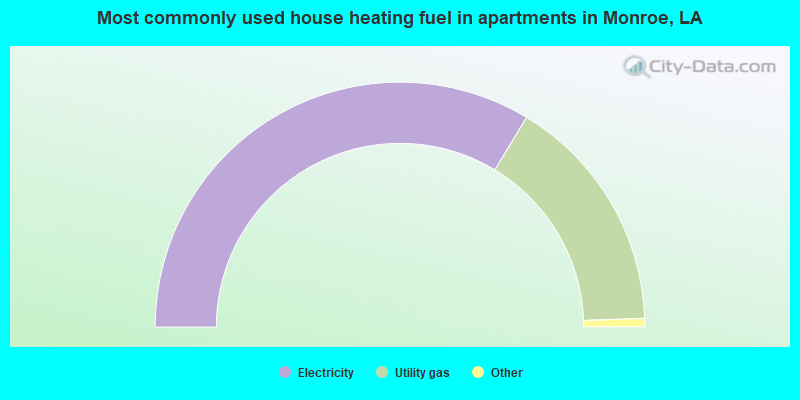
House heating fuel used in apartments - Utility gas (%)
House heating fuel used in apartments - Bottled, tank, or LP gas (%)
House heating fuel used in apartments - Electricity (%)
House heating fuel used in apartments - Fuel oil, kerosene, etc. (%)
House heating fuel used in apartments - Coal or coke (%)
House heating fuel used in apartments - Wood (%)
House heating fuel used in apartments - Solar energy (%)
House heating fuel used in apartments - Other fuel (%)
House heating fuel used in apartments - No fuel used (%)
Latest news about housing in Monroe, LA collected exclusively by city-data.com from local newspapers, TV, and radio stations
Median year house/condo built: 1973Median year apartment built: 1974Household type by relationship:
Households: 47,068
Male householders: 7,607 (3,193 living alone ), Female householders: 10,117 (4,154 living alone )4,628 spouses (4,578 opposite-sex spouses ), 851 unmarried partners , (842 opposite-sex unmarried partners ), 15,323 children (14,691 natural , 305 adopted , 326 stepchildren ), 1,836 grandchildren , 456 brothers or sisters , 805 parents , 108 foster children , 779 other relatives , 1,172 non-relatives In group quarters: 3,382
Size of family households: 4,263 2-persons , 2,864 3-persons , 1,901 4-persons , 786 5-persons , 107 6-persons , 305 7-or-more-persons .
Size of nonfamily households: 7,656 1-person , 934 2-persons , 30 3-persons .
4,168 married couples with children. single-parent households (832 men , 5,329 women ).
95.7% of residents of Monroe speak English at home. of residents speak Spanish at home (79% speak English very well , 20% speak English well , 2% don't speak English at all ).of residents speak other Indo-European language at home (85% speak English very well , 12% speak English well , 3% speak English not well ).of residents speak Asian or Pacific Island language at home (61% speak English very well , 24% speak English well , 15% speak English not well ).of residents speak other language at home (82% speak English very well , 18% speak English well ).
Foreign born population: 1,241 (2.6%)of them are naturalized citizens )
Median number of rooms in houses and condos:
Median number of rooms in apartments
Owner-occupied Renter-occupied
Rooms in owner-occupied houses in Monroe, Louisiana
30 1 room 0 2 rooms 100 3 rooms 380 4 rooms 1,551 5 rooms 2,755 6 rooms 1,229 7 rooms 972 8 rooms 1,461 9+ rooms
Rooms in renter-occupied apartments in Monroe, Louisiana
407 1 room 361 2 rooms 1,706 3 rooms 2,393 4 rooms 2,743 5 rooms 1,828 6 rooms 837 7 rooms 190 8 rooms 76 9+ rooms
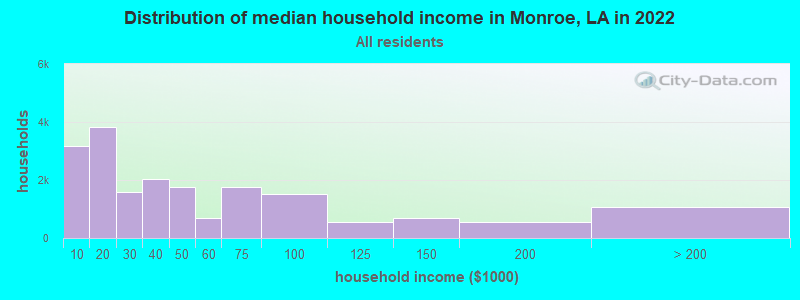
Monroe, LA household income distribution 3,175 Less than $10,0003,841 $10,000 to $19,9991,587 $20,000 to $29,9992,050 $30,000 to $39,9991,761 $40,000 to $49,999687 $50,000 to $59,9991,749 $60,000 to $74,9991,529 $75,000 to $99,999554 $100,000 to $124,999686 $125,000 to $149,999535 $150,000 to $199,9991,064 $200,000 or more
Home value of owner - occupied houses in 2022 in Monroe, LA 133 Less than $10,00071 $10,000 to $14,999190 $15,000 to $19,99998 $20,000 to $24,99949 $25,000 to $29,99990 $30,000 to $34,999126 $35,000 to $39,999316 $40,000 to $49,999460 $50,000 to $59,999643 $60,000 to $69,999366 $70,000 to $79,999283 $80,000 to $89,999295 $90,000 to $99,999484 $100,000 to $124,999334 $125,000 to $149,999316 $150,000 to $174,999320 $175,000 to $199,999632 $200,000 to $249,999950 $250,000 to $299,999964 $300,000 to $399,999537 $400,000 to $499,999457 $500,000 to $749,99974 $750,000 to $999,99956 $1,000,000 to $1,499,9997 $1,500,000 to $1,999,99913 $2,000,000 or moreRent paid by renters in 2022 in Monroe, LA 96 Less than $100521 $100 to $149372 $150 to $199150 $200 to $249189 $250 to $299469 $300 to $349138 $350 to $399604 $400 to $449913 $450 to $499948 $500 to $549579 $550 to $599603 $600 to $649687 $650 to $699670 $700 to $749793 $750 to $7991,284 $800 to $899462 $900 to $999244 $1,000 to $1,249286 $1,250 to $1,49999 $1,500 to $1,99936 $2,500 to $2,999726 No cash rent
Percentage of workers working in this county: 88.7%Number of people working at home: 1,132 (6.5% of all workers )
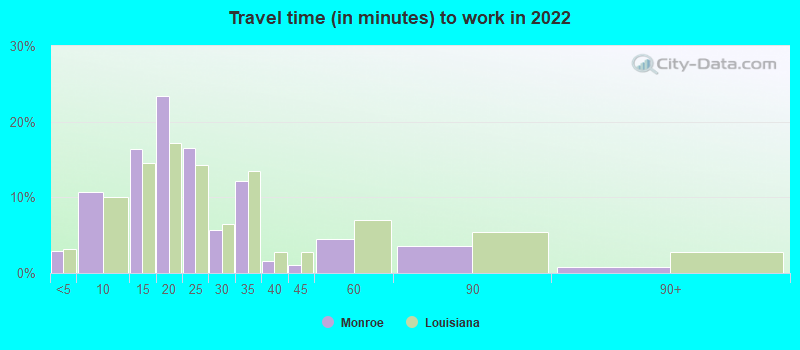
Travel time to work (commute)
Less than 5 minutes: 5945 to 9 minutes: 2,98410 to 14 minutes: 3,70115 to 19 minutes: 4,24820 to 24 minutes: 1,32725 to 29 minutes: 44630 to 34 minutes: 1,06435 to 39 minutes: 15540 to 44 minutes: 8045 to 59 minutes: 49260 to 89 minutes: 73290 or more minutes: 233
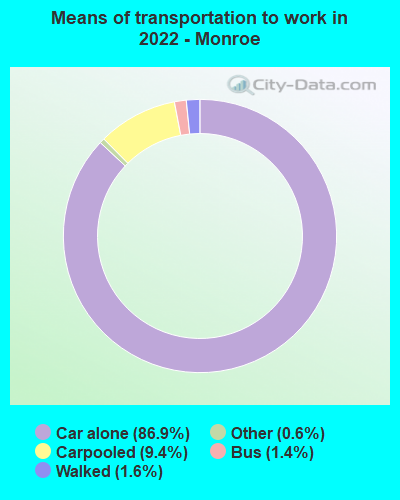
Means of transportation to work:
Drove a car alone: 33,357 (83.2%)Carpooled: 3,600 (9.0%)Bus : 403 (1.0%)Long-distance train or commuter rail : 9 (0.0%)Taxi: 256 (0.6%)Bicycle: 27 (0.1%)Walked: 716 (1.8%)Worked at home: 1,132 (2.8%)
Unemployment by race in 2022
Unemployment rate for White non-Hispanic residents 9.2% Males3.6% FemalesUnemployment rate for Black residents 16.1% Males12.0% FemalesUnemployment rate for Asian residents 5.2% Males5.2% FemalesUnemployment rate for other race residents 26.9% FemalesUnemployment rate for two or more race residents 0.8% Males10.0% FemalesUnemployment rate for Hispanic or Latino residents 0.5% Males
Year of entry for the foreign-born population in Monroe, Louisiana
496 2010 or later 215 2000 to 2009 117 1990 to 1999 173 1980 to 1989 94 1970 to 1979 117 Before 1970
First ancestries reported:
English: 2,219 (6.5%)
American: 1,861 (5.4%)
Irish: 581 (1.7%)
Italian: 414 (1.2%)
French: 314 (0.9%)
European: 291 (0.8%)
German: 281 (0.8%)
Scottish: 273 (0.8%)
Arab: 198 (0.6%)
Palestinian: 114 (0.3%)
Czechoslovakian: 104 (0.3%)
African: 88 (0.3%)
Scotch-Irish: 86 (0.3%)
Danish: 85 (0.2%)
Nigerian: 84 (0.2%)
Polish: 81 (0.2%)
Australian: 62 (0.2%)
Moroccan: 59 (0.2%)
Greek: 46 (0.1%)
Iraqi: 44 (0.1%)
Belizean: 43 (0.1%)
French Canadian: 38 (0.1%)
British: 33 (0.10%)
Russian: 25 (0.07%)
Israeli: 22 (0.06%)
Swedish: 21 (0.06%)
Eastern European: 19 (0.06%)
Welsh: 17 (0.05%)
Cajun: 14 (0.04%)
Ukrainian: 13 (0.04%)
Canadian: 12 (0.03%)
Iranian: 12 (0.03%)
Swiss: 11 (0.03%)
Dutch: 9 (0.03%)
Egyptian: 8 (0.02%)
Yugoslavian: 8 (0.02%)
Brazilian: 7 (0.02%)
Albanian: 6 (0.02%) Most common places of birth for foreign-born residents (%): Vietnam Monroe:
16.0% (160)Louisiana:
9.2% (18,115)
United Kingdom, excluding England and Scotland Monroe:
9.1% (91)Louisiana:
0.7% (1,321)
Nigeria Monroe:
8.6% (86)Louisiana:
1.0% (2,002)
Mexico Monroe:
8.6% (86)Louisiana:
12.1% (23,732)
Asia, n.e.c. Monroe:
8.1% (81)Louisiana:
0.7% (1,334)
Nepal Monroe:
6.9% (69)Louisiana:
0.7% (1,299)
Yemen Monroe:
5.4% (54)Louisiana:
0.5% (935)
Saudi Arabia Monroe:
4.8% (48)Louisiana:
0.2% (383)
China, excluding Hong Kong and Taiwan Monroe:
4.3% (43)Louisiana:
3.4% (6,779)
Israel Monroe:
3.9% (39)Louisiana:
0.5% (901)
Morocco Monroe:
3.5% (35)Louisiana:
0.2% (374)
Honduras Monroe:
2.6% (26)Louisiana:
18.9% (37,225)
Canada Monroe:
2.5% (25)Louisiana:
1.5% (2,933)
Iraq Monroe:
2.0% (20)Louisiana:
0.3% (513)
Egypt Monroe:
2.0% (20)Louisiana:
0.8% (1,613)
Other Caribbean Monroe:
1.9% (19)Louisiana:
0.2% (356)
Place of birth for U.S.-born residents:
This state: 38,911Other state: 6,643Northeast: 345Midwest: 1,114South: 4,682West: 519 85.5% of Monroe residents lived in the same house 1 years ago.
Out of people who lived in different houses, 42.1% lived in this county.
Out of people who lived in different counties, 57.0% lived in Louisiana.
Monroe:
85.5%State average:
88.3%
Education attainment for males 25 years and older:
No schooling: 214Nursery to 4th grade: 05th and 6th grade: 707th and 8th grade: 3009th grade: 45010th grade: 41111th grade: 32812th grade, no diploma: 380High school graduate (or equivalency): 4,525Less than 1 year of college: 575Some college more than 1 year, no degree: 1,761Associate degree: 400Bachelor's degree: 2,510Master's degree: 696Professional school degree: 454Doctorate degree: 238
Education attainment for females 25 years and older:
No schooling: 122Nursery to 4th grade: 225th and 6th grade: 487th and 8th grade: 2779th grade: 76210th grade: 57911th grade: 45012th grade, no diploma: 587High school graduate (or equivalency): 4,290Less than 1 year of college: 733Some college more than 1 year, no degree: 3,089Associate degree: 604Bachelor's degree: 2,570Master's degree: 1,758Professional school degree: 318Doctorate degree: 157
Housing units in structures:
One, detached: 14,538One, attached: 452Two: 1,1263 or 4: 1,6935 to 9: 1,25910 to 19: 63020 to 49: 30850 or more: 913Mobile homes: 340Housing units lacking complete plumbing facilities in 2022: 7.4%Housing units lacking complete kitchen facilities in 2022: 7.2%House/condo owner moved in on average 19 years ago
Renter moved in on average 5 years ago
Private vs. public school enrollment:
Students in private schools in grades 1 to 8 (elementary and middle school): 1,276 Here:
29.4%Louisiana:
19.6%
Students in private schools in grades 9 to 12 (high school): 276 Here:
10.1%Louisiana:
18.3%
Students in private undergraduate colleges: 228