Morrisville, NC (North Carolina) Houses and Residents
| Morrisville: | $523,829 |
| North Carolina: | $280,600 |
Mean price in 2022:
Detached houses: $609,464
Here: $609,464 State: $375,326 Townhouses or other attached units: $382,185
Here: $382,185 State: $317,935 In 5-or-more-unit structures: $289,030
Here: $289,030 State: $329,290 Mobile homes: $294,127
Here: $294,127 State: $124,933
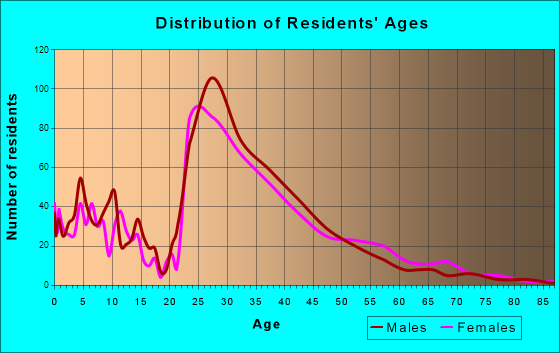
Total population: 22,772 (Urban population: 4,907, Rural population: 235 (all nonfarm))
Houses: 13,002 (11,783 occupied: 5,820 owner occupied, 5,718 renter occupied)
| % of renters here: | 50% |
| State: | 33% |
Housing density: 1,920 houses/condos per square mile
Median price asked for vacant for-sale houses and condos in 2022: $5,344,160.
Median contract rent in 2022: $1,581 (lower quartile is $1,325, upper quartile is over $2,000)
Median rent asked for vacant for-rent units in 2022: $2,490
Median gross rent in Morrisville, NC in 2022: $1,744
Housing units in Morrisville with a mortgage: 4,492 (678 second mortgage, 0 home equity loan, 672 both second mortgage and home equity loan)
Houses without a mortgage: 220
Median household income for houses/condos with a mortgage: $158,375
Median household income for apartments without a mortgage: $103,809
Median monthly housing costs: $1,759
Compare current foreclosures near Morrisville, NC:
| Photo | Address | Area | Beds / Baths | Price | Details |
|---|---|---|---|---|---|

|
#1
Keystone Park Dr Unit 46
Morrisville, NC 27560
|
1,610 sq. feet
|
2 baths 3 beds |
show details | |

|
#2
Indian Branch Dr
Morrisville, NC 27560
|
1,500 sq. feet
|
2 baths - beds |
show details | |

|
#3
Walnut Woods Dr
Morrisville, NC 27560
|
1,530 sq. feet
|
2 baths - beds |
show details | |

|
#4
Trolley Car Way
Morrisville, NC 27560
|
1,992 sq. feet
|
2 baths - beds |
show details | |

|
#5
Colwick Ln
Morrisville, NC 27560
|
1,144 sq. feet
|
2 baths - beds |
show details | |

|
#6
Bristol Creek Dr Apt 402
Morrisville, NC 27560
|
- sq. feet
|
- baths - beds |
show details | |

|
#7
Traphill Dr
Morrisville, NC 27560
|
- sq. feet
|
- baths - beds |
show details | |

|
#8
Corbett St, Unit 7310
Morrisville, NC 27560
|
- sq. feet
|
- baths - beds |
show details | |

|
#9
Mccrimmon Pkwy # 426
Morrisville, NC 27560
|
- sq. feet
|
- baths - beds |
show details | |

|
#10
Langdon Dr, Apt 305
Morrisville, NC 27560
|
- sq. feet
|
- baths - beds |
show details |
| Photo | Address | Area | Beds / Baths | Price | Details |
|---|---|---|---|---|---|

|
#11
Clarion Bridge Way Apt 522
Morrisville, NC 27560
|
- sq. feet
|
- baths - beds |
show details | |

|
#12
Grace Park Dr
Morrisville, NC 27560
|
- sq. feet
|
- baths - beds |
show details | |

|
#13
Gran Lake Dr Apt A
Morrisville, NC 27560
|
- sq. feet
|
- baths - beds |
show details | |

|
#14
Explorer Dr
Morrisville, NC 27560
|
- sq. feet
|
- baths - beds |
show details | |

|
#15
Clarion Bridge Way Apt 537
Morrisville, NC 27560
|
- sq. feet
|
- baths - beds |
show details | |

|
#16
Lofty Ridge Pl
Morrisville, NC 27560
|
- sq. feet
|
- baths - beds |
show details | |

|
#17
Mccrimmon Pkwy, Apt 1229
Morrisville, NC 27560
|
- sq. feet
|
- baths - beds |
show details | |

|
#18
Golden Horseshoe Cir
Morrisville, NC 27560
|
- sq. feet
|
- baths - beds |
show details | |

|
#19
Stardale Rd
Morrisville, NC 27560
|
- sq. feet
|
- baths - beds |
show details | |

|
#20
Summit Ridge Loop
Morrisville, NC 27560
|
- sq. feet
|
- baths - beds |
show details |
| Photo | Address | Area | Beds / Baths | Price | Details |
|---|---|---|---|---|---|

|
#21
Duck Pond Cir Apt G
Morrisville, NC 27560
|
- sq. feet
|
- baths - beds |
show details | |

|
#22
Duck Pond Cir Apt C
Morrisville, NC 27560
|
- sq. feet
|
- baths - beds |
show details | |

|
#23
Still Monument Way
Raleigh, NC 27603
|
2,117 sq. feet
|
3 baths 3 beds |
show details | |

|
#24
N Mineral Springs Rd
Durham, NC 27703
|
1,674 sq. feet
|
1 baths 2 beds |
show details | |

|
#25
Ardmore Dr
Durham, NC 27713
|
2,792 sq. feet
|
2 baths 4 beds |
show details | |

|
#26
Deanwood Dr
Raleigh, NC 27615
|
1,512 sq. feet
|
2 baths 3 beds |
show details | |

|
#27
Bragg St
Raleigh, NC 27601
|
761 sq. feet
|
1 baths 1 beds |
show details | |

|
#28
Stoney Spring Dr
Raleigh, NC 27610
|
1,806 sq. feet
|
2 baths 3 beds |
show details | |

|
#29
Braidwood Ct
Raleigh, NC 27612
|
2,210 sq. feet
|
4 baths 3 beds |
show details | |

|
#30
Statler Dr
Durham, NC 27703
|
- sq. feet
|
2 baths 3 beds |
show details |
| Photo | Address | Area | Beds / Baths | Price | Details |
|---|---|---|---|---|---|

|
#31
Center St
Apex, NC 27502
|
1,053 sq. feet
|
2 baths - beds |
show details | |

|
#32
Stone Fence Ct
Durham, NC 27704
|
1,824 sq. feet
|
2 baths 4 beds |
show details | |

|
#33
Dearborn Dr
Durham, NC 27704
|
1,240 sq. feet
|
2 baths 3 beds |
show details | |

|
#34
Pinetree Ct
Durham, NC 27705
|
986 sq. feet
|
2 baths 2 beds |
show details | |

|
#35
Hanson Rd
Durham, NC 27713
|
2,024 sq. feet
|
2 baths 4 beds |
show details | |

|
#36
Delmar Dr
Durham, NC 27703
|
2,129 sq. feet
|
3 baths 4 beds |
show details | |

|
#37
Tranquil Rd
Durham, NC 27713
|
1,286 sq. feet
|
2 baths 3 beds |
show details | |

|
#38
Maryland Ave
Durham, NC 27705
|
1,054 sq. feet
|
1 baths 4 beds |
show details | |

|
#39
Bristlewood Dr
Durham, NC 27703
|
1,567 sq. feet
|
1 baths 3 beds |
show details | |

|
#40
Forest Rd
Durham, NC 27705
|
950 sq. feet
|
1 baths 2 beds |
show details |
| Photo | Address | Area | Beds / Baths | Price | Details |
|---|---|---|---|---|---|

|
#41
Alabama Ave
Durham, NC 27705
|
1,083 sq. feet
|
1 baths 3 beds |
show details | |

|
#42
Willowdale Dr
Durham, NC 27707
|
1,008 sq. feet
|
1 baths 3 beds |
show details | |

|
#43
Kendall Dr
Durham, NC 27703
|
1,422 sq. feet
|
2 baths 3 beds |
show details | |

|
#44
Intercross Rd
Durham, NC 27704
|
1,120 sq. feet
|
1 baths 3 beds |
show details | |

|
#45
Todd St
Durham, NC 27704
|
1,196 sq. feet
|
1 baths 3 beds |
show details | |

|
#46
Four Seasons Dr
Durham, NC 27707
|
1,025 sq. feet
|
1 baths 3 beds |
show details | |

|
#47
Sherron Rd
Durham, NC 27703
|
1,050 sq. feet
|
1 baths 3 beds |
show details | |

|
#48
S Alston Ave
Durham, NC 27707
|
2,154 sq. feet
|
2 baths 3 beds |
show details | |

|
#49
Sundial Cir
Durham, NC 27704
|
1,292 sq. feet
|
2 baths 3 beds |
show details | |

|
Check over 1 million property listings on Foreclosure.com!
|
browse all offers | |||

Latest news about housing in Morrisville, NC collected exclusively by city-data.com from local newspapers, TV, and radio stations


Median year apartment built: 2007
Household type by relationship:
Households: 30,884- Male householders: 7,273 (1,643 living alone), Female householders: 4,300 (1,217 living alone)
6,361 spouses (6,317 opposite-sex spouses), 679 unmarried partners, (641 opposite-sex unmarried partners), 9,270 children (9,050 natural, 88 adopted, 131 stepchildren), 102 grandchildren, 469 brothers or sisters, 1,098 parents, 43 foster children, 336 other relatives, 932 non-relatives
- In group quarters: 16
Size of family households: 2,893 2-persons, 1,851 3-persons, 2,072 4-persons, 589 5-persons, 272 6-persons, 59 7-or-more-persons.
Size of nonfamily households: 2,887 1-person, 650 2-persons, 198 3-persons, 8 4-persons, 7 6-persons.
6,097 married couples with children.
778 single-parent households (141 men, 637 women).
55.4% of residents of Morrisville speak English at home.
2.0% of residents speak Spanish at home (93% speak English very well, 5% speak English well, 2% speak English not well).
22.7% of residents speak other Indo-European language at home (74% speak English very well, 19% speak English well, 6% speak English not well, 1% don't speak English at all).
21.8% of residents speak Asian or Pacific Island language at home (74% speak English very well, 21% speak English well, 4% speak English not well, 1% don't speak English at all).
2.8% of residents speak other language at home (91% speak English very well, 9% speak English well).
Foreign born population: 11,550 (37.4%)
(41.4% of them are naturalized citizens)
| Here: | 6.8 |
| State: | 6.4 |
| Here: | 4.1 |
| State: | 4.4 |

- Bedrooms in owner-occupied houses and condos in Morrisville, North Carolina
- 135no bedroom
- 01 bedroom
- 1822 bedrooms
- 2,7583 bedrooms
- 1,8774 bedrooms
- 8695+ bedrooms

- Bedrooms in renter-occupied apartments in Morrisville, North Carolina
- 166no bedroom
- 1,4531 bedroom
- 2,0052 bedrooms
- 1,4153 bedrooms
- 6054 bedrooms
- 755+ bedrooms

- Cars and other vehicles available in Morrisville in owner-occupied houses/condos
- 34no vehicle
- 1,7501 vehicle
- 2,6892 vehicles
- 9803 vehicles
- 3014 vehicles
- 665+ vehicles

- Cars and other vehicles available in Morrisville in renter-occupied apartments
- 227no vehicle
- 3,0431 vehicle
- 2,0342 vehicles
- 3753 vehicles
- 394 vehicles
- 05+ vehicles

- Rooms in owner-occupied houses in Morrisville, North Carolina
- 1351 room
- 02 rooms
- 473 rooms
- 4994 rooms
- 8305 rooms
- 1,1586 rooms
- 7537 rooms
- 1,0858 rooms
- 1,3149+ rooms

- Rooms in renter-occupied apartments in Morrisville, North Carolina
- 1661 room
- 6312 rooms
- 1,0623 rooms
- 1,6134 rooms
- 9235 rooms
- 6546 rooms
- 2627 rooms
- 1188 rooms
- 2909+ rooms


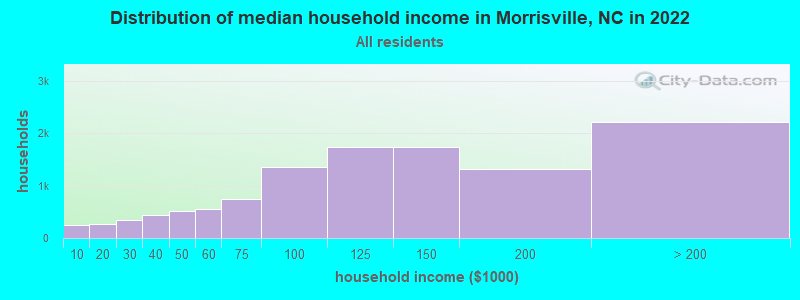
Morrisville, NC household income distribution

- 242Less than $10,000
- 268$10,000 to $19,999
- 341$20,000 to $29,999
- 448$30,000 to $39,999
- 524$40,000 to $49,999
- 561$50,000 to $59,999
- 753$60,000 to $74,999
- 1,366$75,000 to $99,999
- 1,736$100,000 to $124,999
- 1,749$125,000 to $149,999
- 1,327$150,000 to $199,999
- 2,220$200,000 or more
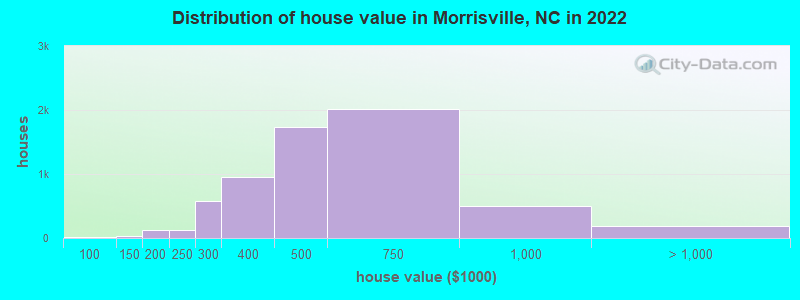
Home value of owner - occupied houses in 2022 in Morrisville, NC
-
- 6$50,000 to $59,999
- 13$70,000 to $79,999
- 7$100,000 to $124,999
- 20$125,000 to $149,999
- 20$150,000 to $174,999
- 99$175,000 to $199,999
- 122$200,000 to $249,999
- 577$250,000 to $299,999
- 957$300,000 to $399,999
- 1,735$400,000 to $499,999
- 2,012$500,000 to $749,999
- 505$750,000 to $999,999
- 42$1,000,000 to $1,499,999
- 90$1,500,000 to $1,999,999
- 59$2,000,000 or more
Rent paid by renters in 2022 in Morrisville, NC
-
- 11Less than $100
- 13$400 to $449
- 9$550 to $599
- 15$600 to $649
- 5$650 to $699
- 16$700 to $749
- 24$750 to $799
- 65$800 to $899
- 30$900 to $999
- 865$1,000 to $1,249
- 1,550$1,250 to $1,499
- 2,405$1,500 to $1,999
- 842$2,000 to $2,499
- 34$2,500 to $2,999
- 174$3,500 or more
- 68No cash rent


Percentage of workers working in this county: 75.9%
Number of people working at home: 6,189 (35.9% of all workers)
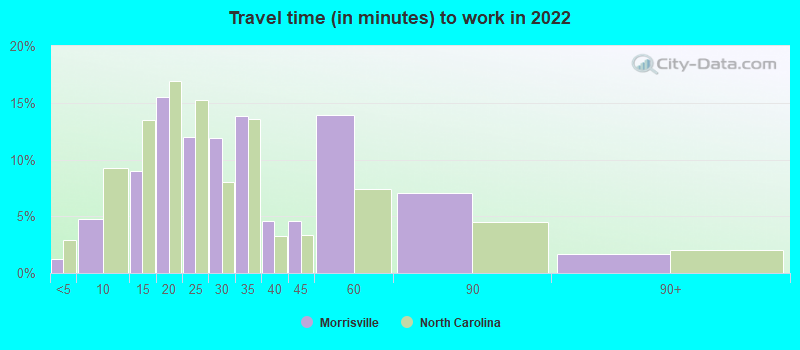
Travel time to work (commute)
- Less than 5 minutes: 260
- 5 to 9 minutes: 890
- 10 to 14 minutes: 1,883
- 15 to 19 minutes: 2,809
- 20 to 24 minutes: 1,880
- 25 to 29 minutes: 1,298
- 30 to 34 minutes: 1,184
- 35 to 39 minutes: 516
- 40 to 44 minutes: 240
- 45 to 59 minutes: 299
- 60 to 89 minutes: 251
- 90 or more minutes: 55
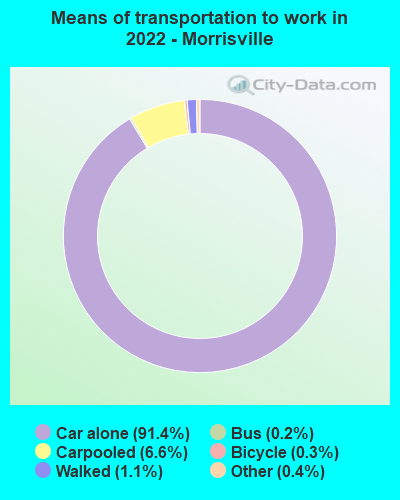
Means of transportation to work:
- Drove a car alone: 18,693 (68.8%)
- Carpooled: 1,437 (5.3%)
- Bus: 32 (0.1%)
- Taxi: 129 (0.5%)
- Bicycle: 84 (0.3%)
- Walked: 300 (1.1%)
- Worked at home: 6,189 (22.8%)

- Unemployment by race in 2022
- Unemployment rate for White non-Hispanic residents
- 0.9%Males
- 4.3%Females
- Unemployment rate for Black residents
- 10.9%Males
- 2.9%Females
- Unemployment rate for American Indian and Alaska Native residents
- 100.0%Females
- Unemployment rate for Asian residents
- 0.3%Males
- 1.4%Females
- Unemployment rate for two or more race residents
- 8.3%Females
- Unemployment rate for Hispanic or Latino residents
- 9.3%Females

- Year of entry for the foreign-born population in Morrisville, North Carolina
- 7,0592010 or later
- 2,7772000 to 2009
- 1,5421990 to 1999
- 1371980 to 1989
- 401970 to 1979
- 31Before 1970

First ancestries reported:
- English: 738 (3.9%)
- Italian: 706 (3.7%)
- American: 597 (3.1%)
- German: 551 (2.9%)
- Irish: 459 (2.4%)
- Sierra Leonean: 326 (1.7%)
- European: 310 (1.6%)
- Egyptian: 276 (1.4%)
- Nigerian: 270 (1.4%)
- British: 189 (1.0%)
- Bulgarian: 181 (0.9%)
- Polish: 144 (0.8%)
- Scottish: 118 (0.6%)
- Turkish: 114 (0.6%)
- Somali: 100 (0.5%)
- French: 77 (0.4%)
- Eastern European: 62 (0.3%)
- Norwegian: 61 (0.3%)
- Cape Verdean: 56 (0.3%)
- Russian: 52 (0.3%)
- African: 42 (0.2%)
- Welsh: 39 (0.2%)
- Armenian: 37 (0.2%)
- Moroccan: 32 (0.2%)
- Iraqi: 31 (0.2%)
- Austrian: 27 (0.1%)
- Iranian: 27 (0.1%)
- Greek: 25 (0.1%)
- Scotch-Irish: 24 (0.1%)
- Ethiopian: 21 (0.1%)
- Swedish: 20 (0.1%)
- Zimbabwean: 19 (0.10%)
- Lebanese: 18 (0.09%)
- Dutch: 14 (0.07%)
- Czech: 13 (0.07%)
- French Canadian: 12 (0.06%)
- Haitian: 11 (0.06%)
- Cajun: 10 (0.05%)
- Guyanese: 3 (0.02%)
- Hungarian: 3 (0.02%)
Most common places of birth for foreign-born residents (%):
| Morrisville: | 71.6% (7,872) |
| North Carolina: | 9.3% (80,594) |
| Morrisville: | 2.6% (289) |
| North Carolina: | 0.6% (4,847) |
| Morrisville: | 2.5% (273) |
| North Carolina: | 0.6% (5,372) |
| Morrisville: | 2.0% (220) |
| North Carolina: | 3.2% (27,477) |
| Morrisville: | 1.8% (202) |
| North Carolina: | 0.2% (1,485) |
| Morrisville: | 1.8% (194) |
| North Carolina: | 2.9% (24,965) |
| Morrisville: | 1.6% (181) |
| North Carolina: | 0.1% (1,010) |
| Morrisville: | 1.6% (173) |
| North Carolina: | 0.9% (8,067) |
Place of birth for U.S.-born residents:
- This state: 7,291
- Other state: 12,262
- Northeast: 4,308
- Midwest: 2,664
- South: 3,850
- West: 1,419
80.4% of Morrisville residents lived in the same house 1 years ago.
Out of people who lived in different houses, 30.8% lived in this county.
Out of people who lived in different counties, 41.3% lived in North Carolina.
| Morrisville: | 80.4% |
| State average: | 87.3% |
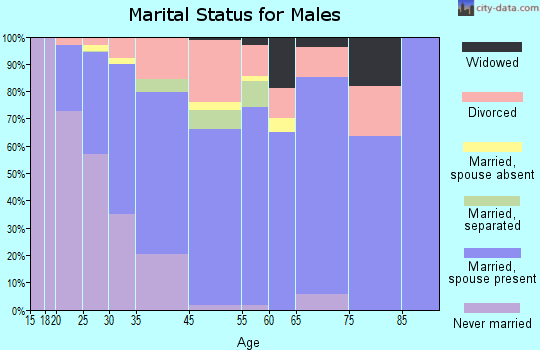
Education attainment for males 25 years and older:
- No schooling: 41
- Nursery to 4th grade: 0
- 5th and 6th grade: 0
- 7th and 8th grade: 7
- 9th grade: 0
- 10th grade: 92
- 11th grade: 53
- 12th grade, no diploma: 79
- High school graduate (or equivalency): 863
- Less than 1 year of college: 367
- Some college more than 1 year, no degree: 704
- Associate degree: 337
- Bachelor's degree: 4,708
- Master's degree: 3,161
- Professional school degree: 247
- Doctorate degree: 437

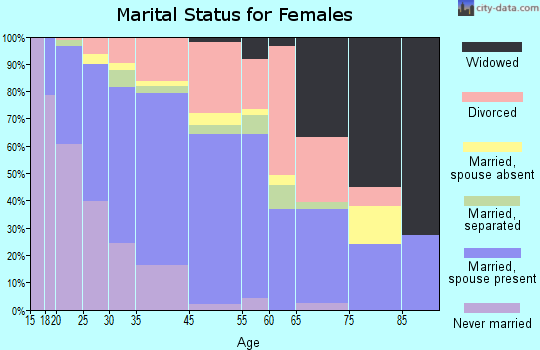
Education attainment for females 25 years and older:
- No schooling: 103
- Nursery to 4th grade: 0
- 5th and 6th grade: 12
- 7th and 8th grade: 9
- 9th grade: 96
- 10th grade: 12
- 11th grade: 13
- 12th grade, no diploma: 134
- High school graduate (or equivalency): 1,037
- Less than 1 year of college: 258
- Some college more than 1 year, no degree: 714
- Associate degree: 543
- Bachelor's degree: 4,150
- Master's degree: 2,632
- Professional school degree: 258
- Doctorate degree: 340

Housing units in structures:
- One, detached: 4,584
- One, attached: 3,042
- Two: 321
- 3 or 4: 218
- 5 to 9: 980
- 10 to 19: 1,759
- 20 to 49: 1,281
- 50 or more: 733
- Mobile homes: 80
Median worth of mobile homes: $473,663
Housing units lacking complete kitchen facilities in 2022: 1.0%
House/condo owner moved in on average 7 years ago
Renter moved in on average 1 years ago

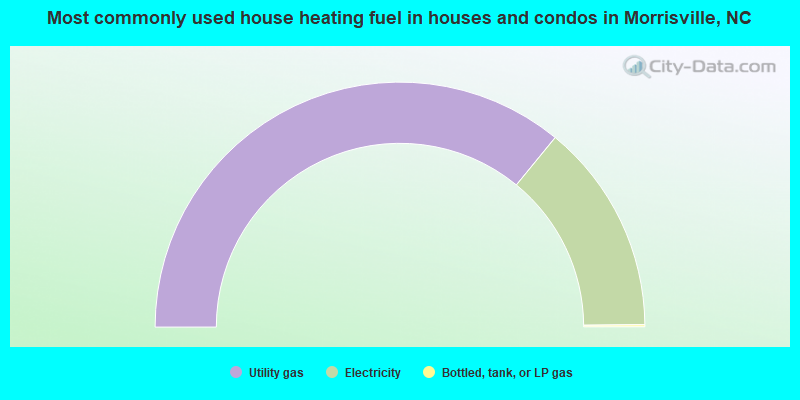
- 71.8%Utility gas
- 27.8%Electricity
- 0.3%Bottled, tank, or LP gas
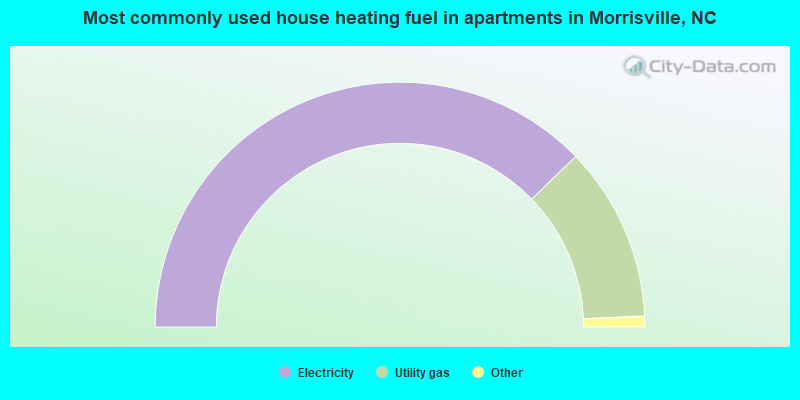
- 75.5%Electricity
- 23.1%Utility gas
- 0.8%No fuel used
- 0.5%Bottled, tank, or LP gas
Private vs. public school enrollment:
| Here: | 4.6% |
| North Carolina: | 13.8% |
| Here: | 5.1% |
| North Carolina: | 11.9% |
| Here: | 12.0% |
| North Carolina: | 19.3% |


