Niceville, FL (Florida) Houses and Residents
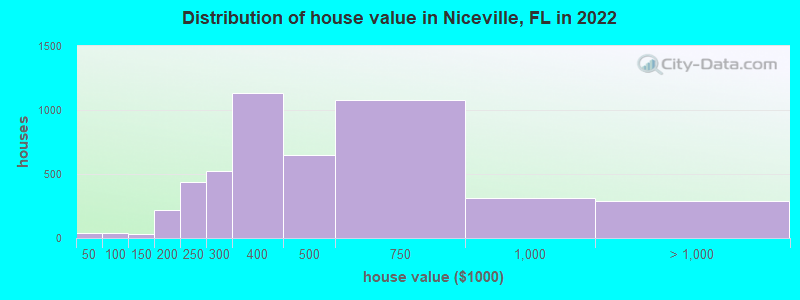
Estimated median house or condo value in 2022: $423,596 (it was $102,600 in 2000 )
Niceville:
$423,596Florida:
$354,100
Lower value quartile - upper value quartile: $317,051 - $627,907Mean price in 2022: Detached houses: $396,679 Here:
$396,679State:
$500,941
Townhouses or other attached units: $555,431 Here:
$555,431State:
$370,869
In 5-or-more-unit structures: $283,368 Here:
$283,368State:
$447,145
Mobile homes: $288,269 Here:
$288,269State:
$113,202
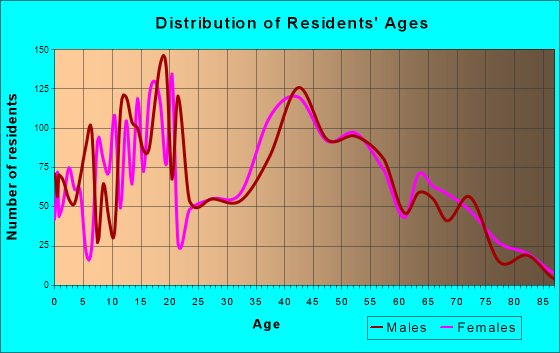
Total population: 14,387 (Urban population: 11,796, Rural population: 0)
Houses: 6,520 (5,827 occupied: 4,180 owner occupied, 1,770 renter occupied )
% of renters here:
30%State:
33%
Housing density: 597 houses/condos per square mile
Median price asked for vacant for-sale houses and condos in 2022: $222,329.
Median contract rent in 2022: $1,379 (lower quartile is $925, upper quartile is $1,633)
Median rent asked for vacant for-rent units in 2022: $978
Median gross rent in Niceville, FL in 2022: $1,583
Housing units in Niceville with a mortgage: 2,655 (248 second mortgage, 0 home equity loan, 181 both second mortgage and home equity loan )Houses without a mortgage: 169
Median household income for houses/condos with a mortgage: $124,036
Median household income for apartments without a mortgage: $105,925
Median monthly housing costs: $1,533
Data:
Median house or condo value ($)
Median house or condo value ($ change since 2000)
Median house or condo value ($) - White
Median house or condo value ($) - Black or African American
Median house or condo value ($) - Asian
Median house or condo value ($) - Hispanic or Latino
Median house or condo value ($) - American Indian and Alaska Native
Median house or condo value ($) - Multirace
Median house or condo value ($) - Other Race
Median price asked for mobile homes ($)
Household density (households per square mile)
Mean house or condo value by units in structure - 1, detached ($)
Mean house or condo value by units in structure - 1, attached ($)
Mean house or condo value by units in structure - 2 ($)
Mean house or condo value by units in structure by units in structure - 3 or 4 ($)
Mean house or condo value by units in structure - 5 or more ($)
Mean house or condo value by units in structure - Boat, RV, van, etc. ($)
Mean house or condo value by units in structure - Mobile home ($)
Median contract rent ($)
Median contract rent - Lower quartile ($)
Median contract rent - Upper quartile ($)
Median gross rent ($)
Urban houses (%)
Rural houses (%)
Houses occupied (%)
Houses occupied (% change since 2000)
Houses owner occupied (%)
Houses owner occupied (% change since 2000)
Houses renter occupied (%)
Houses renter occupied (% change since 2000)
Vacant housing units - For rent (%)
Vacant housing units - For rent (% change since 2000)
Vacant housing units - For sale only (%)
Vacant housing units - For sale only (% change since 2000)
Vacant housing units - Rented or sold, not occupied (%)
Vacant housing units - Rented or sold, not occupied (% change since 2000)
Vacant housing units - For seasonal, recreational, or occasional use (%)
Vacant housing units - For seasonal, recreational, or occasional use (% change since 2000)
Vacant housing units - For migrant workers (%)
Vacant housing units - For migrant workers (% change since 2000)
Vacant housing units - Other vacant (%)
Vacant housing units - Other vacant (% change since 2000)
Median monthly housing costs ($)
Median household income for houses/condos with a mortgage ($)
Median household income for houses/condos without a mortgage ($)
Median household income ($)
Median household income ($) - White
Median household income ($) - Black or African American
Median household income ($) - Asian
Median household income ($) - Hispanic or Latino
Median household income ($) - American Indian and Alaska Native
Median household income ($) - Multirace
Median household income ($) - Other Race
Mortgage status - with mortgage (%)
Mortgage status - with second mortgage (%)
Mortgage status - with home equity loan (%)
Mortgage status - with both second mortgage and home equity loan (%)
Mortgage status - without a mortgage (%)
Median year house/condo built
Median year apartment built
Household type by relationship - Male householder living alone (%)
Household type by relationship - Male householder not living alone (%)
Household type by relationship - Female householder living alone (%)
Household type by relationship - Female householder not living alone (%)
Household type by relationship - Opposite-Sex spouse (%)
Household type by relationship - Same-Sex spouse (%)
Household type by relationship - Opposite-Sex unmarried partner (%)
Household type by relationship - Same-Sex unmarried partner (%)
Household type by relationship - In group quarters (%)
Size of family households - 2-person household (%)
Size of family households - 3-person household (%)
Size of family households - 4-person household (%)
Size of family households - 5-person household (%)
Size of family households - 6-person household (%)
Size of family households - 7-or-more-person household (%)
Size of nonfamily households - 1-person household (%)
Size of nonfamily households - 2-person household (%)
Size of nonfamily households - 3-person household (%)
Size of nonfamily households - 4-person household (%)
Size of nonfamily households - 5-person household (%)
Size of nonfamily households - 6-person household (%)
Size of nonfamily households - 7-or-moreperson household (%)
Year house built - Built 2010 or later (%)
Year house built - Built 2000 to 2009 (%)
Year house built - Built 1990 to 1999 (%)
Year house built - Built 1980 to 1989 (%)
Year house built - Built 1970 to 1979 (%)
Year house built - Built 1960 to 1969 (%)
Year house built - Built 1950 to 1959 (%)
Year house built - Built 1940 to 1949 (%)
Year house built - Built 1939 or earlier (%)
Median number of rooms in houses and condos
Median number of rooms in apartments
Median number of bedrooms in owner occupied houses
Mean number of bedrooms in owner occupied houses
Median number of bedrooms in renter occupied houses
Mean number of bedrooms in renter occupied houses
Median number of vehichles in owner occupied houses
Mean number of vehichles in owner occupied houses
Median number of vehichles in renter occupied houses
Mean number of vehichles in renter occupied houses
Rooms in owner-occupied houses - 1 room (%)
Rooms in owner-occupied houses - 2 rooms (%)
Rooms in owner-occupied houses - 3 rooms (%)
Rooms in owner-occupied houses - 4 rooms (%)
Rooms in owner-occupied houses - 5 rooms (%)
Rooms in owner-occupied houses - 6 rooms (%)
Rooms in owner-occupied houses - 7 rooms (%)
Rooms in owner-occupied houses - 8 rooms (%)
Rooms in owner-occupied houses - 9+ rooms (%)
Rooms in renter-occupied houses - 1 room (%)
Rooms in renter-occupied houses - 2 rooms (%)
Rooms in renter-occupied houses - 3 rooms (%)
Rooms in renter-occupied houses - 4 rooms (%)
Rooms in renter-occupied houses - 5 rooms (%)
Rooms in renter-occupied houses - 6 rooms (%)
Rooms in renter-occupied houses - 7 rooms (%)
Rooms in renter-occupied houses - 8 rooms (%)
Rooms in renter-occupied houses - 9+ rooms (%)
Bedrooms in owner-occupied houses - no bedrooms (%)
Bedrooms in owner-occupied houses - 1 bedroom (%)
Bedrooms in owner-occupied houses - 2 bedrooms (%)
Bedrooms in owner-occupied houses - 3 bedrooms (%)
Bedrooms in owner-occupied houses - 4 bedrooms (%)
Bedrooms in owner-occupied houses - 5+ bedrooms (%)
Bedrooms in renter-occupied houses - no bedrooms (%)
Bedrooms in renter-occupied houses - 1 bedroom (%)
Bedrooms in renter-occupied houses - 2 bedrooms (%)
Bedrooms in renter-occupied houses - 3 bedrooms (%)
Bedrooms in renter-occupied houses - 4 bedrooms (%)
Bedrooms in renter-occupied houses - 5+ bedrooms (%)
Vehicles available in owner-occupied houses - no vehicle available (%)
Vehicles available in owner-occupied houses - 1 vehicle available(%)
Vehicles available in owner-occupied houses - 2 Vehicles available (%)
Vehicles available in owner-occupied houses - 3 Vehicles available (%)
Vehicles available in owner-occupied houses - 4 Vehicles available (%)
Vehicles available in owner-occupied houses - 5+ Vehicles available (%)
Vehicles available in renter-occupied houses - no vehicle available (%)
Vehicles available in renter-occupied houses - 1 vehicle available (%)
Vehicles available in renter-occupied houses - 2 Vehicles available (%)
Vehicles available in renter-occupied houses - 3 Vehicles available (%)
Vehicles available in renter-occupied houses - 4 Vehicles available (%)
Vehicles available in renter-occupied houses - 5+ Vehicles available (%)
Housing units in structures - 1, detached (%)
Housing units in structures - 1, attached (%)
Housing units in structures - 2 (%)
Housing units in structures - 3 or 4 (%)
Housing units in structures - 5 to 9 (%)
Housing units in structures - 10 to 19 (%)
Housing units in structures - 20 to 49 (%)
Housing units in structures - 50 or more (%)
Housing units in structures - Mobile home (%)
Housing units in structures - Boat, RV, van, etc. (%)
Housing units in structures - Owners - 1, detached (%)
Housing units in structures - Owners - 1, attached (%)
Housing units in structures - Owners - 2 (%)
Housing units in structures - Owners - 3 or 4 (%)
Housing units in structures - Owners - 5 to 9 (%)
Housing units in structures - Owners - 10 to 19 (%)
Housing units in structures - Owners - 20 to 49 (%)
Housing units in structures - Owners - 50 or more (%)
Housing units in structures - Owners - Mobile home (%)
Housing units in structures - Owners - Boat, RV, van, etc. (%)
Housing units in structures - Renters - 1, detached (%)
Housing units in structures - Renters - 1, attached (%)
Housing units in structures - Renters - 2 (%)
Housing units in structures - Renters - 3 or 4 (%)
Housing units in structures - Renters - 5 to 9 (%)
Housing units in structures - Renters - 10 to 19 (%)
Housing units in structures - Renters - 20 to 49 (%)
Housing units in structures - Renters - 50 or more (%)
Housing units in structures - Renters - Mobile home (%)
Housing units in structures - Renters - Boat, RV, van, etc. (%)
House/condo owner moved in on average (years ago)
Renter moved in on average (years ago)
Year householder moved into unit - Moved in 1999 to March 2000 (%)
Year householder moved into unit - Moved in 1999 to March 2000 (%) - White
Year householder moved into unit - Moved in 1999 to March 2000 (%) - Black or African American
Year householder moved into unit - Moved in 1999 to March 2000 (%) - Asian
Year householder moved into unit - Moved in 1999 to March 2000 (%) - Hispanic or Latino
Year householder moved into unit - Moved in 1999 to March 2000 (%) - American Indian and Alaska Native
Year householder moved into unit - Moved in 1999 to March 2000 (%) - Multirace
Year householder moved into unit - Moved in 1999 to March 2000 (%) - Other Race
Year householder moved into unit - Moved in 1995 to 1998 (%)
Year householder moved into unit - Moved in 1995 to 1998 (%) - White
Year householder moved into unit - Moved in 1995 to 1998 (%) - Black or African American
Year householder moved into unit - Moved in 1995 to 1998 (%) - Asian
Year householder moved into unit - Moved in 1995 to 1998 (%) - Hispanic or Latino
Year householder moved into unit - Moved in 1995 to 1998 (%) - American Indian and Alaska Native
Year householder moved into unit - Moved in 1995 to 1998 (%) - Multirace
Year householder moved into unit - Moved in 1995 to 1998 (%) - Other Race
Year householder moved into unit - Moved in 1990 to 1994 (%)
Year householder moved into unit - Moved in 1990 to 1994 (%) - White
Year householder moved into unit - Moved in 1990 to 1994 (%) - Black or African American
Year householder moved into unit - Moved in 1990 to 1994 (%) - Asian
Year householder moved into unit - Moved in 1990 to 1994 (%) - Hispanic or Latino
Year householder moved into unit - Moved in 1990 to 1994 (%) - American Indian and Alaska Native
Year householder moved into unit - Moved in 1990 to 1994 (%) - Multirace
Year householder moved into unit - Moved in 1990 to 1994 (%) - Other Race
Year householder moved into unit - Moved in 1980 to 1989 (%)
Year householder moved into unit - Moved in 1980 to 1989 (%) - White
Year householder moved into unit - Moved in 1980 to 1989 (%) - Black or African American
Year householder moved into unit - Moved in 1980 to 1989 (%) - Asian
Year householder moved into unit - Moved in 1980 to 1989 (%) - Hispanic or Latino
Year householder moved into unit - Moved in 1980 to 1989 (%) - American Indian and Alaska Native
Year householder moved into unit - Moved in 1980 to 1989 (%) - Multirace
Year householder moved into unit - Moved in 1980 to 1989 (%) - Other Race
Year householder moved into unit - Moved in 1970 to 1979 (%)
Year householder moved into unit - Moved in 1970 to 1979 (%) - White
Year householder moved into unit - Moved in 1970 to 1979 (%) - Black or African American
Year householder moved into unit - Moved in 1970 to 1979 (%) - Asian
Year householder moved into unit - Moved in 1970 to 1979 (%) - Hispanic or Latino
Year householder moved into unit - Moved in 1970 to 1979 (%) - American Indian and Alaska Native
Year householder moved into unit - Moved in 1970 to 1979 (%) - Multirace
Year householder moved into unit - Moved in 1970 to 1979 (%) - Other Race
Year householder moved into unit - Moved in 1969 or earlier (%)
Year householder moved into unit - Moved in 1969 or earlier (%) - White
Year householder moved into unit - Moved in 1969 or earlier (%) - Black or African American
Year householder moved into unit - Moved in 1969 or earlier (%) - Asian
Year householder moved into unit - Moved in 1969 or earlier (%) - Hispanic or Latino
Year householder moved into unit - Moved in 1969 or earlier (%) - American Indian and Alaska Native
Year householder moved into unit - Moved in 1969 or earlier (%) - Multirace
Year householder moved into unit - Moved in 1969 or earlier (%) - Other Race
Housing units lacking complete plumbing facilities (%)
Housing units lacking complete kitchen facilities (%)
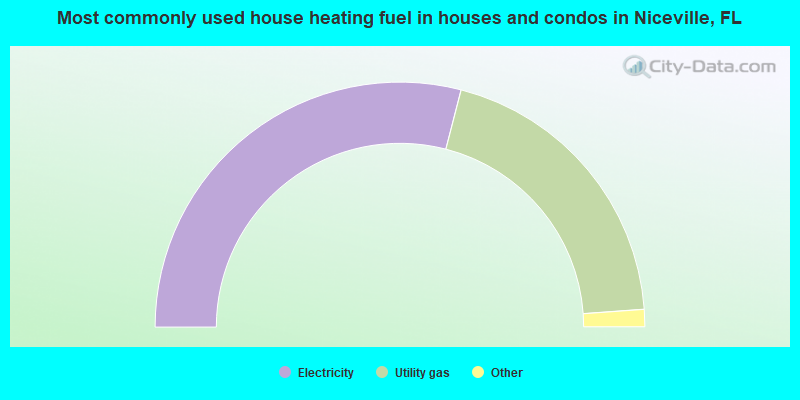
House heating fuel used in houses and condos - Utility gas (%)
House heating fuel used in houses and condos - Bottled, tank, or LP gas (%)
House heating fuel used in houses and condos - Electricity (%)
House heating fuel used in houses and condos - Fuel oil, kerosene, etc. (%)
House heating fuel used in houses and condos - Coal or coke (%)
House heating fuel used in houses and condos - Wood (%)
House heating fuel used in houses and condos - Solar energy (%)
House heating fuel used in houses and condos - Other fuel (%)
House heating fuel used in houses and condos - No fuel used (%)
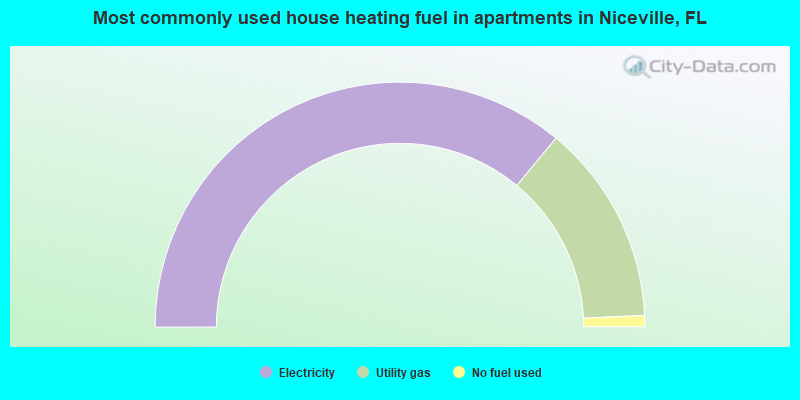
House heating fuel used in apartments - Utility gas (%)
House heating fuel used in apartments - Bottled, tank, or LP gas (%)
House heating fuel used in apartments - Electricity (%)
House heating fuel used in apartments - Fuel oil, kerosene, etc. (%)
House heating fuel used in apartments - Coal or coke (%)
House heating fuel used in apartments - Wood (%)
House heating fuel used in apartments - Solar energy (%)
House heating fuel used in apartments - Other fuel (%)
House heating fuel used in apartments - No fuel used (%)
Latest news about housing in Niceville, FL collected exclusively by city-data.com from local newspapers, TV, and radio stations
Median year house/condo built: 1989Median year apartment built: 1984Household type by relationship:
Households: 16,136
Male householders: 3,095 (449 living alone ), Female householders: 2,734 (782 living alone )3,475 spouses (3,460 opposite-sex spouses ), 352 unmarried partners , (352 opposite-sex unmarried partners ), 5,308 children (4,445 natural , 205 adopted , 657 stepchildren ), 223 grandchildren , 10 brothers or sisters , 215 parents , 12 foster children , 85 other relatives , 540 non-relatives In group quarters: 82
Size of family households: 2,039 2-persons , 1,049 3-persons , 690 4-persons , 625 5-persons , 99 6-persons , 100 7-or-more-persons .
Size of nonfamily households: 1,150 1-person , 130 2-persons , 76 3-persons , 19 4-persons .
2,895 married couples with children. single-parent households (75 men , 679 women ).
90.9% of residents of Niceville speak English at home. of residents speak Spanish at home (83% speak English very well , 12% speak English well , 5% speak English not well ).of residents speak other Indo-European language at home (86% speak English very well , 14% speak English well ).of residents speak Asian or Pacific Island language at home (69% speak English very well , 23% speak English well , 7% speak English not well , 2% don't speak English at all ).
Foreign born population: 832 (5.2%)of them are naturalized citizens )
Median number of rooms in houses and condos:
Median number of rooms in apartments
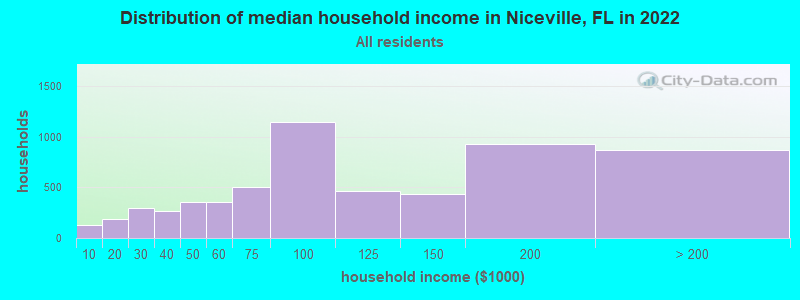
Niceville, FL household income distribution 132 Less than $10,000192 $10,000 to $19,999294 $20,000 to $29,999264 $30,000 to $39,999358 $40,000 to $49,999354 $50,000 to $59,999507 $60,000 to $74,9991,143 $75,000 to $99,999460 $100,000 to $124,999438 $125,000 to $149,999923 $150,000 to $199,999867 $200,000 or more
Home value of owner - occupied houses in 2022 in Niceville, FL 12 $20,000 to $24,99930 $25,000 to $29,99913 $60,000 to $69,99923 $80,000 to $89,9995 $90,000 to $99,99916 $100,000 to $124,99916 $125,000 to $149,99976 $150,000 to $174,999144 $175,000 to $199,999435 $200,000 to $249,999523 $250,000 to $299,9991,136 $300,000 to $399,999644 $400,000 to $499,9991,076 $500,000 to $749,999308 $750,000 to $999,99990 $1,000,000 to $1,499,99918 $1,500,000 to $1,999,999179 $2,000,000 or moreRent paid by renters in 2022 in Niceville, FL 9 $100 to $14929 $150 to $19968 $250 to $29918 $300 to $34926 $350 to $39920 $400 to $44919 $500 to $54919 $550 to $59933 $650 to $69918 $700 to $74965 $750 to $79973 $800 to $89950 $900 to $999183 $1,000 to $1,249513 $1,250 to $1,499247 $1,500 to $1,999146 $2,000 to $2,49943 $2,500 to $2,99968 $3,000 to $3,49980 No cash rent
Percentage of workers working in this county: 86.5%Number of people working at home: 670 (8.6% of all workers )
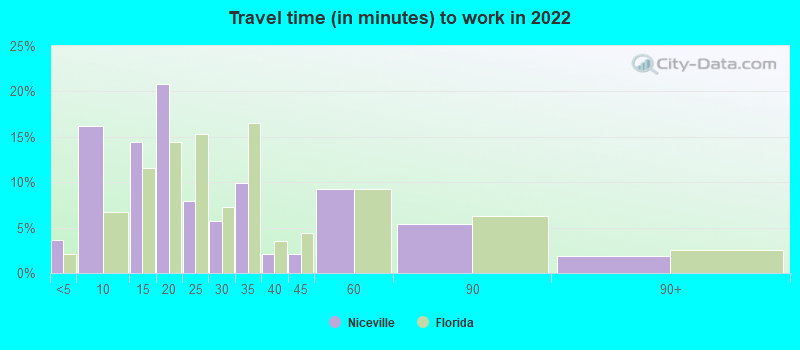
Travel time to work (commute)
Less than 5 minutes: 2105 to 9 minutes: 98110 to 14 minutes: 67015 to 19 minutes: 1,29420 to 24 minutes: 1,23425 to 29 minutes: 54430 to 34 minutes: 67335 to 39 minutes: 20840 to 44 minutes: 34845 to 59 minutes: 40660 to 89 minutes: 33390 or more minutes: 144
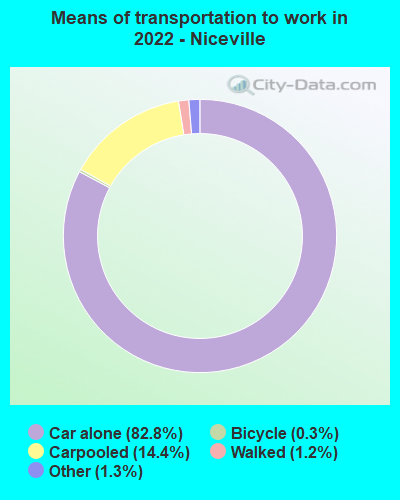
Means of transportation to work:
Drove a car alone: 5,981 (75.0%)Carpooled: 1,130 (14.2%)Taxi: 151 (1.9%)Bicycle: 9 (0.1%)Walked: 80 (1.0%)Worked at home: 670 (8.4%)
Unemployment by race in 2022
Unemployment rate for White non-Hispanic residents 0.7% Males3.3% Females
Year of entry for the foreign-born population in Niceville, Florida
333 2010 or later 211 2000 to 2009 135 1990 to 1999 194 1980 to 1989 149 1970 to 1979 259 Before 1970
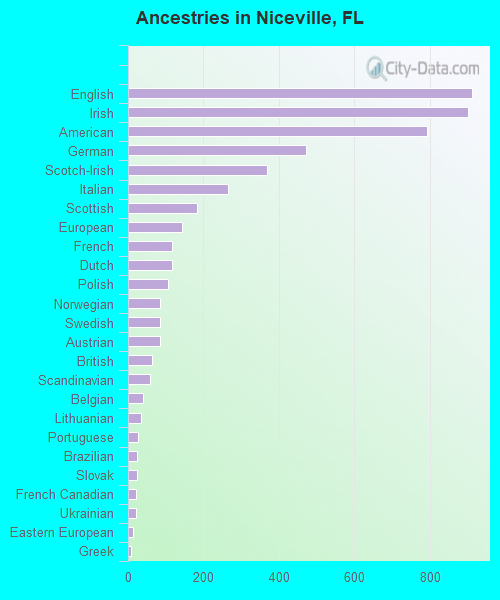
First ancestries reported:
English: 912 (12.6%)
Irish: 901 (12.4%)
American: 794 (11.0%)
German: 471 (6.5%)
Scotch-Irish: 368 (5.1%)
Italian: 266 (3.7%)
Scottish: 182 (2.5%)
European: 144 (2.0%)
French: 118 (1.6%)
Dutch: 117 (1.6%)
Polish: 105 (1.4%)
Norwegian: 86 (1.2%)
Swedish: 86 (1.2%)
Austrian: 85 (1.2%)
British: 64 (0.9%)
Scandinavian: 58 (0.8%)
Belgian: 39 (0.5%)
Lithuanian: 35 (0.5%)
Portuguese: 27 (0.4%)
Brazilian: 24 (0.3%)
Slovak: 23 (0.3%)
French Canadian: 22 (0.3%)
Ukrainian: 22 (0.3%)
Eastern European: 14 (0.2%)
Greek: 9 (0.1%)
African: 7 (0.10%)
Pennsylvania German: 5 (0.07%) Most common places of birth for foreign-born residents (%): Philippines Niceville:
21.0% (188)Florida:
1.8% (84,403)
Canada Niceville:
8.3% (74)Florida:
2.4% (109,132)
Colombia Niceville:
6.4% (57)Florida:
6.5% (298,669)
England Niceville:
5.5% (49)Florida:
0.8% (37,723)
Japan Niceville:
4.0% (36)Florida:
0.2% (10,425)
Korea Niceville:
3.9% (35)Florida:
0.4% (19,445)
Other Australian and New Zealand Subregion Niceville:
3.8% (34)Florida:
0.0% (1,754)
Vietnam Niceville:
3.7% (33)Florida:
1.3% (60,604)
United Kingdom, excluding England and Scotland Niceville:
3.1% (28)Florida:
0.7% (34,227)
Brazil Niceville:
3.0% (27)Florida:
2.7% (122,906)
Russia Niceville:
2.7% (24)Florida:
0.7% (31,076)
Ukraine Niceville:
2.6% (23)Florida:
0.5% (21,886)
India Niceville:
2.5% (22)Florida:
2.1% (94,349)
Taiwan Niceville:
2.3% (21)Florida:
0.2% (8,002)
Other South America Niceville:
2.3% (21)Florida:
0.1% (6,700)
Guatemala Niceville:
2.0% (18)Florida:
2.1% (97,632)
Nepal Niceville:
1.9% (17)Florida:
0.0% (1,511)
Ireland Niceville:
1.8% (16)Florida:
0.2% (9,421)
Germany Niceville:
1.8% (16)Florida:
1.2% (54,272)
Nicaragua Niceville:
1.7% (15)Florida:
2.3% (105,066)
France Niceville:
1.6% (14)Florida:
0.4% (20,008)
Turkey Niceville:
1.6% (14)Florida:
0.2% (10,969)
Panama Niceville:
1.6% (14)Florida:
0.5% (22,972)
Place of birth for U.S.-born residents:
This state: 4,335Other state: 9,832Northeast: 1,358Midwest: 2,921South: 3,822West: 1,746 85.0% of Niceville residents lived in the same house 1 years ago.
Out of people who lived in different houses, 26.4% lived in this county.
Out of people who lived in different counties, 28.3% lived in Florida.
Niceville:
85.0%State average:
86.3%
Education attainment for males 25 years and older:
No schooling: 0Nursery to 4th grade: 05th and 6th grade: 07th and 8th grade: 09th grade: 010th grade: 311th grade: 1712th grade, no diploma: 30High school graduate (or equivalency): 1,297Less than 1 year of college: 453Some college more than 1 year, no degree: 732Associate degree: 821Bachelor's degree: 1,103Master's degree: 612Professional school degree: 195Doctorate degree: 97
Education attainment for females 25 years and older:
No schooling: 36Nursery to 4th grade: 05th and 6th grade: 07th and 8th grade: 539th grade: 4310th grade: 4811th grade: 5112th grade, no diploma: 83High school graduate (or equivalency): 1,349Less than 1 year of college: 421Some college more than 1 year, no degree: 810Associate degree: 720Bachelor's degree: 946Master's degree: 839Professional school degree: 199Doctorate degree: 76
Housing units in structures:
One, detached: 5,230One, attached: 256Two: 1243 or 4: 2515 to 9: 23410 to 19: 4220 to 49: 7750 or more: 80Mobile homes: 222Housing units lacking complete plumbing facilities in 2022: 0.4%Housing units lacking complete kitchen facilities in 2022: 1.4%House/condo owner moved in on average 10 years ago
Renter moved in on average 3 years ago
Private vs. public school enrollment:
Students in private schools in grades 1 to 8 (elementary and middle school): 229 Students in private schools in grades 9 to 12 (high school): 15 Students in private undergraduate colleges: 116