North Antelope Valley, CA (California) Houses and Residents
| North Antelope Valley: | $394,400 |
| California: | $715,900 |
Total population: 153,969 (Urban population: 139,458 (127,973 inside urbanized areas, 11,485 inside urban clusters), Rural population: 11,563 (184 farm, 11,379 nonfarm))
Houses: 53,670 (48,942 occupied: 31,213 owner occupied, 17,729 renter occupied)
| % of renters here: | 36% |
| State: | 44% |
Housing density: 65 houses/condos per square mile
Median price asked for vacant for-sale houses and condos in 2022 in this county: $1,291,802.
Median contract rent in 2022: $1,461 (lower quartile is $1,095, upper quartile is $1,803)
Median rent asked for vacant for-rent units in 2022: $1,422
Median gross rent in North Antelope Valley, CA in 2022: $1,638
Housing units in North Antelope Valley with a mortgage: 22,735 (3,833 second mortgage, 1,147 home equity loan, 55 both second mortgage and home equity loan)
Houses without a mortgage: 3,829
Compare current foreclosures near North Antelope Valley, CA:
| Photo | Address | Area | Beds / Baths | Price | Details |
|---|---|---|---|---|---|

|
#1
Camolin Ave
Lancaster, CA 93534
|
1,259 sq. feet
|
1 baths 3 beds |
show details | |

|
#2
Emerald Ln
Lancaster, CA 93535
|
2,843 sq. feet
|
3 baths 4 beds |
show details | |

|
#3
Satinwood Ln
Palmdale, CA 93551
|
1,912 sq. feet
|
3 baths 4 beds |
show details | |

|
#4
Annecy St
Palmdale, CA 93552
|
2,595 sq. feet
|
3 baths 4 beds |
show details | |

|
#5
Vineyard Dr
Lancaster, CA 93535
|
1,756 sq. feet
|
2 baths 3 beds |
show details | |

|
#6
E Lingard St
Lancaster, CA 93535
|
- sq. feet
|
3 baths 4 beds |
show details | |

|
#7
62nd St W
Lancaster, CA 93536
|
2,928 sq. feet
|
3 baths 4 beds |
show details | |

|
#8
Explorer Way
Palmdale, CA 93552
|
2,124 sq. feet
|
3 baths 3 beds |
show details | |

|
#9
Archwood Way
Palmdale, CA 93552
|
3,661 sq. feet
|
3 baths 4 beds |
show details | |

|
#10
Turner Dr
Palmdale, CA 93550
|
2,196 sq. feet
|
3 baths 4 beds |
show details |
| Photo | Address | Area | Beds / Baths | Price | Details |
|---|---|---|---|---|---|

|
#11
Fenhold St
Lancaster, CA 93535
|
1,574 sq. feet
|
2 baths 4 beds |
show details | |

|
#12
Belleshire Way
Palmdale, CA 93552
|
1,524 sq. feet
|
2 baths 3 beds |
show details | |

|
#13
E Avenue H5
Lancaster, CA 93535
|
1,716 sq. feet
|
2 baths 4 beds |
show details | |

|
#14
W Ave N8
Palmdale, CA 93551
|
2,763 sq. feet
|
3 baths 4 beds |
show details | |

|
#15
Holline Ct
Lancaster, CA 93535
|
1,756 sq. feet
|
3 baths 3 beds |
show details | |

|
#16
East Avenue J3
Lancaster, CA 93535
|
2,933 sq. feet
|
3 baths 4 beds |
show details | |

|
#17
Sancroft Ave
Lancaster, CA 93535
|
1,390 sq. feet
|
2 baths 3 beds |
show details | |

|
#18
E Avenue Q2
Palmdale, CA 93550
|
1,215 sq. feet
|
2 baths 3 beds |
show details | |

|
#19
Monaco Dr
Palmdale, CA 93552
|
2,156 sq. feet
|
3 baths 4 beds |
show details | |

|
#20
Katrina Pl
Palmdale, CA 93552
|
1,746 sq. feet
|
3 baths 4 beds |
show details |
| Photo | Address | Area | Beds / Baths | Price | Details |
|---|---|---|---|---|---|

|
#21
West Avenue N3
Palmdale, CA 93551
|
2,485 sq. feet
|
2 baths 4 beds |
show details | |

|
#22
Softwood Ct
Lancaster, CA 93536
|
1,808 sq. feet
|
2 baths 3 beds |
show details | |

|
#23
Halen St
Palmdale, CA 93552
|
1,406 sq. feet
|
2 baths 3 beds |
show details | |

|
#24
Landsford St
Lancaster, CA 93535
|
1,504 sq. feet
|
2 baths 3 beds |
show details | |

|
#25
Fairfield Ave
Palmdale, CA 93550
|
1,908 sq. feet
|
3 baths 4 beds |
show details | |

|
#26
Carefree Ct
Lancaster, CA 93535
|
1,357 sq. feet
|
2 baths 3 beds |
show details | |

|
#27
Rainbow Ter
Palmdale, CA 93551
|
1,290 sq. feet
|
2 baths 3 beds |
show details | |

|
#28
Boxthorn St
Palmdale, CA 93552
|
1,281 sq. feet
|
2 baths 3 beds |
show details | |

|
#29
Vista Serena Ct
Lancaster, CA 93536
|
1,951 sq. feet
|
2 baths 3 beds |
show details | |

|
#30
Lightcap St
Lancaster, CA 93535
|
1,449 sq. feet
|
2 baths 3 beds |
show details |
| Photo | Address | Area | Beds / Baths | Price | Details |
|---|---|---|---|---|---|

|
#31
East Avenue H8
Lancaster, CA 93535
|
1,176 sq. feet
|
2 baths 3 beds |
show details | |

|
#32
E Avenue I
Lancaster, CA 93535
|
1,238 sq. feet
|
2 baths 1 beds |
show details | |

|
#33
Foxton Ave
Lancaster, CA 93535
|
1,486 sq. feet
|
2 baths 4 beds |
show details | |

|
#34
53rd St E
Palmdale, CA 93552
|
1,050 sq. feet
|
2 baths 3 beds |
show details | |

|
#35
Tamara Pl
Palmdale, CA 93550
|
2,433 sq. feet
|
3 baths 5 beds |
show details | |

|
#36
E. Avenue R
Palmdale, CA 93550
|
1,100 sq. feet
|
2 baths 2 beds |
show details | |

|
#37
E Kildare St
Lancaster, CA 93535
|
1,637 sq. feet
|
3 baths 3 beds |
show details | |

|
#38
Clear View Ct
Palmdale, CA 93551
|
3,272 sq. feet
|
3 baths 5 beds |
show details | |

|
#39
Melton Ave
Palmdale, CA 93550
|
1,285 sq. feet
|
1 baths 3 beds |
show details | |

|
#40
E Avenue Q
Palmdale, CA 93591
|
1,134 sq. feet
|
2 baths 3 beds |
show details |
| Photo | Address | Area | Beds / Baths | Price | Details |
|---|---|---|---|---|---|

|
#41
Orange St
Rosamond, CA 93560
|
2,179 sq. feet
|
2 baths 4 beds |
show details | |

|
#42
Scomar St
Palmdale, CA 93550
|
1,585 sq. feet
|
3 baths 3 beds |
show details | |

|
#43
Montellano Ave
Palmdale, CA 93551
|
3,163 sq. feet
|
3 baths 5 beds |
show details | |

|
#44
Willowvale Rd
Palmdale, CA 93551
|
1,692 sq. feet
|
2 baths 3 beds |
show details | |

|
#45
Tesoro Ln
Palmdale, CA 93551
|
3,576 sq. feet
|
3 baths 5 beds |
show details | |

|
#46
Diamond St
Rosamond, CA 93560
|
3,784 sq. feet
|
4 baths 8 beds |
show details | |

|
#47
Rosegold Ave
Rosamond, CA 93560
|
- sq. feet
|
2 baths 4 beds |
show details | |

|
#48
Cisero Dr
Palmdale, CA 93552
|
1,959 sq. feet
|
3 baths 4 beds |
show details | |

|
#49
West Ave C8
Lancaster, CA 93536
|
3,328 sq. feet
|
3 baths 5 beds |
show details | |

|
Check over 1 million property listings on Foreclosure.com!
|
browse all offers | |||

Household type by relationship:
Households: 9,646,924- In family households: 8,234,154 (1,430,848 male householders, 763,232 female householders)
1,480,665 spouses, 3,033,524 children (2,872,074 natural, 53,496 adopted, 107,954 stepchildren), 308,856 grandchildren, 205,746 brothers or sisters, 184,807 parents, foster children, 318,669 other relatives, 372,007 non-relatives
- In nonfamily households: 1,412,770 (510,532 male householders (360,530 living alone)), 536,592 female householders (424,398 living alone)), 365,646 nonrelatives
- In group quarters: 171,681 (68,682 institutionalized population)
1,648,001 married couples with children.
626,289 single-parent households (146,085 men, 480,204 women).
78.4% of residents of North Antelope Valley speak English at home.
16.7% of residents speak Spanish at home (56% speak English very well, 23% speak English well, 15% speak English not well, 7% don't speak English at all).
1.9% of residents speak other Indo-European language at home (76% speak English very well, 16% speak English well, 6% speak English not well, 2% don't speak English at all).
2.3% of residents speak Asian or Pacific Island language at home (63% speak English very well, 27% speak English well, 9% speak English not well, 1% don't speak English at all).
0.7% of residents speak other language at home (61% speak English very well, 29% speak English well, 6% speak English not well, 3% don't speak English at all).
Foreign born population: 17,595 (11.4%)
(63.2% of them are naturalized citizens)
| Here: | 5.8 |
| State: | 6.0 |
| Here: | 4.9 |
| State: | 3.9 |

- Bedrooms in owner-occupied houses and condos in North Antelope Valley, California
- 484no bedroom
- 1,6211 bedroom
- 4,3502 bedrooms
- 15,0403 bedrooms
- 8,6194 bedrooms
- 1,0995+ bedrooms

- Bedrooms in renter-occupied apartments in North Antelope Valley, California
- 1,027no bedroom
- 4,3871 bedroom
- 6,6432 bedrooms
- 4,1273 bedrooms
- 1,4594 bedrooms
- 865+ bedrooms

- Cars and other vehicles available in North Antelope Valley in owner-occupied houses/condos
- 1,140no vehicle
- 8,1201 vehicle
- 14,0112 vehicles
- 5,9263 vehicles
- 1,5104 vehicles
- 5065+ vehicles

- Cars and other vehicles available in North Antelope Valley in renter-occupied apartments
- 3,299no vehicle
- 8,3971 vehicle
- 4,8042 vehicles
- 9203 vehicles
- 1724 vehicles
- 1375+ vehicles

- Rooms in owner-occupied houses in North Antelope Valley, California
- 1021 room
- 5362 rooms
- 2,2453 rooms
- 2,0904 rooms
- 7,2835 rooms
- 7,8856 rooms
- 5,9557 rooms
- 3,0508 rooms
- 2,0679+ rooms

- Rooms in renter-occupied apartments in North Antelope Valley, California
- 6291 room
- 2,3672 rooms
- 3,1763 rooms
- 4,3494 rooms
- 3,6535 rooms
- 2,2226 rooms
- 8037 rooms
- 3738 rooms
- 1579+ rooms


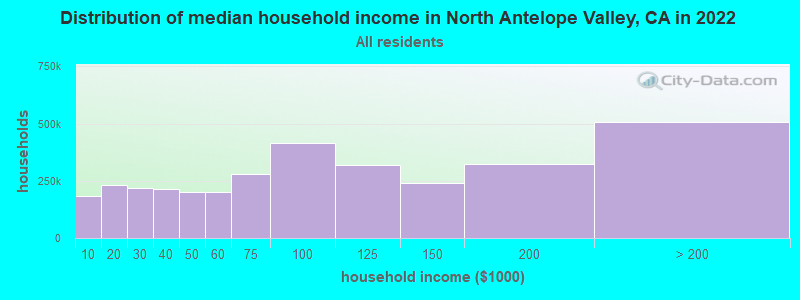
North Antelope Valley, CA household income distribution

- 183,774Less than $10,000
- 231,667$10,000 to $19,999
- 217,357$20,000 to $29,999
- 214,497$30,000 to $39,999
- 202,803$40,000 to $49,999
- 202,965$50,000 to $59,999
- 279,582$60,000 to $74,999
- 412,670$75,000 to $99,999
- 320,602$100,000 to $124,999
- 241,858$125,000 to $149,999
- 323,992$150,000 to $199,999
- 506,557$200,000 or more
Percentage of workers working in this county: 90.0%
Number of people working at home: 11,354 (17.0% of all workers)
Travel time to work (commute)
- Less than 5 minutes: 1,425
- 5 to 9 minutes: 6,234
- 10 to 14 minutes: 9,349
- 15 to 19 minutes: 7,916
- 20 to 24 minutes: 4,542
- 25 to 29 minutes: 1,235
- 30 to 34 minutes: 3,539
- 35 to 39 minutes: 1,114
- 40 to 44 minutes: 1,661
- 45 to 59 minutes: 3,781
- 60 to 89 minutes: 6,324
- 90 or more minutes: 5,199
Means of transportation to work:
- Drove a car alone: 39,945 (73.9%)
- Carpooled: 9,868 (18.3%)
- Bus or trolley bus: 672 (1.2%)
- Streetcar or trolley car: 18 (0.0%)
- Subway or elevated: 23 (0.0%)
- Railroad: 229 (0.4%)
- Taxi: 31 (0.1%)
- Motorcycle: 198 (0.4%)
- Bicycle: 209 (0.4%)
- Walked: 819 (1.5%)
- Other means: 307 (0.6%)
- Worked at home: 1,743 (3.2%)


- Year of entry for the foreign-born population in North Antelope Valley, California
- 2,2951995 to March 2000
- 2,9801990 to 1994
- 3,4571985 to 1989
- 2,9111980 to 1984
- 2,1671975 to 1979
- 1,7741970 to 1974
- 1,2521965 to 1969
- 2,008Before 1965
Most common places of birth for foreign-born residents (%):
| North Antelope Valley: | 46.2% (8,698) |
| California: | 44.3% (3,928,701) |
| North Antelope Valley: | 7.6% (1,441) |
| California: | 7.5% (664,935) |
| North Antelope Valley: | 6.3% (1,187) |
| California: | 4.1% (359,673) |
| North Antelope Valley: | 3.7% (695) |
| California: | 2.4% (211,458) |
| North Antelope Valley: | 3.1% (576) |
| California: | 1.5% (133,090) |
| North Antelope Valley: | 3.0% (556) |
| California: | 1.6% (141,181) |
| North Antelope Valley: | 2.0% (384) |
| California: | 1.1% (98,160) |
| North Antelope Valley: | 1.6% (306) |
| California: | 2.2% (198,201) |
| North Antelope Valley: | 1.6% (296) |
| California: | 3.7% (327,611) |
| North Antelope Valley: | 1.5% (283) |
| California: | 3.0% (268,452) |
Place of birth for U.S.-born residents:
- This state: 87,142
- Other state: 43,464
- Northeast: 7,736
- Midwest: 14,485
- South: 13,648
- West: 7,595
46% of North Antelope Valley residents lived in the same house 5 years ago.
Out of people who lived in different houses, 78% lived in this county.
Out of people who lived in different counties, 60% lived in California.
Education attainment for males 25 years and older:
- No schooling: 736
- Nursery to 4th grade: 310
- 5th and 6th grade: 956
- 7th and 8th grade: 920
- 9th grade: 1,125
- 10th grade: 1,178
- 11th grade: 1,847
- 12th grade, no diploma: 2,763
- High school graduate (or equivalency): 11,230
- Less than 1 year of college: 4,492
- Some college more than 1 year, no degree: 8,134
- Associate degree: 3,408
- Bachelor's degree: 4,524
- Master's degree: 2,110
- Professional school degree: 450
- Doctorate degree: 268

Education attainment for females 25 years and older:
- No schooling: 597
- Nursery to 4th grade: 291
- 5th and 6th grade: 847
- 7th and 8th grade: 1,072
- 9th grade: 864
- 10th grade: 1,303
- 11th grade: 1,976
- 12th grade, no diploma: 2,587
- High school graduate (or equivalency): 11,950
- Less than 1 year of college: 4,683
- Some college more than 1 year, no degree: 8,338
- Associate degree: 3,708
- Bachelor's degree: 4,326
- Master's degree: 1,519
- Professional school degree: 399
- Doctorate degree: 69

Housing units in structures:
- One, detached: 36,467
- One, attached: 1,407
- Two: 638
- 3 or 4: 2,317
- 5 to 9: 2,658
- 10 to 19: 1,760
- 20 to 49: 913
- 50 or more: 2,843
- Mobile homes: 4,463
- Boats, RVs, vans, etc.: 204
Median worth of mobile homes: $64,372
Housing units lacking complete kitchen facilities: 1.5%

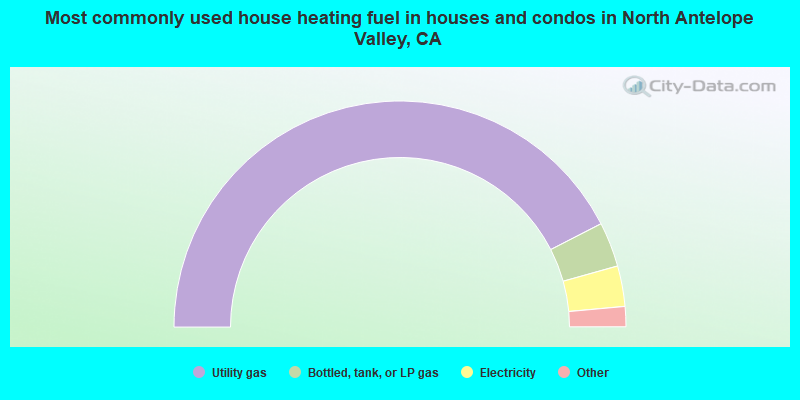
- 85.0%Utility gas
- 6.4%Bottled, tank, or LP gas
- 5.8%Electricity
- 2.3%Wood
- 0.3%Other fuel
- 0.2%No fuel used
- 0.1%Fuel oil, kerosene, etc.
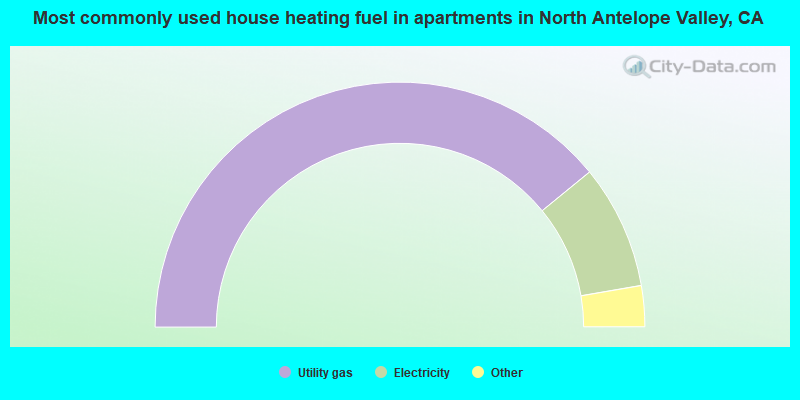
- 78.2%Utility gas
- 16.4%Electricity
- 3.9%Bottled, tank, or LP gas
- 0.7%Wood
- 0.3%No fuel used
- 0.3%Other fuel
Private vs. public school enrollment:
| Here: | 10.8% |
| California: | 9.9% |
| Here: | 10.6% |
| California: | 7.8% |
| Here: | 15.0% |
| California: | 15.4% |


