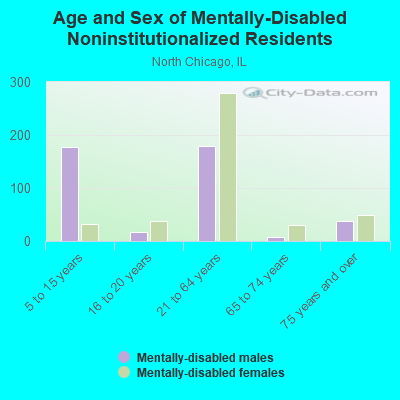
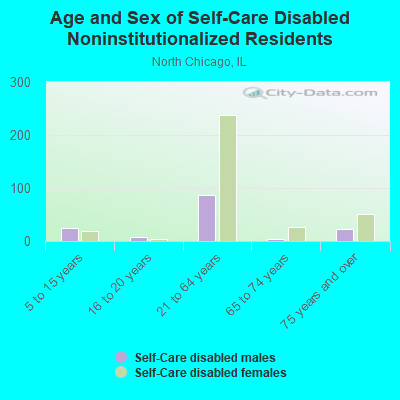
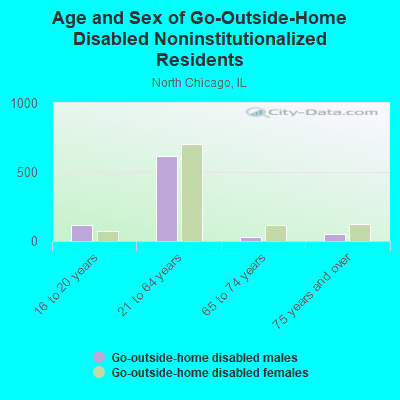
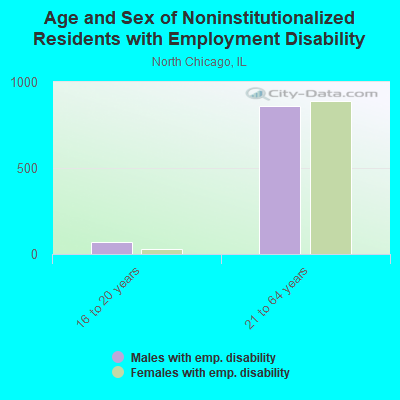
North Chicago, IL (Illinois) Houses and Residents
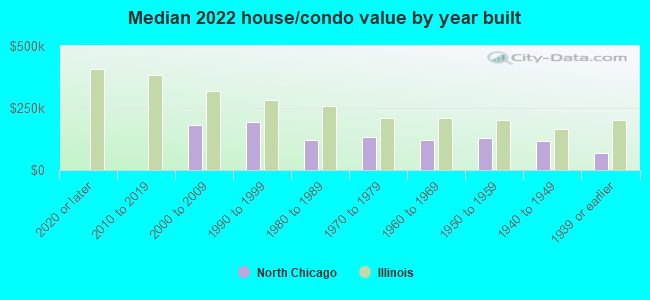
Estimated median house or condo value in 2022: $136,261 (it was $101,400 in 2000 )
North Chicago:
$136,261Illinois:
$251,600
Lower value quartile - upper value quartile: $96,154 - $183,008Mean price in 2022: Detached houses: $149,414 Here:
$149,414State:
$310,164
Townhouses or other attached units: $228,125 Here:
$228,125State:
$286,230
In 2-unit structures: $177,072 Here:
$177,072State:
$299,638
In 3-to-4-unit structures: $71,163 Here:
$71,163State:
$330,907
In 5-or-more-unit structures: $175,482 Here:
$175,482State:
$318,887
Total population: 30,395 (All urban)
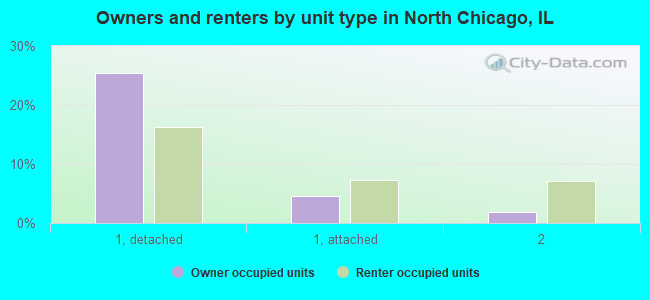
Houses: 8,364 (7,521 occupied: 2,428 owner occupied, 5,236 renter occupied )
% of renters here:
68%State:
33%
Housing density: 1,068 houses/condos per square mile
Median price asked for vacant for-sale houses and condos in 2022: $98,467.
Median contract rent in 2022: $1,189 (lower quartile is $828, upper quartile is $1,533)
Median rent asked for vacant for-rent units in 2022: $1,200
Median gross rent in North Chicago, IL in 2022: $1,373
Housing units in North Chicago with a mortgage: 1,407 (55 second mortgage, 0 home equity loan, 30 both second mortgage and home equity loan )Houses without a mortgage: 0
Median household income for houses/condos with a mortgage: $87,191
Median household income for apartments without a mortgage: $62,205
Median monthly housing costs: $1,247
Data:
Median house or condo value ($)
Median house or condo value ($ change since 2000)
Median house or condo value ($) - White
Median house or condo value ($) - Black or African American
Median house or condo value ($) - Asian
Median house or condo value ($) - Hispanic or Latino
Median house or condo value ($) - American Indian and Alaska Native
Median house or condo value ($) - Multirace
Median house or condo value ($) - Other Race
Median price asked for mobile homes ($)
Household density (households per square mile)
Mean house or condo value by units in structure - 1, detached ($)
Mean house or condo value by units in structure - 1, attached ($)
Mean house or condo value by units in structure - 2 ($)
Mean house or condo value by units in structure by units in structure - 3 or 4 ($)
Mean house or condo value by units in structure - 5 or more ($)
Mean house or condo value by units in structure - Boat, RV, van, etc. ($)
Mean house or condo value by units in structure - Mobile home ($)
Median contract rent ($)
Median contract rent - Lower quartile ($)
Median contract rent - Upper quartile ($)
Median gross rent ($)
Urban houses (%)
Rural houses (%)
Houses occupied (%)
Houses occupied (% change since 2000)
Houses owner occupied (%)
Houses owner occupied (% change since 2000)
Houses renter occupied (%)
Houses renter occupied (% change since 2000)
Vacant housing units - For rent (%)
Vacant housing units - For rent (% change since 2000)
Vacant housing units - For sale only (%)
Vacant housing units - For sale only (% change since 2000)
Vacant housing units - Rented or sold, not occupied (%)
Vacant housing units - Rented or sold, not occupied (% change since 2000)
Vacant housing units - For seasonal, recreational, or occasional use (%)
Vacant housing units - For seasonal, recreational, or occasional use (% change since 2000)
Vacant housing units - For migrant workers (%)
Vacant housing units - For migrant workers (% change since 2000)
Vacant housing units - Other vacant (%)
Vacant housing units - Other vacant (% change since 2000)
Median monthly housing costs ($)
Median household income for houses/condos with a mortgage ($)
Median household income for houses/condos without a mortgage ($)
Median household income ($)
Median household income ($) - White
Median household income ($) - Black or African American
Median household income ($) - Asian
Median household income ($) - Hispanic or Latino
Median household income ($) - American Indian and Alaska Native
Median household income ($) - Multirace
Median household income ($) - Other Race
Mortgage status - with mortgage (%)
Mortgage status - with second mortgage (%)
Mortgage status - with home equity loan (%)
Mortgage status - with both second mortgage and home equity loan (%)
Mortgage status - without a mortgage (%)
Median year house/condo built
Median year apartment built
Household type by relationship - Male householder living alone (%)
Household type by relationship - Male householder not living alone (%)
Household type by relationship - Female householder living alone (%)
Household type by relationship - Female householder not living alone (%)
Household type by relationship - Opposite-Sex spouse (%)
Household type by relationship - Same-Sex spouse (%)
Household type by relationship - Opposite-Sex unmarried partner (%)
Household type by relationship - Same-Sex unmarried partner (%)
Household type by relationship - In group quarters (%)
Size of family households - 2-person household (%)
Size of family households - 3-person household (%)
Size of family households - 4-person household (%)
Size of family households - 5-person household (%)
Size of family households - 6-person household (%)
Size of family households - 7-or-more-person household (%)
Size of nonfamily households - 1-person household (%)
Size of nonfamily households - 2-person household (%)
Size of nonfamily households - 3-person household (%)
Size of nonfamily households - 4-person household (%)
Size of nonfamily households - 5-person household (%)
Size of nonfamily households - 6-person household (%)
Size of nonfamily households - 7-or-moreperson household (%)
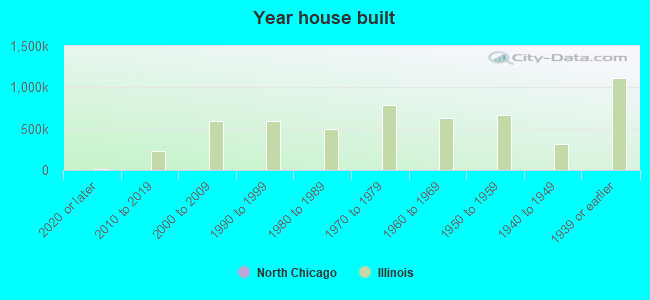
Year house built - Built 2010 or later (%)
Year house built - Built 2000 to 2009 (%)
Year house built - Built 1990 to 1999 (%)
Year house built - Built 1980 to 1989 (%)
Year house built - Built 1970 to 1979 (%)
Year house built - Built 1960 to 1969 (%)
Year house built - Built 1950 to 1959 (%)
Year house built - Built 1940 to 1949 (%)
Year house built - Built 1939 or earlier (%)
Median number of rooms in houses and condos
Median number of rooms in apartments
Median number of bedrooms in owner occupied houses
Mean number of bedrooms in owner occupied houses
Median number of bedrooms in renter occupied houses
Mean number of bedrooms in renter occupied houses
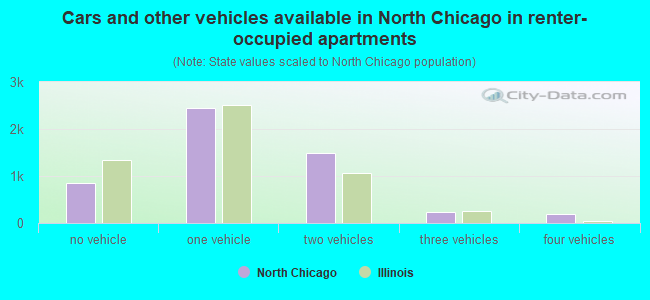
Median number of vehichles in owner occupied houses
Mean number of vehichles in owner occupied houses
Median number of vehichles in renter occupied houses
Mean number of vehichles in renter occupied houses
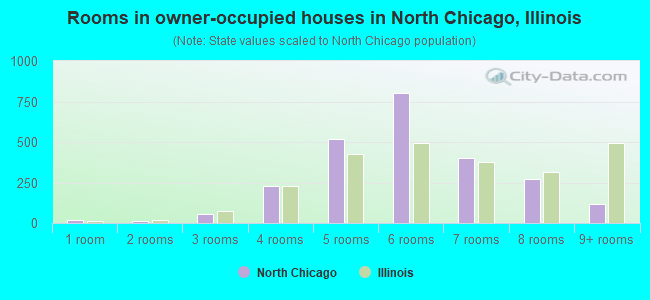
Rooms in owner-occupied houses - 1 room (%)
Rooms in owner-occupied houses - 2 rooms (%)
Rooms in owner-occupied houses - 3 rooms (%)
Rooms in owner-occupied houses - 4 rooms (%)
Rooms in owner-occupied houses - 5 rooms (%)
Rooms in owner-occupied houses - 6 rooms (%)
Rooms in owner-occupied houses - 7 rooms (%)
Rooms in owner-occupied houses - 8 rooms (%)
Rooms in owner-occupied houses - 9+ rooms (%)
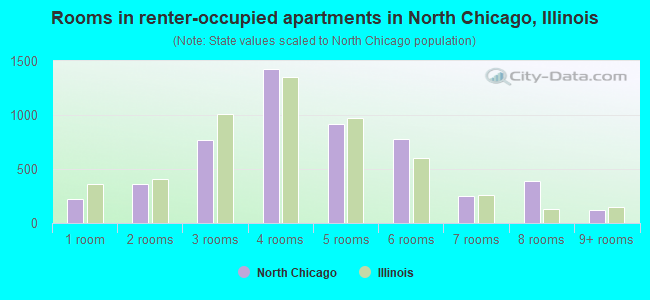
Rooms in renter-occupied houses - 1 room (%)
Rooms in renter-occupied houses - 2 rooms (%)
Rooms in renter-occupied houses - 3 rooms (%)
Rooms in renter-occupied houses - 4 rooms (%)
Rooms in renter-occupied houses - 5 rooms (%)
Rooms in renter-occupied houses - 6 rooms (%)
Rooms in renter-occupied houses - 7 rooms (%)
Rooms in renter-occupied houses - 8 rooms (%)
Rooms in renter-occupied houses - 9+ rooms (%)
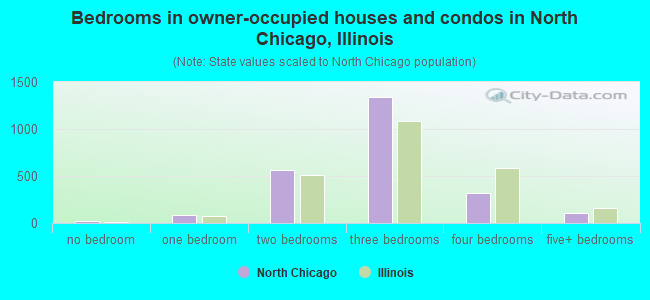
Bedrooms in owner-occupied houses - no bedrooms (%)
Bedrooms in owner-occupied houses - 1 bedroom (%)
Bedrooms in owner-occupied houses - 2 bedrooms (%)
Bedrooms in owner-occupied houses - 3 bedrooms (%)
Bedrooms in owner-occupied houses - 4 bedrooms (%)
Bedrooms in owner-occupied houses - 5+ bedrooms (%)
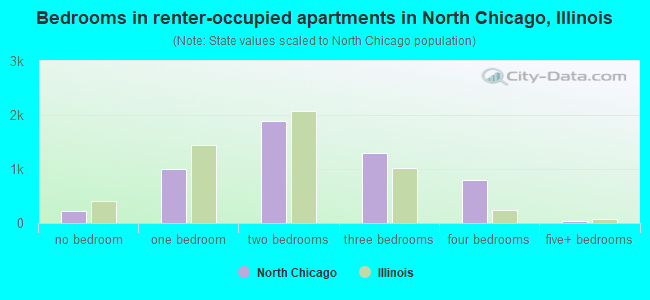
Bedrooms in renter-occupied houses - no bedrooms (%)
Bedrooms in renter-occupied houses - 1 bedroom (%)
Bedrooms in renter-occupied houses - 2 bedrooms (%)
Bedrooms in renter-occupied houses - 3 bedrooms (%)
Bedrooms in renter-occupied houses - 4 bedrooms (%)
Bedrooms in renter-occupied houses - 5+ bedrooms (%)
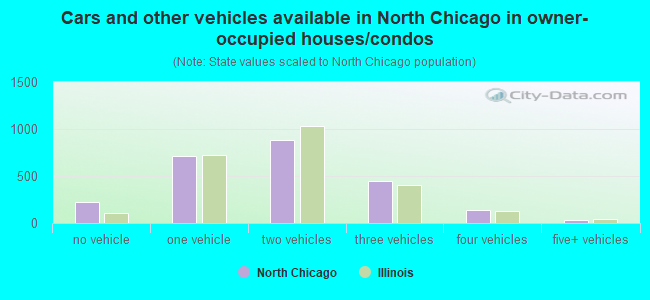
Vehicles available in owner-occupied houses - no vehicle available (%)
Vehicles available in owner-occupied houses - 1 vehicle available(%)
Vehicles available in owner-occupied houses - 2 Vehicles available (%)
Vehicles available in owner-occupied houses - 3 Vehicles available (%)
Vehicles available in owner-occupied houses - 4 Vehicles available (%)
Vehicles available in owner-occupied houses - 5+ Vehicles available (%)
Vehicles available in renter-occupied houses - no vehicle available (%)
Vehicles available in renter-occupied houses - 1 vehicle available (%)
Vehicles available in renter-occupied houses - 2 Vehicles available (%)
Vehicles available in renter-occupied houses - 3 Vehicles available (%)
Vehicles available in renter-occupied houses - 4 Vehicles available (%)
Vehicles available in renter-occupied houses - 5+ Vehicles available (%)
Housing units in structures - 1, detached (%)
Housing units in structures - 1, attached (%)
Housing units in structures - 2 (%)
Housing units in structures - 3 or 4 (%)
Housing units in structures - 5 to 9 (%)
Housing units in structures - 10 to 19 (%)
Housing units in structures - 20 to 49 (%)
Housing units in structures - 50 or more (%)
Housing units in structures - Mobile home (%)
Housing units in structures - Boat, RV, van, etc. (%)
Housing units in structures - Owners - 1, detached (%)
Housing units in structures - Owners - 1, attached (%)
Housing units in structures - Owners - 2 (%)
Housing units in structures - Owners - 3 or 4 (%)
Housing units in structures - Owners - 5 to 9 (%)
Housing units in structures - Owners - 10 to 19 (%)
Housing units in structures - Owners - 20 to 49 (%)
Housing units in structures - Owners - 50 or more (%)
Housing units in structures - Owners - Mobile home (%)
Housing units in structures - Owners - Boat, RV, van, etc. (%)
Housing units in structures - Renters - 1, detached (%)
Housing units in structures - Renters - 1, attached (%)
Housing units in structures - Renters - 2 (%)
Housing units in structures - Renters - 3 or 4 (%)
Housing units in structures - Renters - 5 to 9 (%)
Housing units in structures - Renters - 10 to 19 (%)
Housing units in structures - Renters - 20 to 49 (%)
Housing units in structures - Renters - 50 or more (%)
Housing units in structures - Renters - Mobile home (%)
Housing units in structures - Renters - Boat, RV, van, etc. (%)
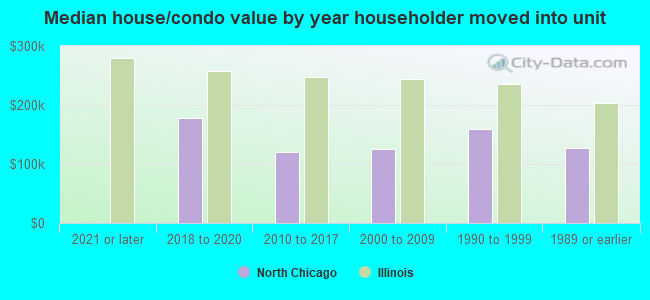
House/condo owner moved in on average (years ago)
Renter moved in on average (years ago)
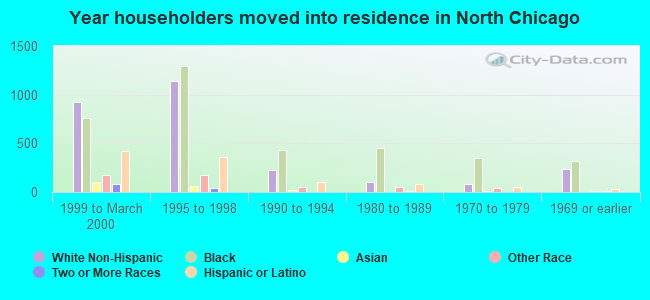
Year householder moved into unit - Moved in 1999 to March 2000 (%)
Year householder moved into unit - Moved in 1999 to March 2000 (%) - White
Year householder moved into unit - Moved in 1999 to March 2000 (%) - Black or African American
Year householder moved into unit - Moved in 1999 to March 2000 (%) - Asian
Year householder moved into unit - Moved in 1999 to March 2000 (%) - Hispanic or Latino
Year householder moved into unit - Moved in 1999 to March 2000 (%) - American Indian and Alaska Native
Year householder moved into unit - Moved in 1999 to March 2000 (%) - Multirace
Year householder moved into unit - Moved in 1999 to March 2000 (%) - Other Race
Year householder moved into unit - Moved in 1995 to 1998 (%)
Year householder moved into unit - Moved in 1995 to 1998 (%) - White
Year householder moved into unit - Moved in 1995 to 1998 (%) - Black or African American
Year householder moved into unit - Moved in 1995 to 1998 (%) - Asian
Year householder moved into unit - Moved in 1995 to 1998 (%) - Hispanic or Latino
Year householder moved into unit - Moved in 1995 to 1998 (%) - American Indian and Alaska Native
Year householder moved into unit - Moved in 1995 to 1998 (%) - Multirace
Year householder moved into unit - Moved in 1995 to 1998 (%) - Other Race
Year householder moved into unit - Moved in 1990 to 1994 (%)
Year householder moved into unit - Moved in 1990 to 1994 (%) - White
Year householder moved into unit - Moved in 1990 to 1994 (%) - Black or African American
Year householder moved into unit - Moved in 1990 to 1994 (%) - Asian
Year householder moved into unit - Moved in 1990 to 1994 (%) - Hispanic or Latino
Year householder moved into unit - Moved in 1990 to 1994 (%) - American Indian and Alaska Native
Year householder moved into unit - Moved in 1990 to 1994 (%) - Multirace
Year householder moved into unit - Moved in 1990 to 1994 (%) - Other Race
Year householder moved into unit - Moved in 1980 to 1989 (%)
Year householder moved into unit - Moved in 1980 to 1989 (%) - White
Year householder moved into unit - Moved in 1980 to 1989 (%) - Black or African American
Year householder moved into unit - Moved in 1980 to 1989 (%) - Asian
Year householder moved into unit - Moved in 1980 to 1989 (%) - Hispanic or Latino
Year householder moved into unit - Moved in 1980 to 1989 (%) - American Indian and Alaska Native
Year householder moved into unit - Moved in 1980 to 1989 (%) - Multirace
Year householder moved into unit - Moved in 1980 to 1989 (%) - Other Race
Year householder moved into unit - Moved in 1970 to 1979 (%)
Year householder moved into unit - Moved in 1970 to 1979 (%) - White
Year householder moved into unit - Moved in 1970 to 1979 (%) - Black or African American
Year householder moved into unit - Moved in 1970 to 1979 (%) - Asian
Year householder moved into unit - Moved in 1970 to 1979 (%) - Hispanic or Latino
Year householder moved into unit - Moved in 1970 to 1979 (%) - American Indian and Alaska Native
Year householder moved into unit - Moved in 1970 to 1979 (%) - Multirace
Year householder moved into unit - Moved in 1970 to 1979 (%) - Other Race
Year householder moved into unit - Moved in 1969 or earlier (%)
Year householder moved into unit - Moved in 1969 or earlier (%) - White
Year householder moved into unit - Moved in 1969 or earlier (%) - Black or African American
Year householder moved into unit - Moved in 1969 or earlier (%) - Asian
Year householder moved into unit - Moved in 1969 or earlier (%) - Hispanic or Latino
Year householder moved into unit - Moved in 1969 or earlier (%) - American Indian and Alaska Native
Year householder moved into unit - Moved in 1969 or earlier (%) - Multirace
Year householder moved into unit - Moved in 1969 or earlier (%) - Other Race
Housing units lacking complete plumbing facilities (%)
Housing units lacking complete kitchen facilities (%)
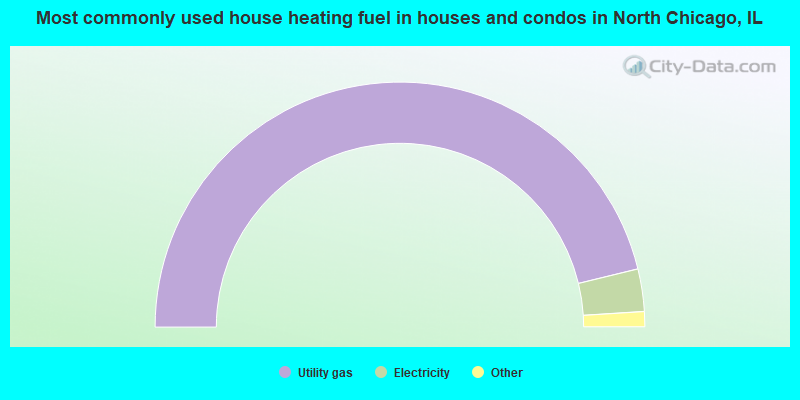
House heating fuel used in houses and condos - Utility gas (%)
House heating fuel used in houses and condos - Bottled, tank, or LP gas (%)
House heating fuel used in houses and condos - Electricity (%)
House heating fuel used in houses and condos - Fuel oil, kerosene, etc. (%)
House heating fuel used in houses and condos - Coal or coke (%)
House heating fuel used in houses and condos - Wood (%)
House heating fuel used in houses and condos - Solar energy (%)
House heating fuel used in houses and condos - Other fuel (%)
House heating fuel used in houses and condos - No fuel used (%)
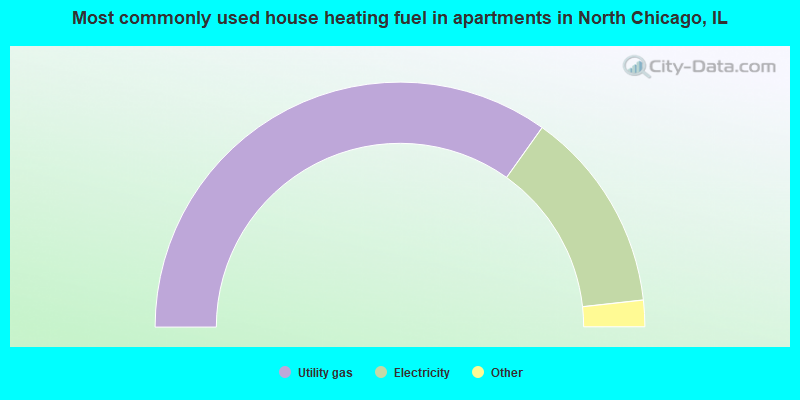
House heating fuel used in apartments - Utility gas (%)
House heating fuel used in apartments - Bottled, tank, or LP gas (%)
House heating fuel used in apartments - Electricity (%)
House heating fuel used in apartments - Fuel oil, kerosene, etc. (%)
House heating fuel used in apartments - Coal or coke (%)
House heating fuel used in apartments - Wood (%)
House heating fuel used in apartments - Solar energy (%)
House heating fuel used in apartments - Other fuel (%)
House heating fuel used in apartments - No fuel used (%)
Median year house/condo built: 1966Median year apartment built: 1975Household type by relationship:
Households: 30,716
Male householders: 4,047 (1,264 living alone ), Female householders: 3,397 (1,080 living alone )2,541 spouses (2,521 opposite-sex spouses ), 387 unmarried partners , (365 opposite-sex unmarried partners ), 6,082 children (5,808 natural , 102 adopted , 172 stepchildren ), 799 grandchildren , 446 brothers or sisters , 343 parents , 0 foster children , 510 other relatives , 942 non-relatives In group quarters: 11,217
Size of family households: 1,343 2-persons , 975 3-persons , 1,253 4-persons , 422 5-persons , 192 6-persons , 273 7-or-more-persons .
Size of nonfamily households: 2,476 1-person , 722 2-persons , 10 3-persons , 19 4-persons , 25 6-persons .
2,627 married couples with children. single-parent households (313 men , 1,177 women ).
64.9% of residents of North Chicago speak English at home. of residents speak Spanish at home (57% speak English very well , 18% speak English well , 17% speak English not well , 8% don't speak English at all ).of residents speak other Indo-European language at home (82% speak English very well , 12% speak English well , 6% speak English not well ).of residents speak Asian or Pacific Island language at home (61% speak English very well , 36% speak English well , 1% speak English not well , 1% don't speak English at all ).of residents speak other language at home (100% speak English very well ).
Foreign born population: 5,679 (18.5%)of them are naturalized citizens )
Median number of rooms in houses and condos:
Median number of rooms in apartments
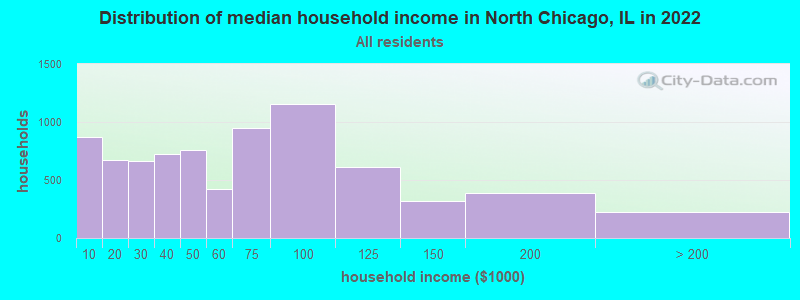
North Chicago, IL household income distribution 873 Less than $10,000670 $10,000 to $19,999667 $20,000 to $29,999727 $30,000 to $39,999755 $40,000 to $49,999420 $50,000 to $59,999946 $60,000 to $74,9991,159 $75,000 to $99,999608 $100,000 to $124,999319 $125,000 to $149,999392 $150,000 to $199,999226 $200,000 or more
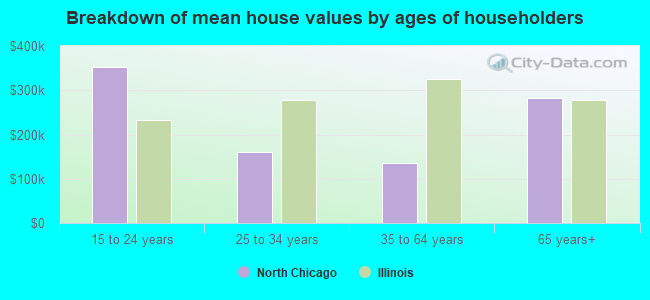
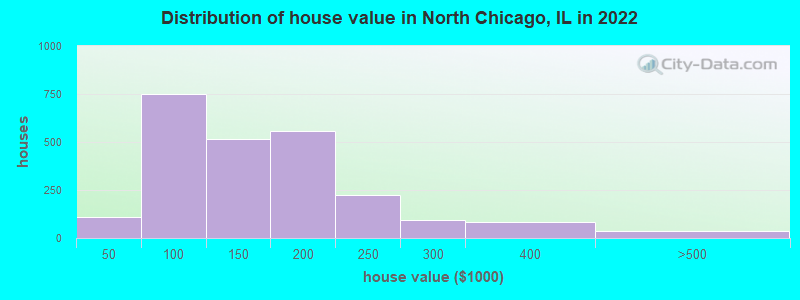
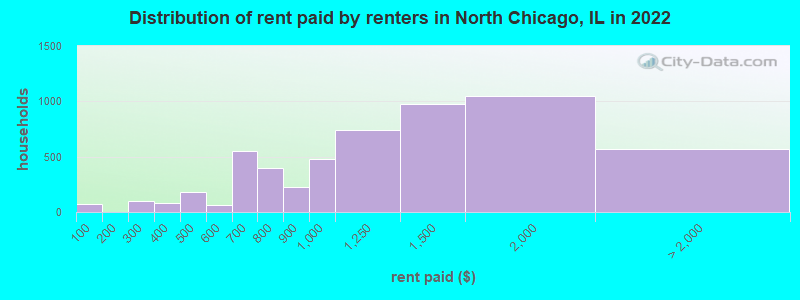
Home value of owner - occupied houses in 2022 in North Chicago, IL 38 Less than $10,00012 $15,000 to $19,9995 $20,000 to $24,99952 $40,000 to $49,99946 $50,000 to $59,999100 $60,000 to $69,999194 $70,000 to $79,999242 $80,000 to $89,999110 $90,000 to $99,999378 $100,000 to $124,999135 $125,000 to $149,999335 $150,000 to $174,999222 $175,000 to $199,999223 $200,000 to $249,99994 $250,000 to $299,99983 $300,000 to $399,99927 $400,000 to $499,9992 $750,000 to $999,9998 $2,000,000 or moreRent paid by renters in 2022 in North Chicago, IL 74 Less than $10043 $200 to $24952 $250 to $29926 $300 to $34958 $350 to $399142 $400 to $44941 $450 to $49931 $500 to $54933 $550 to $599440 $600 to $649109 $650 to $699255 $700 to $749140 $750 to $799222 $800 to $899483 $900 to $999743 $1,000 to $1,249974 $1,250 to $1,4991,045 $1,500 to $1,999247 $2,000 to $2,499101 $2,500 to $2,9992 $3,000 to $3,499217 No cash rent
Percentage of workers working in this county: 95.0%Number of people working at home: 3,820 (21.6% of all workers )
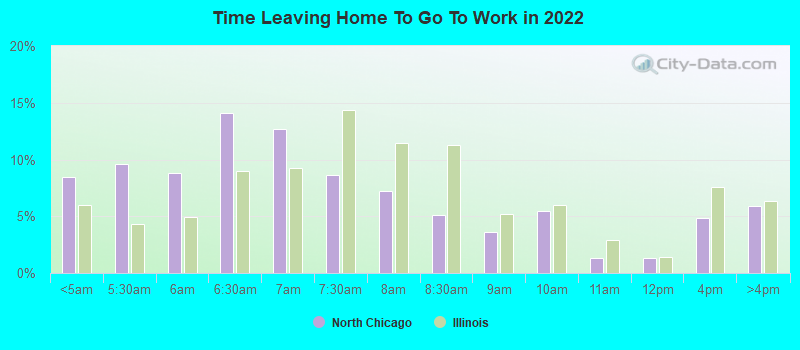
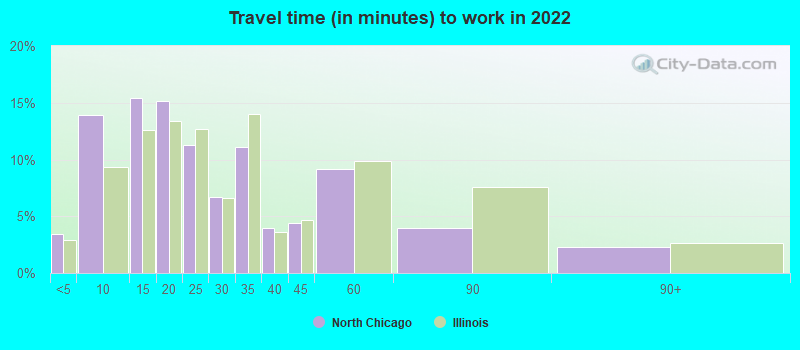
Travel time to work (commute)
Less than 5 minutes: 1,0945 to 9 minutes: 3,19010 to 14 minutes: 3,04115 to 19 minutes: 2,29320 to 24 minutes: 1,69025 to 29 minutes: 83830 to 34 minutes: 1,07135 to 39 minutes: 26240 to 44 minutes: 19445 to 59 minutes: 49360 to 89 minutes: 22090 or more minutes: 77
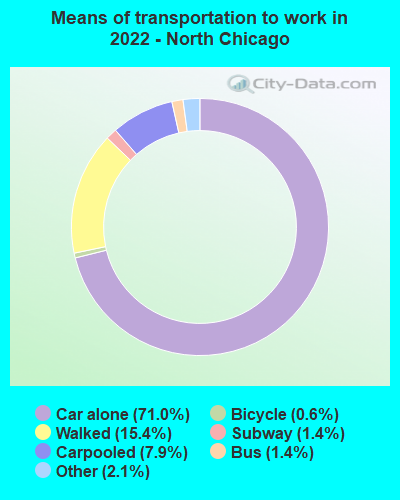
Means of transportation to work:
Drove a car alone: 14,684 (59.3%)Carpooled: 1,668 (6.7%)Bus : 318 (1.3%)Subway or elevated rail : 23 (0.1%)Long-distance train or commuter rail : 260 (1.1%)Light rail, streetcar or trolley : 17 (0.1%)Taxi: 448 (1.8%)Bicycle: 166 (0.7%)Walked: 3,212 (13.0%)Worked at home: 3,820 (15.4%)
Unemployment by race in 2022
Unemployment rate for White non-Hispanic residents 5.7% Males10.2% FemalesUnemployment rate for Black residents 6.6% Males6.8% FemalesUnemployment rate for Asian residents 12.3% Males5.1% FemalesUnemployment rate for other race residents 1.8% MalesUnemployment rate for two or more race residents 4.5% Males5.2% FemalesUnemployment rate for Hispanic or Latino residents 4.2% Males5.6% Females
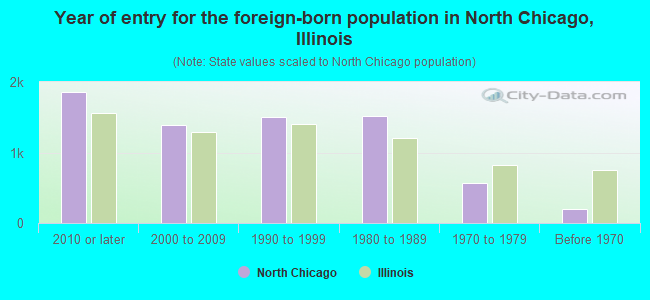
Year of entry for the foreign-born population in North Chicago, Illinois
1,853 2010 or later 1,388 2000 to 2009 1,505 1990 to 1999 1,516 1980 to 1989 572 1970 to 1979 204 Before 1970
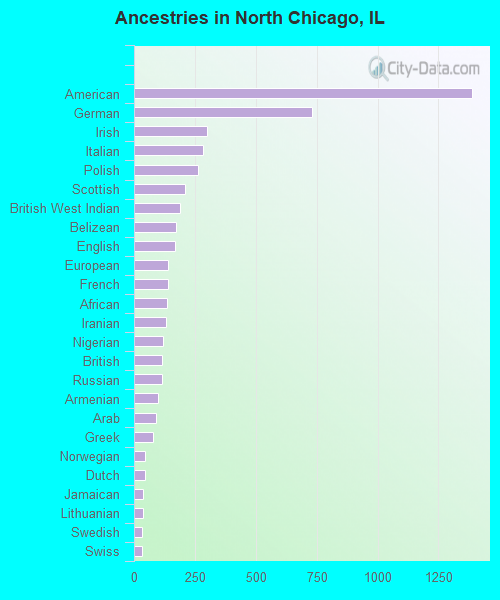
First ancestries reported:
American: 1,388 (7.3%)
German: 729 (3.8%)
Irish: 301 (1.6%)
Italian: 285 (1.5%)
Polish: 263 (1.4%)
Scottish: 211 (1.1%)
British West Indian: 187 (1.0%)
Belizean: 173 (0.9%)
English: 167 (0.9%)
European: 139 (0.7%)
French: 138 (0.7%)
African: 137 (0.7%)
Iranian: 133 (0.7%)
Nigerian: 118 (0.6%)
British: 116 (0.6%)
Russian: 114 (0.6%)
Armenian: 99 (0.5%)
Arab: 90 (0.5%)
Greek: 80 (0.4%)
Norwegian: 47 (0.2%)
Dutch: 46 (0.2%)
Jamaican: 37 (0.2%)
Lithuanian: 36 (0.2%)
Swedish: 34 (0.2%)
Swiss: 34 (0.2%)
Ukrainian: 27 (0.1%)
South African: 26 (0.1%)
Slovene: 19 (0.10%)
German Russian: 16 (0.08%)
Eastern European: 13 (0.07%)
Brazilian: 13 (0.07%)
Welsh: 13 (0.07%)
Danish: 11 (0.06%)
Albanian: 11 (0.06%)
Estonian: 10 (0.05%)
Haitian: 8 (0.04%)
Luxembourger: 5 (0.03%)
Scandinavian: 5 (0.03%)
Sierra Leonean: 5 (0.03%)
Afghan: 3 (0.02%)
Egyptian: 2 (0.01%) Most common places of birth for foreign-born residents (%): Mexico North Chicago:
56.2% (3,059)Illinois:
34.7% (626,958)
Belize North Chicago:
6.9% (376)Illinois:
0.3% (4,639)
India North Chicago:
6.1% (332)Illinois:
9.2% (166,409)
Philippines North Chicago:
5.8% (318)Illinois:
5.2% (93,003)
Honduras North Chicago:
3.9% (214)Illinois:
0.6% (10,762)
Ecuador North Chicago:
2.4% (128)Illinois:
0.9% (16,844)
China, excluding Hong Kong and Taiwan North Chicago:
2.3% (126)Illinois:
4.1% (74,364)
Colombia North Chicago:
2.2% (118)Illinois:
0.9% (16,553)
El Salvador North Chicago:
2.1% (115)Illinois:
0.6% (11,009)
France North Chicago:
2.0% (107)Illinois:
0.3% (5,895)
Kenya North Chicago:
1.9% (101)Illinois:
0.1% (2,357)
Place of birth for U.S.-born residents:
This state: 9,636Other state: 14,538Northeast: 2,113Midwest: 2,407South: 6,111West: 4,271 62.3% of North Chicago residents lived in the same house 1 years ago.
Out of people who lived in different houses, 16.6% lived in this county.
Out of people who lived in different counties, 13.4% lived in Illinois.
North Chicago:
62.3%State average:
88.3%
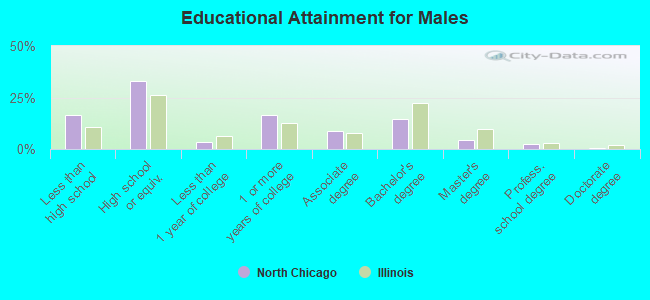
Education attainment for males 25 years and older:
No schooling: 237Nursery to 4th grade: 1095th and 6th grade: 2937th and 8th grade: 1089th grade: 6910th grade: 14311th grade: 4712th grade, no diploma: 226High school graduate (or equivalency): 2,449Less than 1 year of college: 238Some college more than 1 year, no degree: 1,227Associate degree: 655Bachelor's degree: 1,087Master's degree: 325Professional school degree: 189Doctorate degree: 52
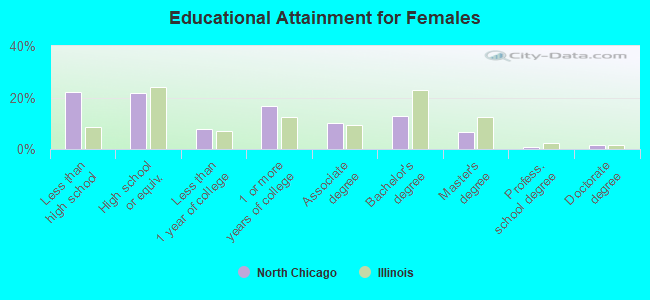
Education attainment for females 25 years and older:
No schooling: 243Nursery to 4th grade: 705th and 6th grade: 1527th and 8th grade: 1679th grade: 10610th grade: 15311th grade: 20012th grade, no diploma: 269High school graduate (or equivalency): 1,339Less than 1 year of college: 481Some college more than 1 year, no degree: 1,028Associate degree: 614Bachelor's degree: 798Master's degree: 402Professional school degree: 55Doctorate degree: 88
Housing units in structures:
One, detached: 3,230One, attached: 900Two: 1,0973 or 4: 6665 to 9: 87910 to 19: 84520 to 49: 38550 or more: 339Mobile homes: 9Boats, RVs, vans, etc.: 11Housing units lacking complete plumbing facilities in 2022: 1.3%Housing units lacking complete kitchen facilities in 2022: 1.5%House/condo owner moved in on average 15 years ago
Renter moved in on average 2 years ago
Private vs. public school enrollment:
Students in private schools in grades 1 to 8 (elementary and middle school): 175 Students in private schools in grades 9 to 12 (high school): 158 Students in private undergraduate colleges: 576