Northampton, MA (Massachusetts) Houses and Residents
| Northampton: | $417,221 |
| Massachusetts: | $534,700 |
Mean price in 2022:
Detached houses: $540,699
Here: $540,699 State: $651,570 Townhouses or other attached units: $397,291
Here: $397,291 State: $617,749 In 2-unit structures: $467,814
Here: $467,814 State: $594,808 In 3-to-4-unit structures: $632,796
Here: $632,796 State: $601,912 In 5-or-more-unit structures: $299,348
Here: $299,348 State: $555,768
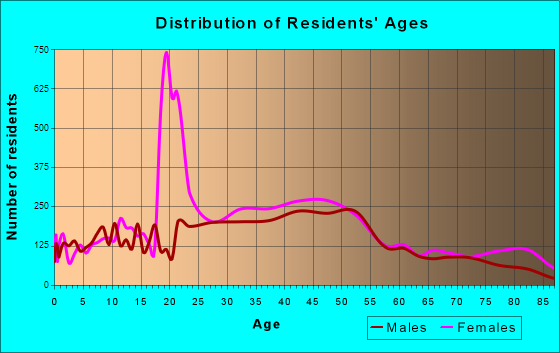
Total population: 28,554 (Urban population: 25,400, Rural population: 3,578 (all nonfarm))
Houses: 13,208 (12,497 occupied: 7,294 owner occupied, 5,203 renter occupied)
| % of renters here: | 42% |
| State: | 38% |
Housing density: 383 houses/condos per square mile
Median price asked for vacant for-sale houses and condos in 2022: $322,424.
Median contract rent in 2022: $1,267 (lower quartile is $991, upper quartile is $1,843)
Median rent asked for vacant for-rent units in 2022: $1,123
Median gross rent in Northampton, MA in 2022: $1,408
Housing units in Northampton with a mortgage: 4,268 (735 second mortgage, 0 home equity loan, 590 both second mortgage and home equity loan)
Houses without a mortgage: 275
Median household income for houses/condos with a mortgage: $129,049
Median household income for apartments without a mortgage: $91,287
Median monthly housing costs: $1,522
Compare current foreclosures near Northampton, MA:
| Photo | Address | Area | Beds / Baths | Price | Details |
|---|---|---|---|---|---|

|
#1
Myrtle St # 1
Northampton, MA 01060
|
2,222 sq. feet
|
2 baths 4 beds |
show details | |

|
#2
Main St Apt 2a
Northampton, MA 01060
|
- sq. feet
|
- baths - beds |
show details | |

|
#3
Barrett St Apt 22
Northampton, MA 01060
|
- sq. feet
|
- baths - beds |
show details | |

|
#4
Day Ave
Northampton, MA 01060
|
- sq. feet
|
- baths - beds |
show details | |

|
#5
Damon Rd Apt 4108
Northampton, MA 01060
|
- sq. feet
|
- baths - beds |
show details | |

|
#6
Walnut Street
Springfield, MA 01105
|
2,850 sq. feet
|
2 baths 6 beds |
$99,900
|
show details |

|
#7
Cold Spring Rd
Southampton, MA 01073
|
2,736 sq. feet
|
1 baths 3 beds |
$284,900
|
show details |

|
#8
W Franklin St
Holyoke, MA 01040
|
1,558 sq. feet
|
1 baths 2 beds |
$234,900
|
show details |

|
#9
Newman St
Springfield, MA 01105
|
1,676 sq. feet
|
2 baths 3 beds |
$45,900
|
show details |

|
#10
Foster St
Springfield, MA 01105
|
1,512 sq. feet
|
2 baths 4 beds |
show details |
| Photo | Address | Area | Beds / Baths | Price | Details |
|---|---|---|---|---|---|

|
#11
Brown Ave
Holyoke, MA 01040
|
2,388 sq. feet
|
2 baths 6 beds |
show details | |

|
#12
Royal St
Chicopee, MA 01020
|
3,296 sq. feet
|
4 baths 7 beds |
show details | |

|
#13
Pendleton Ave
Chicopee, MA 01022
|
1,024 sq. feet
|
1 baths 2 beds |
show details | |

|
#14
Wilfred St
Chicopee, MA 01020
|
1,360 sq. feet
|
1 baths 4 beds |
show details | |

|
#15
Dressel Ave
Belchertown, MA 01007
|
1,098 sq. feet
|
1 baths 3 beds |
show details | |

|
#16
Joy St
Chicopee, MA 01013
|
1,780 sq. feet
|
2 baths 4 beds |
show details | |

|
#17
Granby Rd
Chicopee, MA 01013
|
945 sq. feet
|
1 baths 2 beds |
show details | |

|
#18
Russell Stage Rd
Blandford, MA 01008
|
1,650 sq. feet
|
2 baths 3 beds |
show details | |

|
#19
Connecticut Ave
West Springfield, MA 01089
|
- sq. feet
|
2 baths 4 beds |
show details | |

|
#20
Skyridge St
Ludlow, MA 01056
|
864 sq. feet
|
1 baths 3 beds |
show details |
| Photo | Address | Area | Beds / Baths | Price | Details |
|---|---|---|---|---|---|

|
#21
Medford St
Chicopee, MA 01020
|
1,352 sq. feet
|
2 baths 3 beds |
show details | |

|
#22
Notre Dame St
Springfield, MA 01104
|
1,310 sq. feet
|
2 baths 4 beds |
show details | |

|
#23
Ontario St
Springfield, MA 01104
|
1,405 sq. feet
|
1 baths 3 beds |
show details | |

|
#24
Montgomery St
Westfield, MA 01085
|
1,714 sq. feet
|
2 baths 4 beds |
show details | |

|
#25
Derryfield Ave
Springfield, MA 01118
|
1,188 sq. feet
|
1 baths 3 beds |
show details | |

|
#26
Ontario St
Springfield, MA 01104
|
1,260 sq. feet
|
1 baths 3 beds |
show details | |

|
#27
Phoenix Ter
Springfield, MA 01104
|
1,067 sq. feet
|
1 baths 3 beds |
show details | |

|
#28
Pleasant St
Holyoke, MA 01040
|
4,057 sq. feet
|
3 baths 6 beds |
show details | |

|
#29
Sabans Rd
Conway, MA 01341
|
1,246 sq. feet
|
2 baths 3 beds |
show details | |

|
#30
Washington St
Westfield, MA 01085
|
1,300 sq. feet
|
2 baths 3 beds |
show details |
| Photo | Address | Area | Beds / Baths | Price | Details |
|---|---|---|---|---|---|

|
#31
Grove St
West Springfield, MA 01089
|
1,566 sq. feet
|
1 baths 3 beds |
show details | |

|
#32
Laroche St
Ludlow, MA 01056
|
1,321 sq. feet
|
1 baths 3 beds |
show details | |

|
#33
Putnam St
Springfield, MA 01109
|
2,017 sq. feet
|
2 baths 4 beds |
show details | |

|
#34
Marmon St
Springfield, MA 01129
|
980 sq. feet
|
1 baths 2 beds |
show details | |

|
#35
Westford Ave
Springfield, MA 01109
|
3,358 sq. feet
|
2 baths 6 beds |
show details | |

|
#36
Moore St
Agawam, MA 01001
|
1,370 sq. feet
|
2 baths 3 beds |
show details | |

|
#37
Cloran St
Springfield, MA 01109
|
1,213 sq. feet
|
1 baths 2 beds |
show details | |

|
#38
Sterling St
Springfield, MA 01107
|
1,140 sq. feet
|
1 baths 3 beds |
show details | |

|
#39
Priestly Farms Rd
South Hadley, MA 01075
|
3,795 sq. feet
|
4 baths 4 beds |
show details | |

|
#40
Main St Unit 13
Westfield, MA 01085
|
1,250 sq. feet
|
1 baths 2 beds |
show details |
| Photo | Address | Area | Beds / Baths | Price | Details |
|---|---|---|---|---|---|

|
#41
Berkeley St
Springfield, MA 01109
|
1,924 sq. feet
|
1 baths 5 beds |
show details | |

|
#42
Bristol St
Ludlow, MA 01056
|
1,466 sq. feet
|
1 baths 3 beds |
show details | |

|
#43
Leavitt St
Springfield, MA 01109
|
1,344 sq. feet
|
1 baths 3 beds |
show details | |

|
#44
Princeton St
Springfield, MA 01109
|
2,750 sq. feet
|
1 baths 4 beds |
show details | |

|
#45
Morton St
West Springfield, MA 01089
|
907 sq. feet
|
1 baths 2 beds |
show details | |

|
#46
Sylvester St
Springfield, MA 01109
|
1,354 sq. feet
|
1 baths 2 beds |
show details | |

|
#47
Saint James Ave
Springfield, MA 01109
|
2,945 sq. feet
|
2 baths 6 beds |
show details | |

|
#48
Bancroft St
Springfield, MA 01107
|
2,786 sq. feet
|
2 baths 6 beds |
show details | |

|
#49
Jasper St
Springfield, MA 01109
|
1,008 sq. feet
|
1 baths 3 beds |
show details | |

|
Check over 1 million property listings on Foreclosure.com!
|
browse all offers | |||

Latest news about housing in Northampton, MA collected exclusively by city-data.com from local newspapers, TV, and radio stations


Median year apartment built: 1966
Household type by relationship:
Households: 29,833- Male householders: 5,457 (1,785 living alone), Female householders: 7,581 (2,972 living alone)
5,024 spouses (4,755 opposite-sex spouses), 1,342 unmarried partners, (1,136 opposite-sex unmarried partners), 5,405 children (4,862 natural, 376 adopted, 166 stepchildren), 125 grandchildren, 82 brothers or sisters, 133 parents, 20 foster children, 162 other relatives, 766 non-relatives
- In group quarters: 3,730
Size of family households: 2,974 2-persons, 1,629 3-persons, 1,186 4-persons, 184 5-persons, 66 6-persons, 22 7-or-more-persons.
Size of nonfamily households: 4,487 1-person, 1,813 2-persons, 278 3-persons, 23 4-persons.
2,549 married couples with children.
907 single-parent households (180 men, 727 women).
86.3% of residents of Northampton speak English at home.
6.7% of residents speak Spanish at home (56% speak English very well, 15% speak English well, 23% speak English not well, 6% don't speak English at all).
4.3% of residents speak other Indo-European language at home (72% speak English very well, 17% speak English well, 11% speak English not well).
2.0% of residents speak Asian or Pacific Island language at home (69% speak English very well, 24% speak English well, 7% speak English not well).
0.4% of residents speak other language at home (89% speak English very well, 2% speak English well, 9% speak English not well).
Foreign born population: 2,893 (9.7%)
(49.2% of them are naturalized citizens)
| Here: | 6.7 |
| State: | 6.5 |
| Here: | 4.2 |
| State: | 4.0 |

- Bedrooms in owner-occupied houses and condos in Northampton, Massachusetts
- 0no bedroom
- 4521 bedroom
- 1,8112 bedrooms
- 3,0113 bedrooms
- 1,6104 bedrooms
- 4115+ bedrooms

- Bedrooms in renter-occupied apartments in Northampton, Massachusetts
- 603no bedroom
- 1,6481 bedroom
- 2,3512 bedrooms
- 5523 bedrooms
- 154 bedrooms
- 345+ bedrooms

- Cars and other vehicles available in Northampton in owner-occupied houses/condos
- 134no vehicle
- 2,2351 vehicle
- 3,4922 vehicles
- 1,2043 vehicles
- 1874 vehicles
- 435+ vehicles

- Cars and other vehicles available in Northampton in renter-occupied apartments
- 1,154no vehicle
- 2,7651 vehicle
- 1,1102 vehicles
- 1713 vehicles
- 44 vehicles
- 05+ vehicles

- Rooms in owner-occupied houses in Northampton, Massachusetts
- 01 room
- 862 rooms
- 3323 rooms
- 5994 rooms
- 1,1255 rooms
- 1,4286 rooms
- 1,3927 rooms
- 9588 rooms
- 1,3759+ rooms

- Rooms in renter-occupied apartments in Northampton, Massachusetts
- 5691 room
- 4972 rooms
- 1,0753 rooms
- 1,1754 rooms
- 1,0895 rooms
- 5786 rooms
- 1817 rooms
- 308 rooms
- 89+ rooms


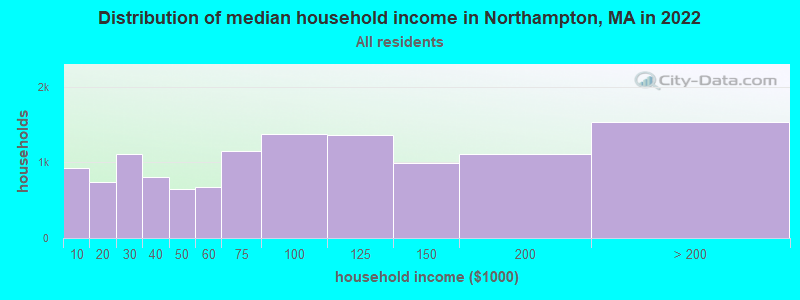
Northampton, MA household income distribution

- 923Less than $10,000
- 745$10,000 to $19,999
- 1,108$20,000 to $29,999
- 802$30,000 to $39,999
- 655$40,000 to $49,999
- 681$50,000 to $59,999
- 1,151$60,000 to $74,999
- 1,372$75,000 to $99,999
- 1,366$100,000 to $124,999
- 997$125,000 to $149,999
- 1,118$150,000 to $199,999
- 1,536$200,000 or more
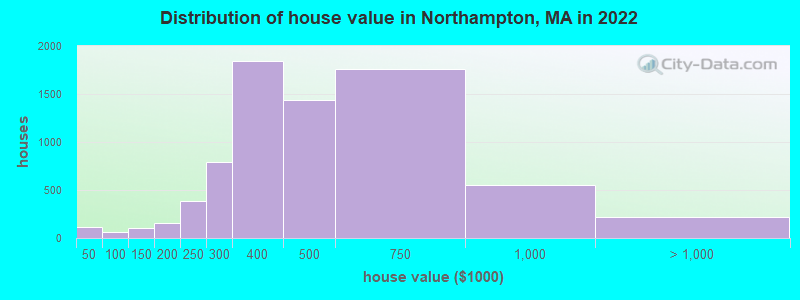
Home value of owner - occupied houses in 2022 in Northampton, MA
-
- 30Less than $10,000
- 19$15,000 to $19,999
- 28$20,000 to $24,999
- 6$25,000 to $29,999
- 13$30,000 to $34,999
- 20$35,000 to $39,999
- 5$50,000 to $59,999
- 53$60,000 to $69,999
- 25$100,000 to $124,999
- 80$125,000 to $149,999
- 102$150,000 to $174,999
- 55$175,000 to $199,999
- 383$200,000 to $249,999
- 792$250,000 to $299,999
- 1,840$300,000 to $399,999
- 1,439$400,000 to $499,999
- 1,756$500,000 to $749,999
- 555$750,000 to $999,999
- 177$1,000,000 to $1,499,999
- 25$1,500,000 to $1,999,999
- 13$2,000,000 or more
Rent paid by renters in 2022 in Northampton, MA
-
- 81Less than $100
- 16$150 to $199
- 82$200 to $249
- 181$250 to $299
- 163$300 to $349
- 70$350 to $399
- 117$400 to $449
- 54$500 to $549
- 9$550 to $599
- 21$600 to $649
- 12$650 to $699
- 66$700 to $749
- 75$750 to $799
- 152$800 to $899
- 260$900 to $999
- 1,617$1,000 to $1,249
- 492$1,250 to $1,499
- 1,573$1,500 to $1,999
- 494$2,000 to $2,499
- 105$2,500 to $2,999
- 46$3,000 to $3,499
- 86No cash rent


Percentage of workers working in this county: 74.6%
Number of people working at home: 3,528 (25.0% of all workers)
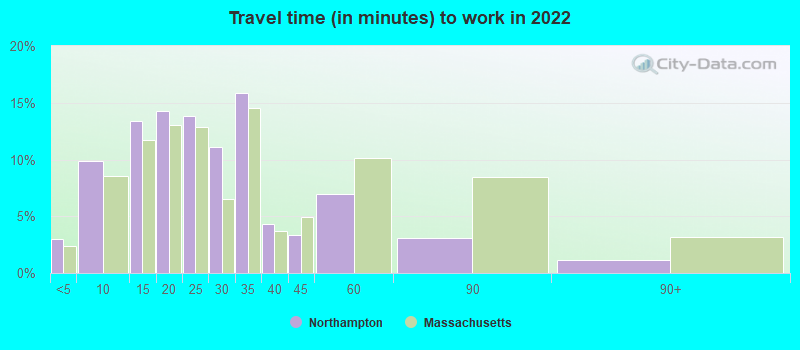
Travel time to work (commute)
- Less than 5 minutes: 607
- 5 to 9 minutes: 1,550
- 10 to 14 minutes: 1,909
- 15 to 19 minutes: 1,685
- 20 to 24 minutes: 1,930
- 25 to 29 minutes: 1,020
- 30 to 34 minutes: 1,763
- 35 to 39 minutes: 281
- 40 to 44 minutes: 482
- 45 to 59 minutes: 299
- 60 to 89 minutes: 239
- 90 or more minutes: 33
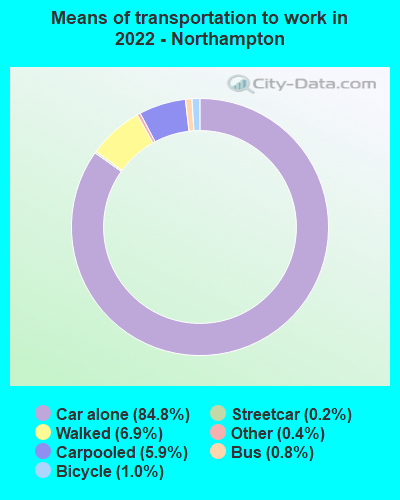
Means of transportation to work:
- Drove a car alone: 14,639 (70.5%)
- Carpooled: 1,080 (5.2%)
- Bus: 128 (0.6%)
- Subway or elevated rail: 24 (0.1%)
- Taxi: 83 (0.4%)
- Bicycle: 183 (0.9%)
- Walked: 1,159 (5.6%)
- Worked at home: 3,528 (17.0%)

- Unemployment by race in 2022
- Unemployment rate for White non-Hispanic residents
- 2.9%Males
- 5.4%Females
- Unemployment rate for Black residents
- 14.4%Males
- 5.7%Females
- Unemployment rate for Asian residents
- 7.0%Females
- Unemployment rate for other race residents
- 0.3%Males
- 17.0%Females
- Unemployment rate for two or more race residents
- 3.5%Males
- 1.5%Females
- Unemployment rate for Hispanic or Latino residents
- 3.5%Males
- 4.5%Females

- Year of entry for the foreign-born population in Northampton, Massachusetts
- 1,0492010 or later
- 5022000 to 2009
- 4371990 to 1999
- 4421980 to 1989
- 2771970 to 1979
- 409Before 1970

First ancestries reported:
- English: 1,355 (12.2%)
- Irish: 1,208 (10.9%)
- European: 662 (5.9%)
- American: 647 (5.8%)
- Italian: 592 (5.3%)
- Polish: 562 (5.0%)
- French Canadian: 388 (3.5%)
- French: 257 (2.3%)
- Eastern European: 239 (2.1%)
- German: 238 (2.1%)
- Scottish: 162 (1.5%)
- Russian: 143 (1.3%)
- British: 127 (1.1%)
- Lithuanian: 104 (0.9%)
- Dutch: 103 (0.9%)
- Brazilian: 69 (0.6%)
- Trinidadian and Tobagonian: 69 (0.6%)
- Greek: 67 (0.6%)
- Armenian: 65 (0.6%)
- Norwegian: 65 (0.6%)
- Finnish: 58 (0.5%)
- Icelander: 41 (0.4%)
- Scotch-Irish: 39 (0.4%)
- Canadian: 31 (0.3%)
- Czech: 29 (0.3%)
- Jamaican: 28 (0.3%)
- Ukrainian: 25 (0.2%)
- Danish: 24 (0.2%)
- Hungarian: 23 (0.2%)
- Iranian: 22 (0.2%)
- South African: 22 (0.2%)
- Swiss: 22 (0.2%)
- Swedish: 20 (0.2%)
- Portuguese: 19 (0.2%)
- Northern European: 15 (0.1%)
- Scandinavian: 14 (0.1%)
- Haitian: 14 (0.1%)
- Turkish: 13 (0.1%)
- Czechoslovakian: 13 (0.1%)
- Macedonian: 12 (0.1%)
- Kenyan: 11 (0.10%)
- Welsh: 11 (0.10%)
- Slovene: 9 (0.08%)
- Ghanaian: 8 (0.07%)
- Cape Verdean: 8 (0.07%)
- Austrian: 7 (0.06%)
- African: 7 (0.06%)
- Belgian: 6 (0.05%)
- West Indian: 6 (0.05%)
- Ethiopian: 2 (0.02%)
- Nigerian: 2 (0.02%)
- Cajun: 2 (0.02%)
Most common places of birth for foreign-born residents (%):
| Northampton: | 9.9% (265) |
| Massachusetts: | 8.4% (103,233) |
| Northampton: | 9.2% (246) |
| Massachusetts: | 1.0% (11,727) |
| Northampton: | 6.0% (159) |
| Massachusetts: | 3.7% (45,667) |
| Northampton: | 5.5% (146) |
| Massachusetts: | 7.6% (92,959) |
| Northampton: | 4.6% (122) |
| Massachusetts: | 6.8% (82,934) |
| Northampton: | 4.6% (122) |
| Massachusetts: | 0.9% (10,698) |
| Northampton: | 4.5% (119) |
| Massachusetts: | 1.0% (12,709) |
| Northampton: | 3.8% (102) |
| Massachusetts: | 2.3% (27,810) |
| Northampton: | 2.8% (74) |
| Massachusetts: | 1.0% (12,529) |
| Northampton: | 2.7% (71) |
| Massachusetts: | 0.6% (7,364) |
| Northampton: | 2.5% (68) |
| Massachusetts: | 1.5% (18,278) |
| Northampton: | 2.5% (67) |
| Massachusetts: | 1.1% (13,065) |
| Northampton: | 2.4% (63) |
| Massachusetts: | 2.7% (32,733) |
| Northampton: | 2.3% (61) |
| Massachusetts: | 1.4% (17,613) |
| Northampton: | 2.0% (54) |
| Massachusetts: | 2.3% (28,158) |
| Northampton: | 2.0% (54) |
| Massachusetts: | 0.1% (1,477) |
| Northampton: | 1.9% (52) |
| Massachusetts: | 0.1% (1,459) |
| Northampton: | 1.8% (49) |
| Massachusetts: | 0.9% (10,810) |
| Northampton: | 1.8% (48) |
| Massachusetts: | 0.0% (222) |
| Northampton: | 1.8% (47) |
| Massachusetts: | 3.0% (37,197) |
| Northampton: | 1.6% (44) |
| Massachusetts: | 0.7% (8,270) |
Place of birth for U.S.-born residents:
- This state: 14,916
- Other state: 10,987
- Northeast: 6,306
- Midwest: 1,564
- South: 2,059
- West: 1,050
81.0% of Northampton residents lived in the same house 1 years ago.
Out of people who lived in different houses, 27.3% lived in this county.
Out of people who lived in different counties, 53.0% lived in Massachusetts.
| Northampton: | 81.0% |
| State average: | 87.7% |
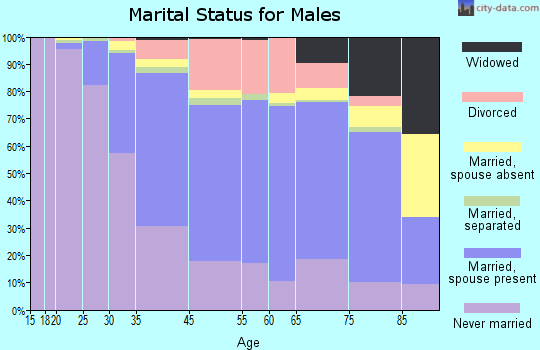
Education attainment for males 25 years and older:
- No schooling: 344
- Nursery to 4th grade: 51
- 5th and 6th grade: 9
- 7th and 8th grade: 208
- 9th grade: 84
- 10th grade: 107
- 11th grade: 63
- 12th grade, no diploma: 39
- High school graduate (or equivalency): 1,452
- Less than 1 year of college: 424
- Some college more than 1 year, no degree: 838
- Associate degree: 615
- Bachelor's degree: 2,830
- Master's degree: 1,807
- Professional school degree: 311
- Doctorate degree: 516

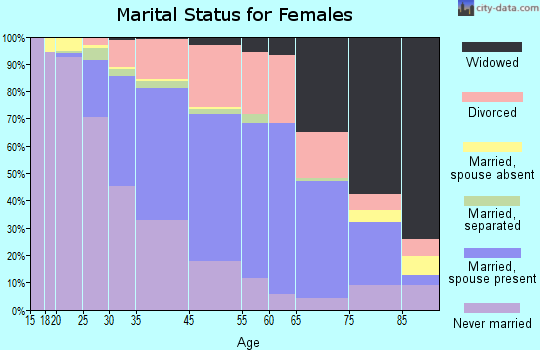
Education attainment for females 25 years and older:
- No schooling: 68
- Nursery to 4th grade: 6
- 5th and 6th grade: 116
- 7th and 8th grade: 32
- 9th grade: 87
- 10th grade: 109
- 11th grade: 26
- 12th grade, no diploma: 46
- High school graduate (or equivalency): 1,052
- Less than 1 year of college: 376
- Some college more than 1 year, no degree: 618
- Associate degree: 811
- Bachelor's degree: 3,463
- Master's degree: 3,541
- Professional school degree: 453
- Doctorate degree: 579

Housing units in structures:
- One, detached: 6,063
- One, attached: 1,054
- Two: 1,409
- 3 or 4: 1,434
- 5 to 9: 1,237
- 10 to 19: 663
- 20 to 49: 681
- 50 or more: 654
- Mobile homes: 10
Housing units lacking complete kitchen facilities in 2022: 3.3%
House/condo owner moved in on average 14 years ago
Renter moved in on average 5 years ago

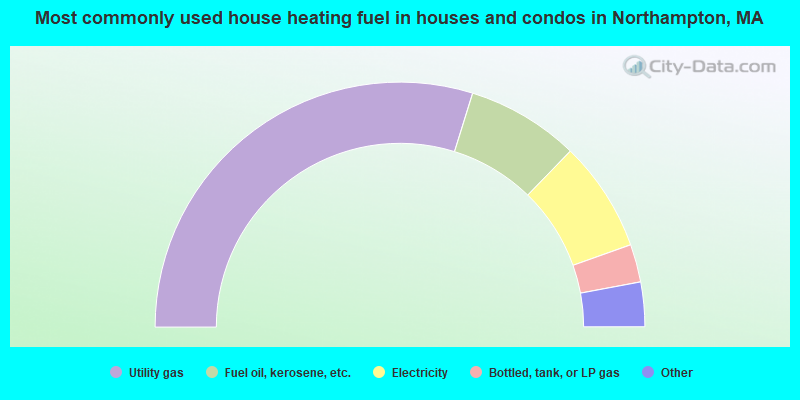
- 59.6%Utility gas
- 14.9%Fuel oil, kerosene, etc.
- 14.6%Electricity
- 5.0%Bottled, tank, or LP gas
- 2.4%Wood
- 2.1%Other fuel
- 1.0%Solar energy
- 0.2%Coal or coke
- 0.2%No fuel used
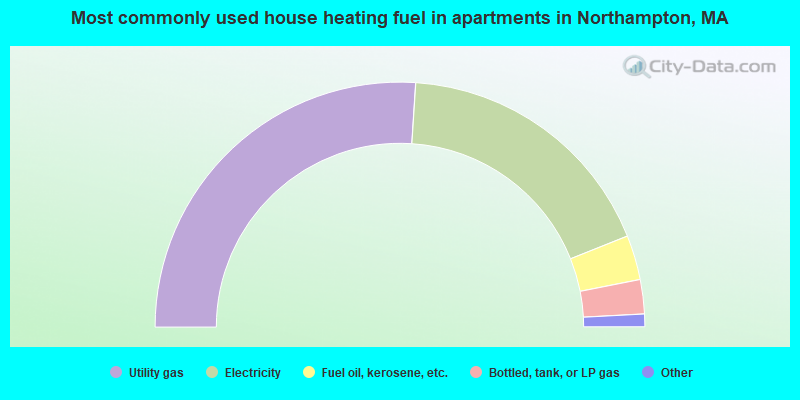
- 52.1%Utility gas
- 35.9%Electricity
- 5.9%Fuel oil, kerosene, etc.
- 4.5%Bottled, tank, or LP gas
- 0.8%Other fuel
- 0.5%Solar energy
- 0.4%No fuel used
Private vs. public school enrollment:
| Here: | 20.8% |
| Massachusetts: | 10.3% |
| Here: | 11.3% |
| Massachusetts: | 12.3% |
| Here: | 57.1% |
| Massachusetts: | 51.2% |


